RUM Network
The Network tab surfaces API and network performance from the mobile client's perspective - what your app actually experienced, not what your backend logs say it sent.
Avg Response Time by Endpoint
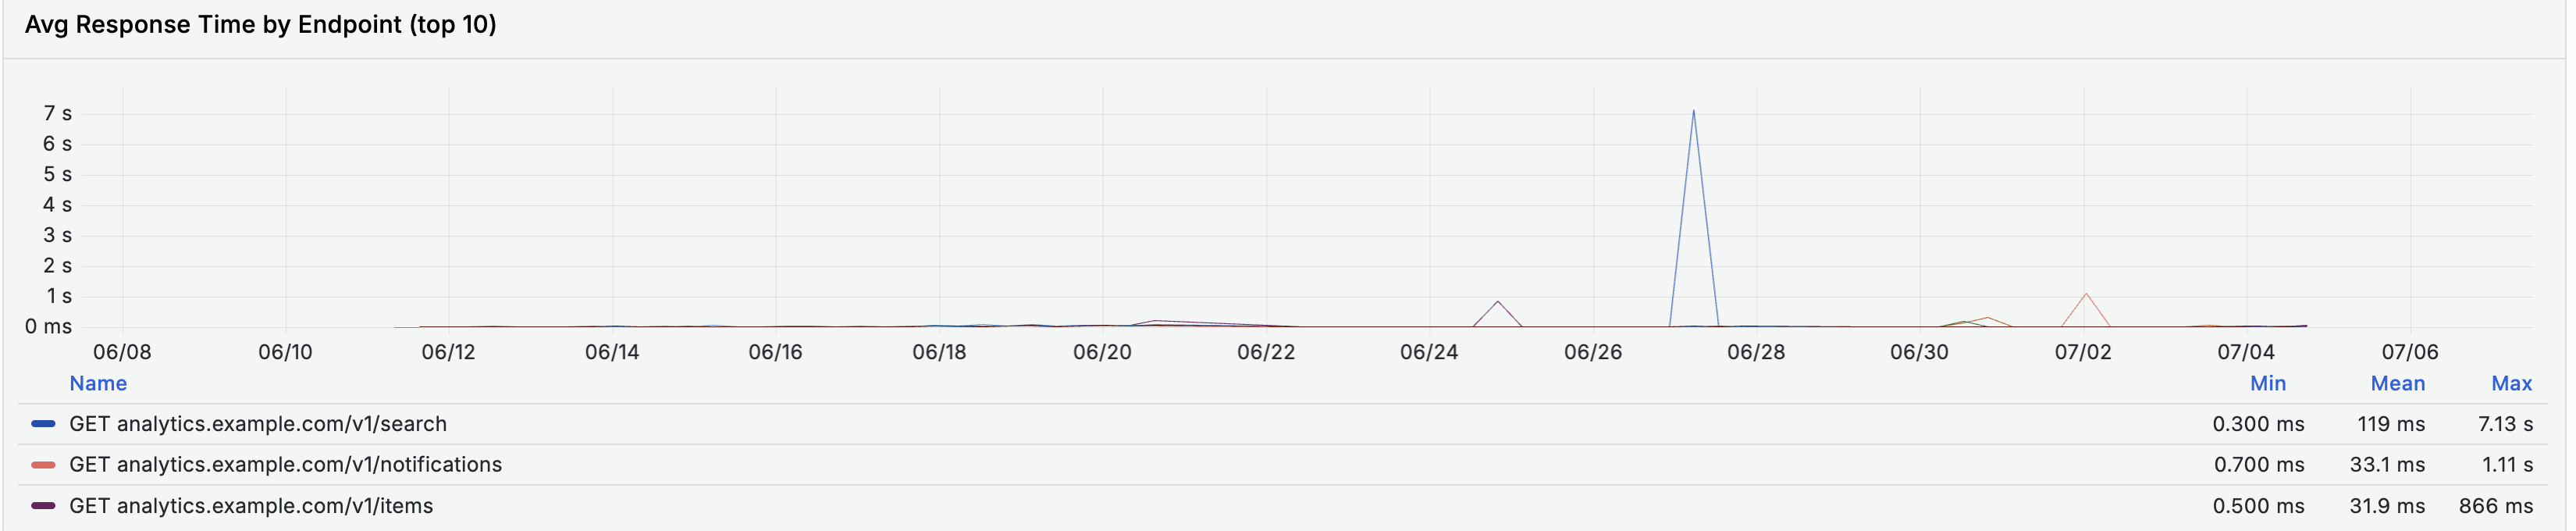
A time-series chart of the top 10 endpoints by response time, with a Name / Min / Mean / Max table underneath so you can spot both a slow trend and its worst-case latency per endpoint.
All Endpoints
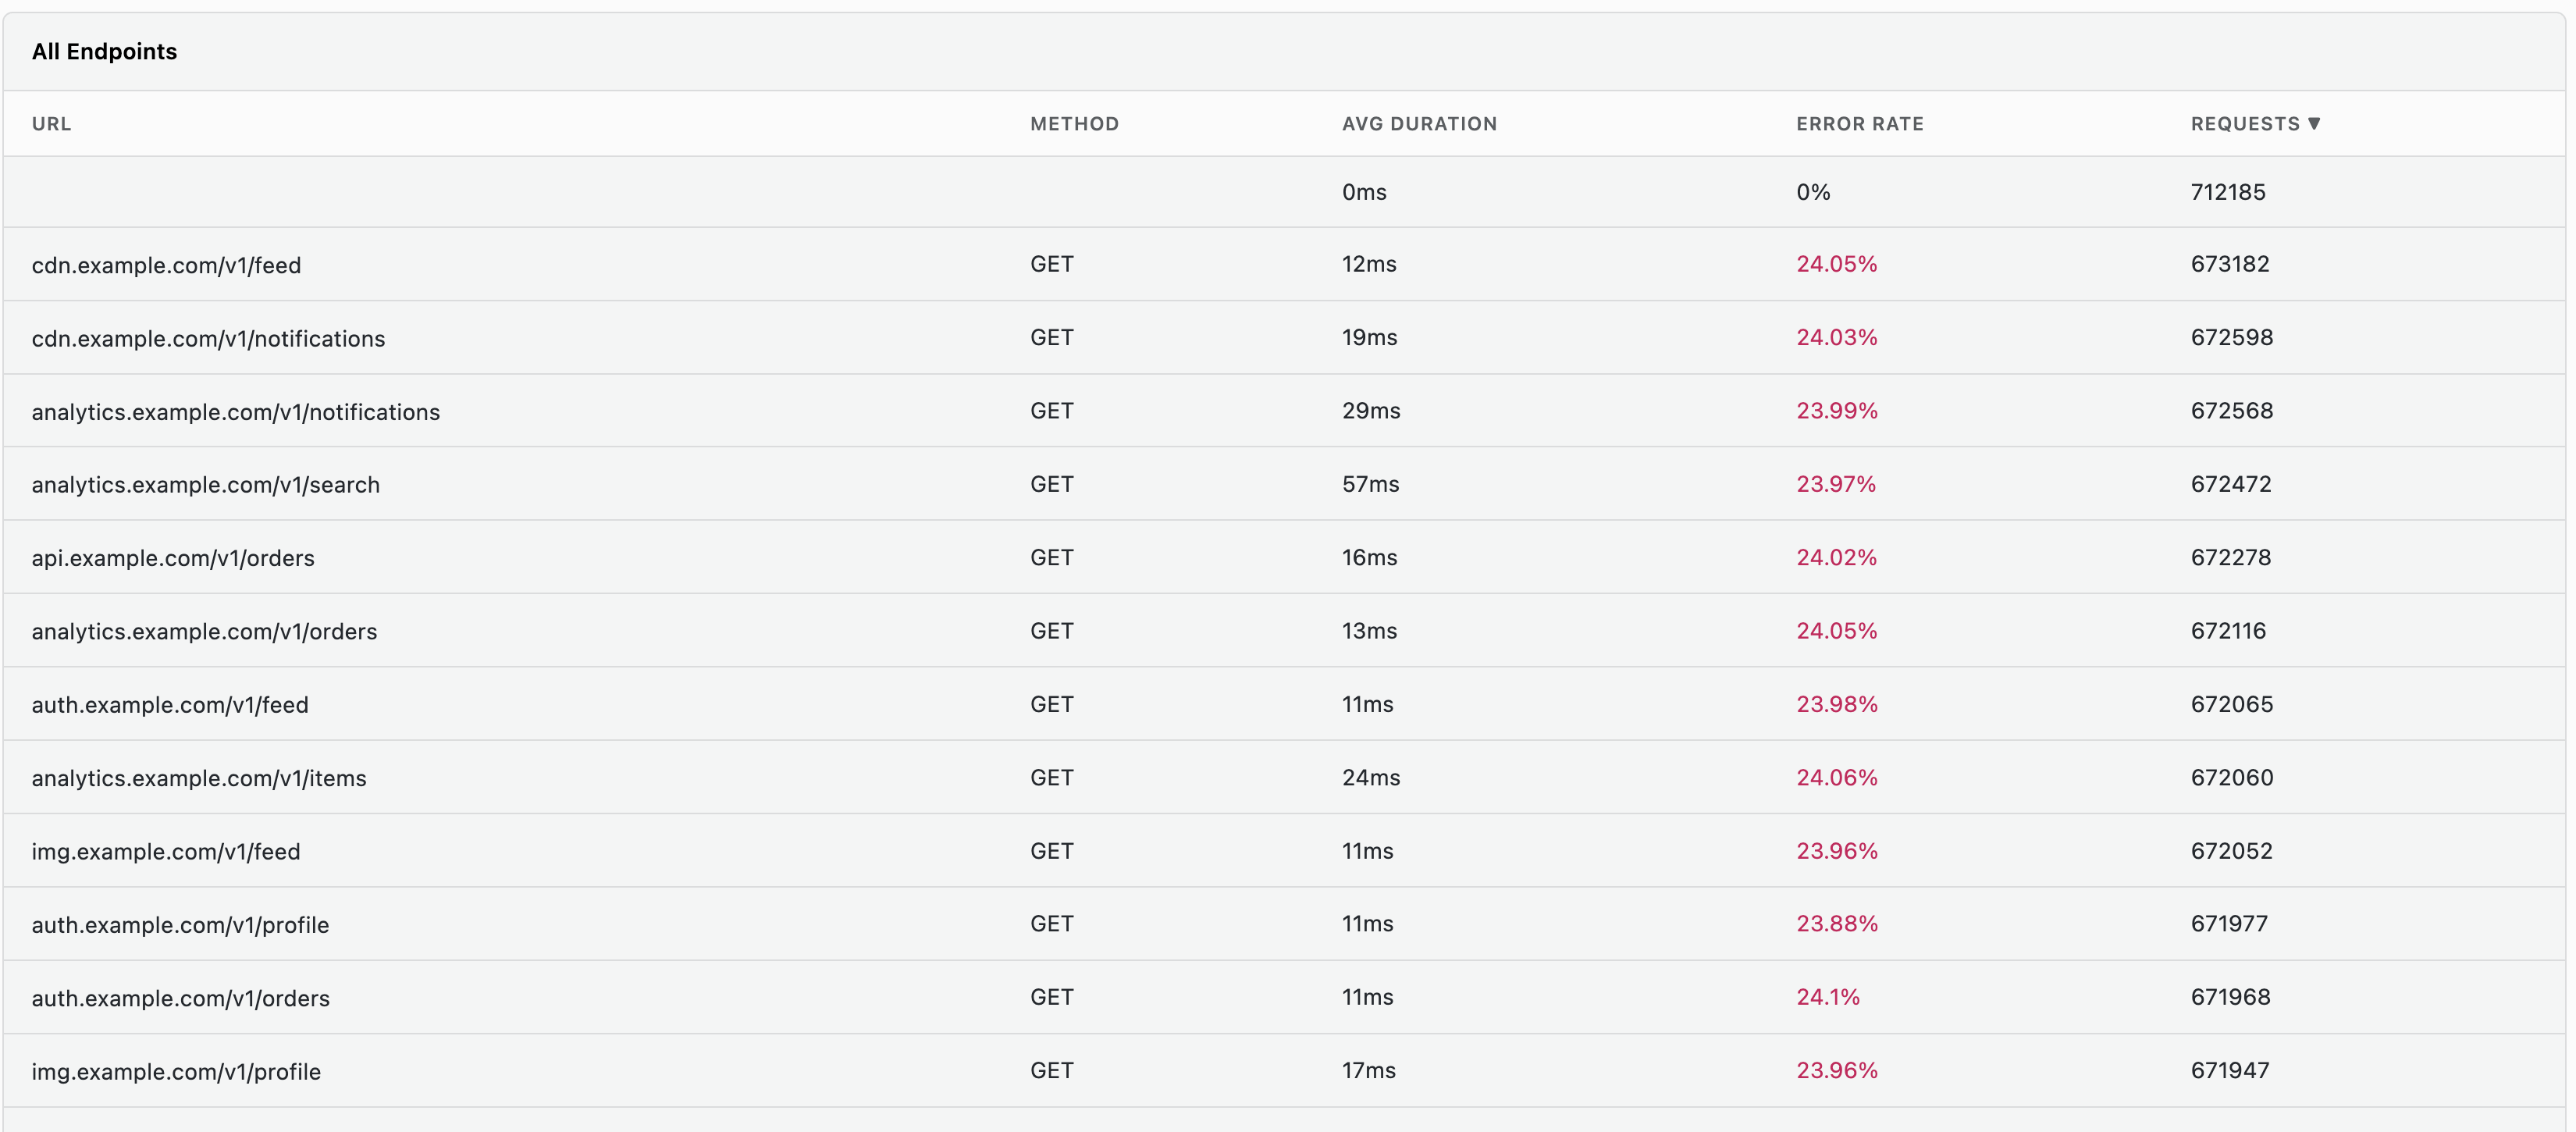
A table of every endpoint the app called:
| Column | Description |
|---|---|
| URL | The endpoint path |
| Method | HTTP method |
| Avg Duration | Average response time |
| Error Rate | Percentage of requests that failed |
| Requests | Total request count |
Sort by Error Rate or Requests to find the endpoints worth investigating first.
Failed Requests
A table scoped to just the failing calls: URL, Method, Status, Occurrences, and First/Last Seen - useful for catching an endpoint that's failing consistently even if its overall request volume is low enough to not stand out in All Endpoints.
Filters
Network adds HTTP-specific attributes to the shared
Filters sidebar: http.host, http.route,
http.method, http.status_code, and network.connection.type - use these
to scope every panel above to a specific host, route, verb, status class, or
connection type.
Use Cases
Finding a Slow Endpoint
- Check Avg Response Time by Endpoint for the top 10 offenders
- Cross-check All Endpoints, sorted by Avg Duration, for anything outside the top 10 that's still slow relative to its request volume
Catching a Silently Failing Endpoint
- Sort All Endpoints by Error Rate
- Open Failed Requests and filter by
http.routeto confirm the failure pattern (a specific status code, a specific host)
FAQ
Why are these response times worse than my backend's own numbers?
Because these are measured from the mobile client, so they include DNS, connection setup, radio wake-up, and the round trip your server never sees. The gap between the two is the part of the experience only the client can report.
How do I catch an endpoint that fails consistently but quietly?
Open Failed Requests rather than sorting All Endpoints by error rate. A low-volume endpoint failing every time can sit below the noise floor of the main table while still breaking a feature for everyone who reaches it.
Related Guides
- Getting Started - Interface layout and shared filters
- Sessions - See individual
http.requestevents in context - Screens - Screen-level performance, for issues that aren't network-bound
- APM Services - The backend side of a slow endpoint