Services and Operations
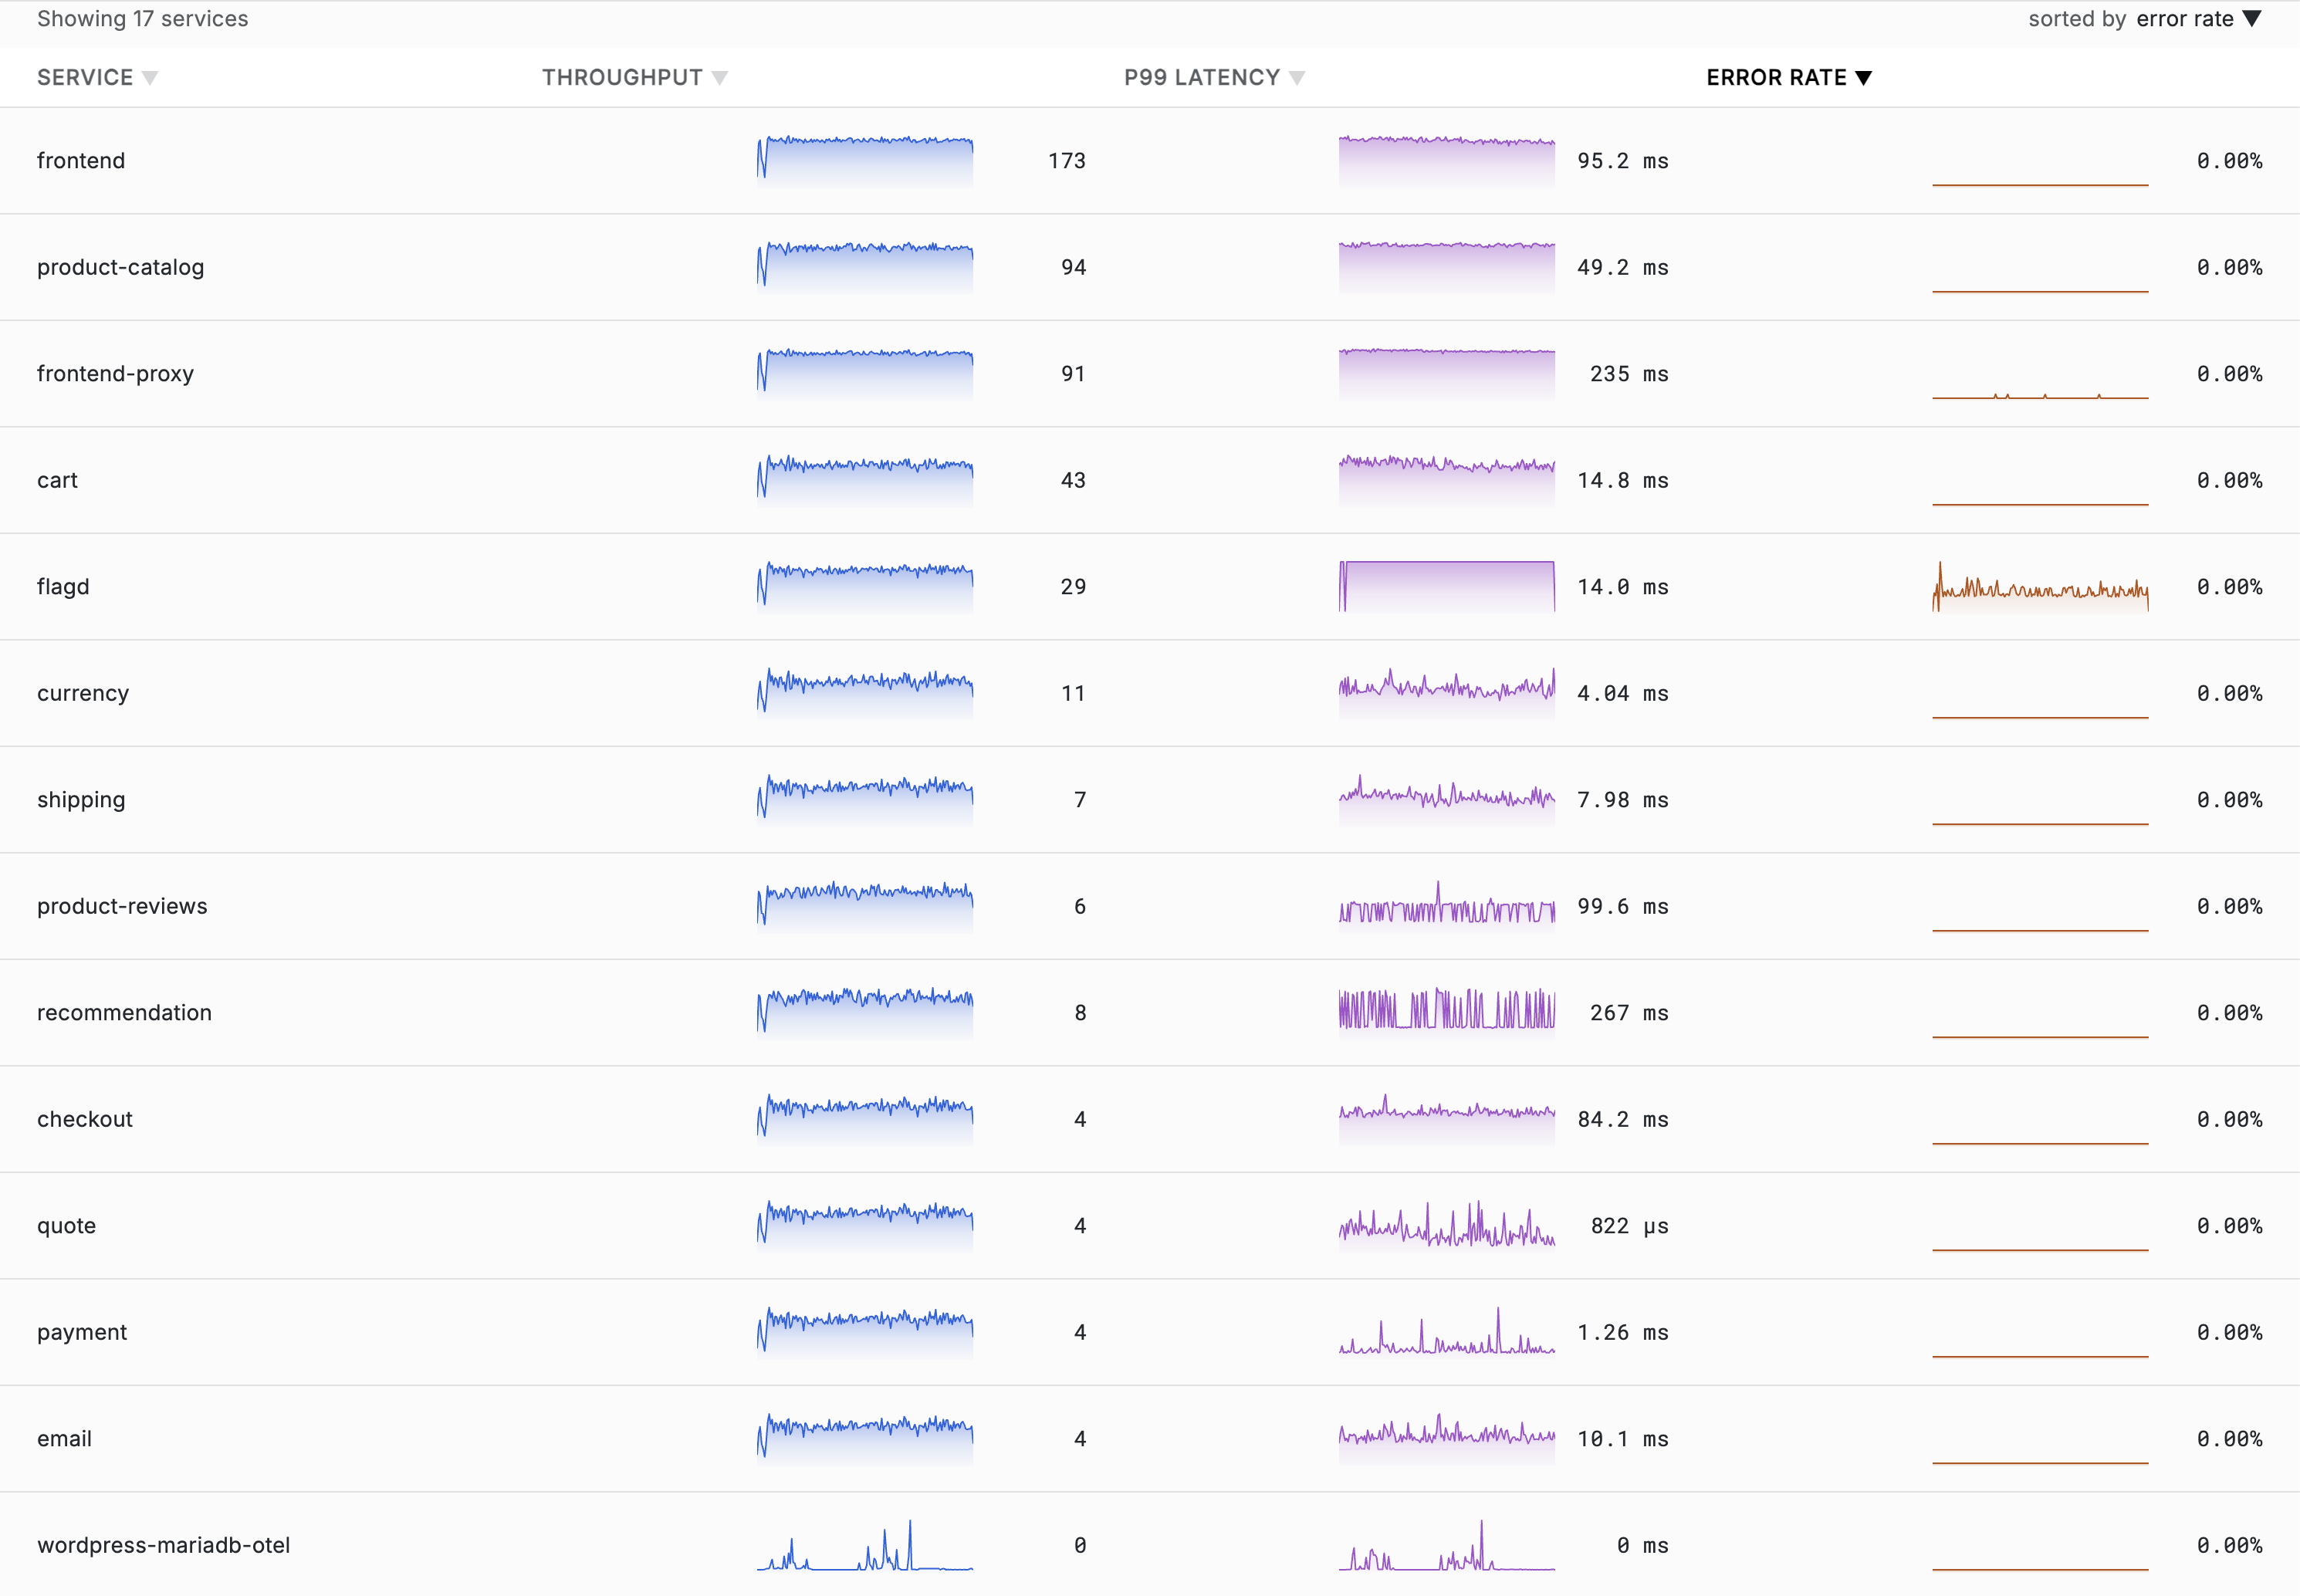
The Services tab compares every instrumented service over the selected time range. Start here to find unusual throughput, latency, or failures, then drill into the service and operation responsible.
Services Table
Each row shows one service:
| Column | Meaning |
|---|---|
| Service | Service name reported by OpenTelemetry instrumentation |
| Throughput | Current request rate, with its trend across the selected range |
| P99 latency | Current P99 server-span latency and its trend |
| Error rate | Share of server spans whose status is Error, with severity indication and trend |
Hovering a metric sparkline aligns the crosshair across the other metric columns in that row. Deployment and alert annotations appear in the sparklines when enabled.
- Click a column heading to sort.
- Use topbar search to filter by service name.
- Click a row to open Service Detail.

Filter Sidebar
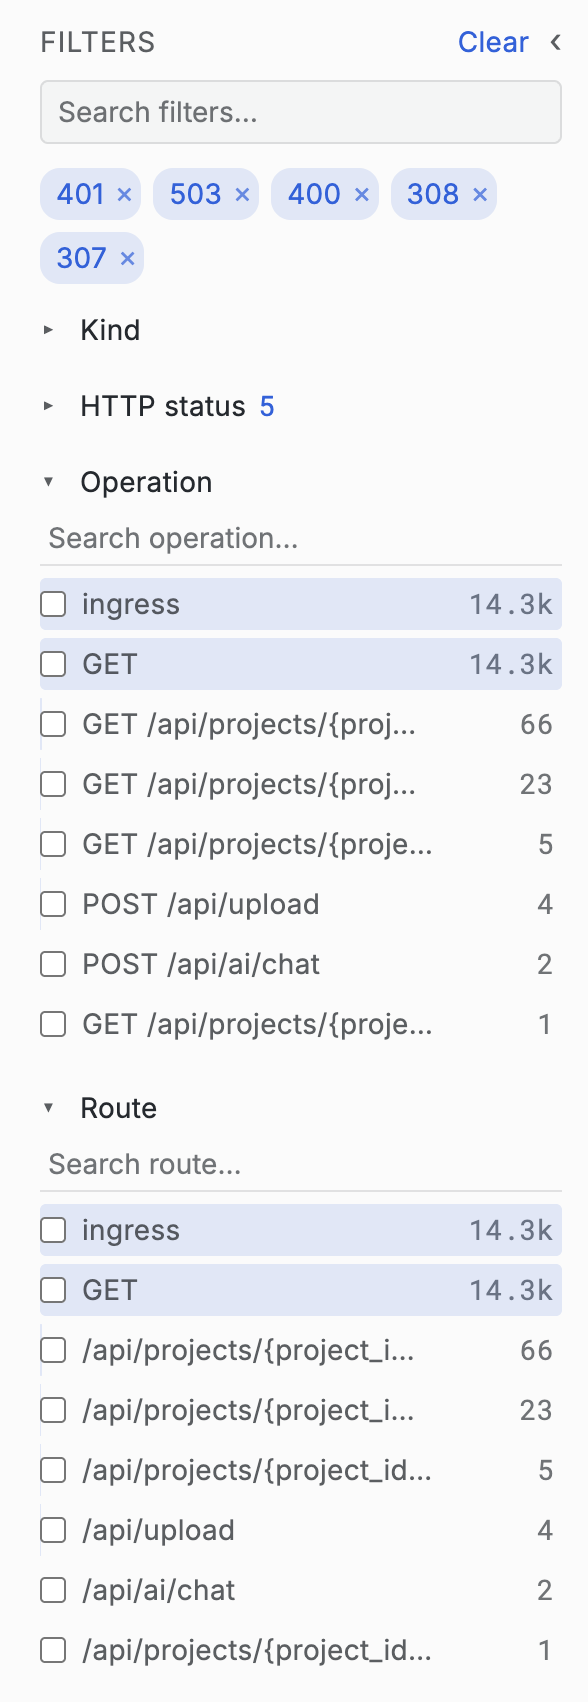
The sidebar facets services on the rollup columns configured by your administrator. Typical facets include span name, kind, status, HTTP status, and route.
- Select a value to add it to the scope.
- Select several values in a facet to include any of them.
- Use Only to replace that facet with one value.
- Use Clear to remove sidebar filters.
- Search within a facet when its value list is long.
Active filters also appear as chips above the page and are stored in the URL.
Service Detail
Clicking a service opens its detail page. It contains:
- Throughput over time.
- Latency with P50, P95, and P99 series.
- Error rate based on spans with Error status.
- A Spans table containing the service's server operations.
The charts and Spans table load independently. A slow table query therefore does not prevent aggregate charts from appearing.

Spans Table
Each operation row contains:
| Column | Meaning |
|---|---|
| Name | Server span or operation name |
| Latency (avg.) | Mean duration in the selected range |
| Throughput | Calls per minute |
| Failed rate | Percentage of calls with Error status |
Sort by a heading to find the busiest, slowest, or least reliable operation. Use Load more or page controls to browse additional rows.

Operation Detail
Click an operation row to open its detail view. This keeps the service context instead of immediately switching to Traces.
The operation view shows:
- Calls, throughput, failed calls and error rate.
- Average, P50, P95, and P99 latency.
- Throughput, latency-percentile, and error-rate charts.
- Recent, Slowest, and Failed occurrence views.
Each occurrence includes its time, duration, status, and trace ID. Select one to open its complete trace in traceX.
Finding Occurrences Progressively
Raw occurrence search is intentionally narrower than the aggregate charts:
- Search begins at the end of the selected range and covers the configured initial window, one hour by default.
- If no occurrence is found, Search 30m earlier expands the queried window by the configured increment.
- Expansion stops at the beginning of the selected range or at the administrator's raw-trace retention limit.
The page always shows the exact absolute interval queried. The same progressive window applies when switching among Recent, Slowest, and Failed occurrences.
Use View traces for last 15 minutes when you want a broader traceX search for the selected service and operation rather than one exact occurrence. Browser Back returns from operation detail to the previous service view.
Create Alerts from Service Charts
The Throughput, Latency, and Error rate chart menus can open Grafana's alert editor with the service, environment, query, reducer, and a suggested threshold already filled in. Review the draft before saving it. Availability depends on your Grafana permissions and alerting configuration.