Database Operations
Database Operations summarizes database spans by system, namespace, collection, operation, and statement. Use it to find the query or datastore operation consuming time or contributing errors.
The tab appears only when enabled for a deployment with the database rollup configured.
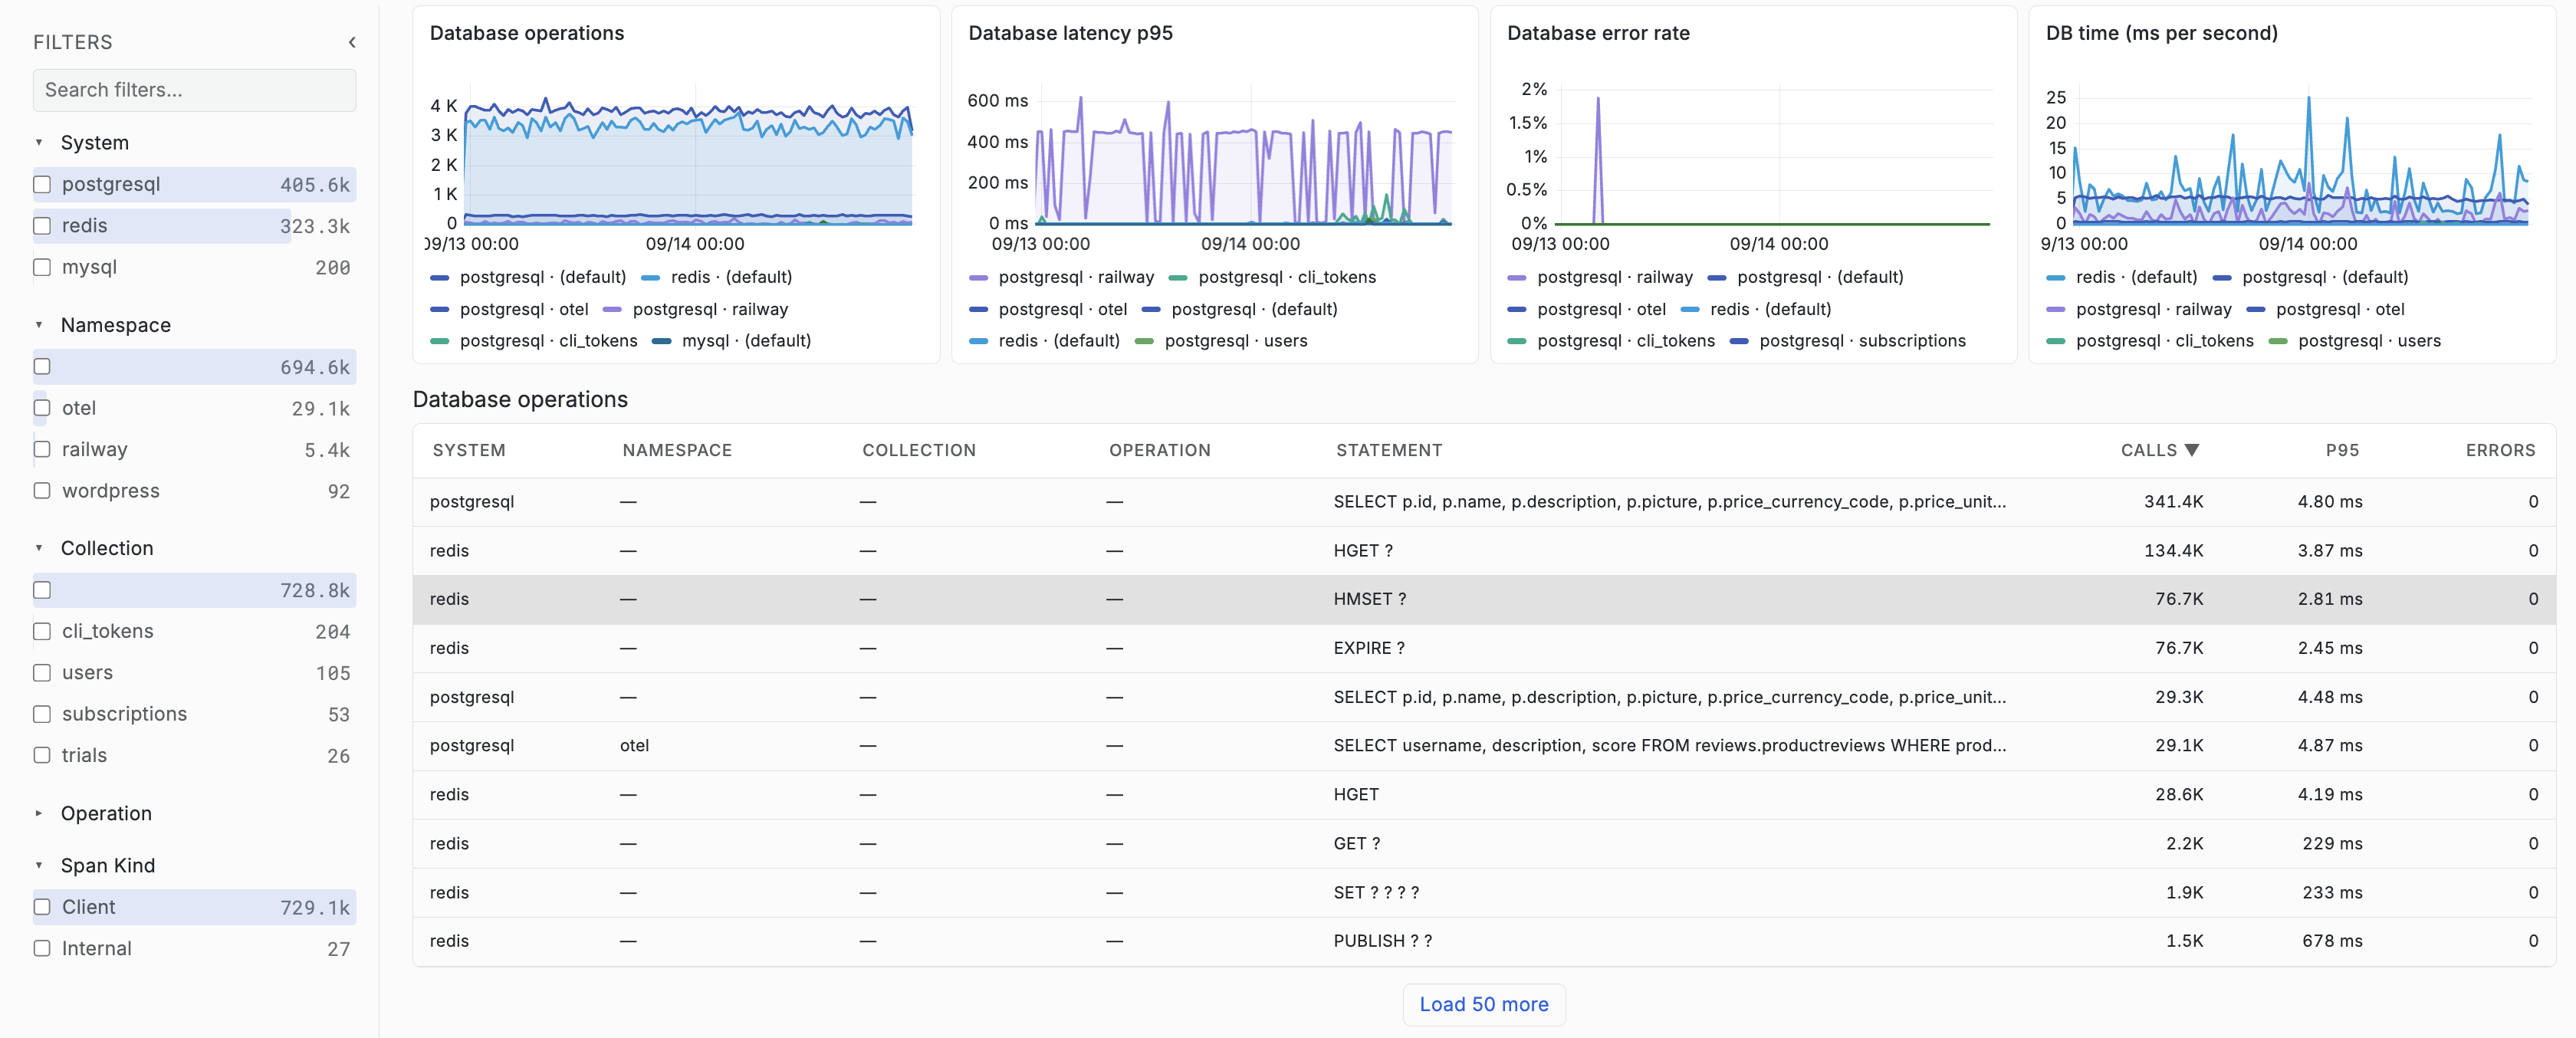
Overview Charts
Four charts follow the current environment, service, search, filter, and time scope:
| Chart | Meaning |
|---|---|
| Database operations | Call volume |
| Database latency P95 | P95 execution duration |
| Database error rate | Percentage of failed operations |
| DB time (ms per second) | Aggregate time spent in database calls per second |
Drag across a chart to narrow the whole application to that interval. Configured annotations appear on these charts.
Search and Filters
Topbar search matches database system, collection, operation, and statement. The filter sidebar provides facets for:
- System.
- Namespace.
- Collection.
- Operation.
- Raw span kind.
The service and environment selectors remain in the topbar.
Operations Table
| Column | Meaning |
|---|---|
| System | Database technology, such as PostgreSQL or Redis |
| Namespace | Database or logical namespace |
| Collection | Table, collection, or equivalent entity |
| Operation | Database operation name |
| Statement | Captured statement or span name |
| Calls | Number of executions |
| P95 | P95 execution duration |
| Errors | Failed execution count |
Click a heading to sort server-side results. Use Load more in scrolling mode or page controls in pagination mode. Select a row to open its resizable detail drawer.
Database Operation Detail
The drawer contains:
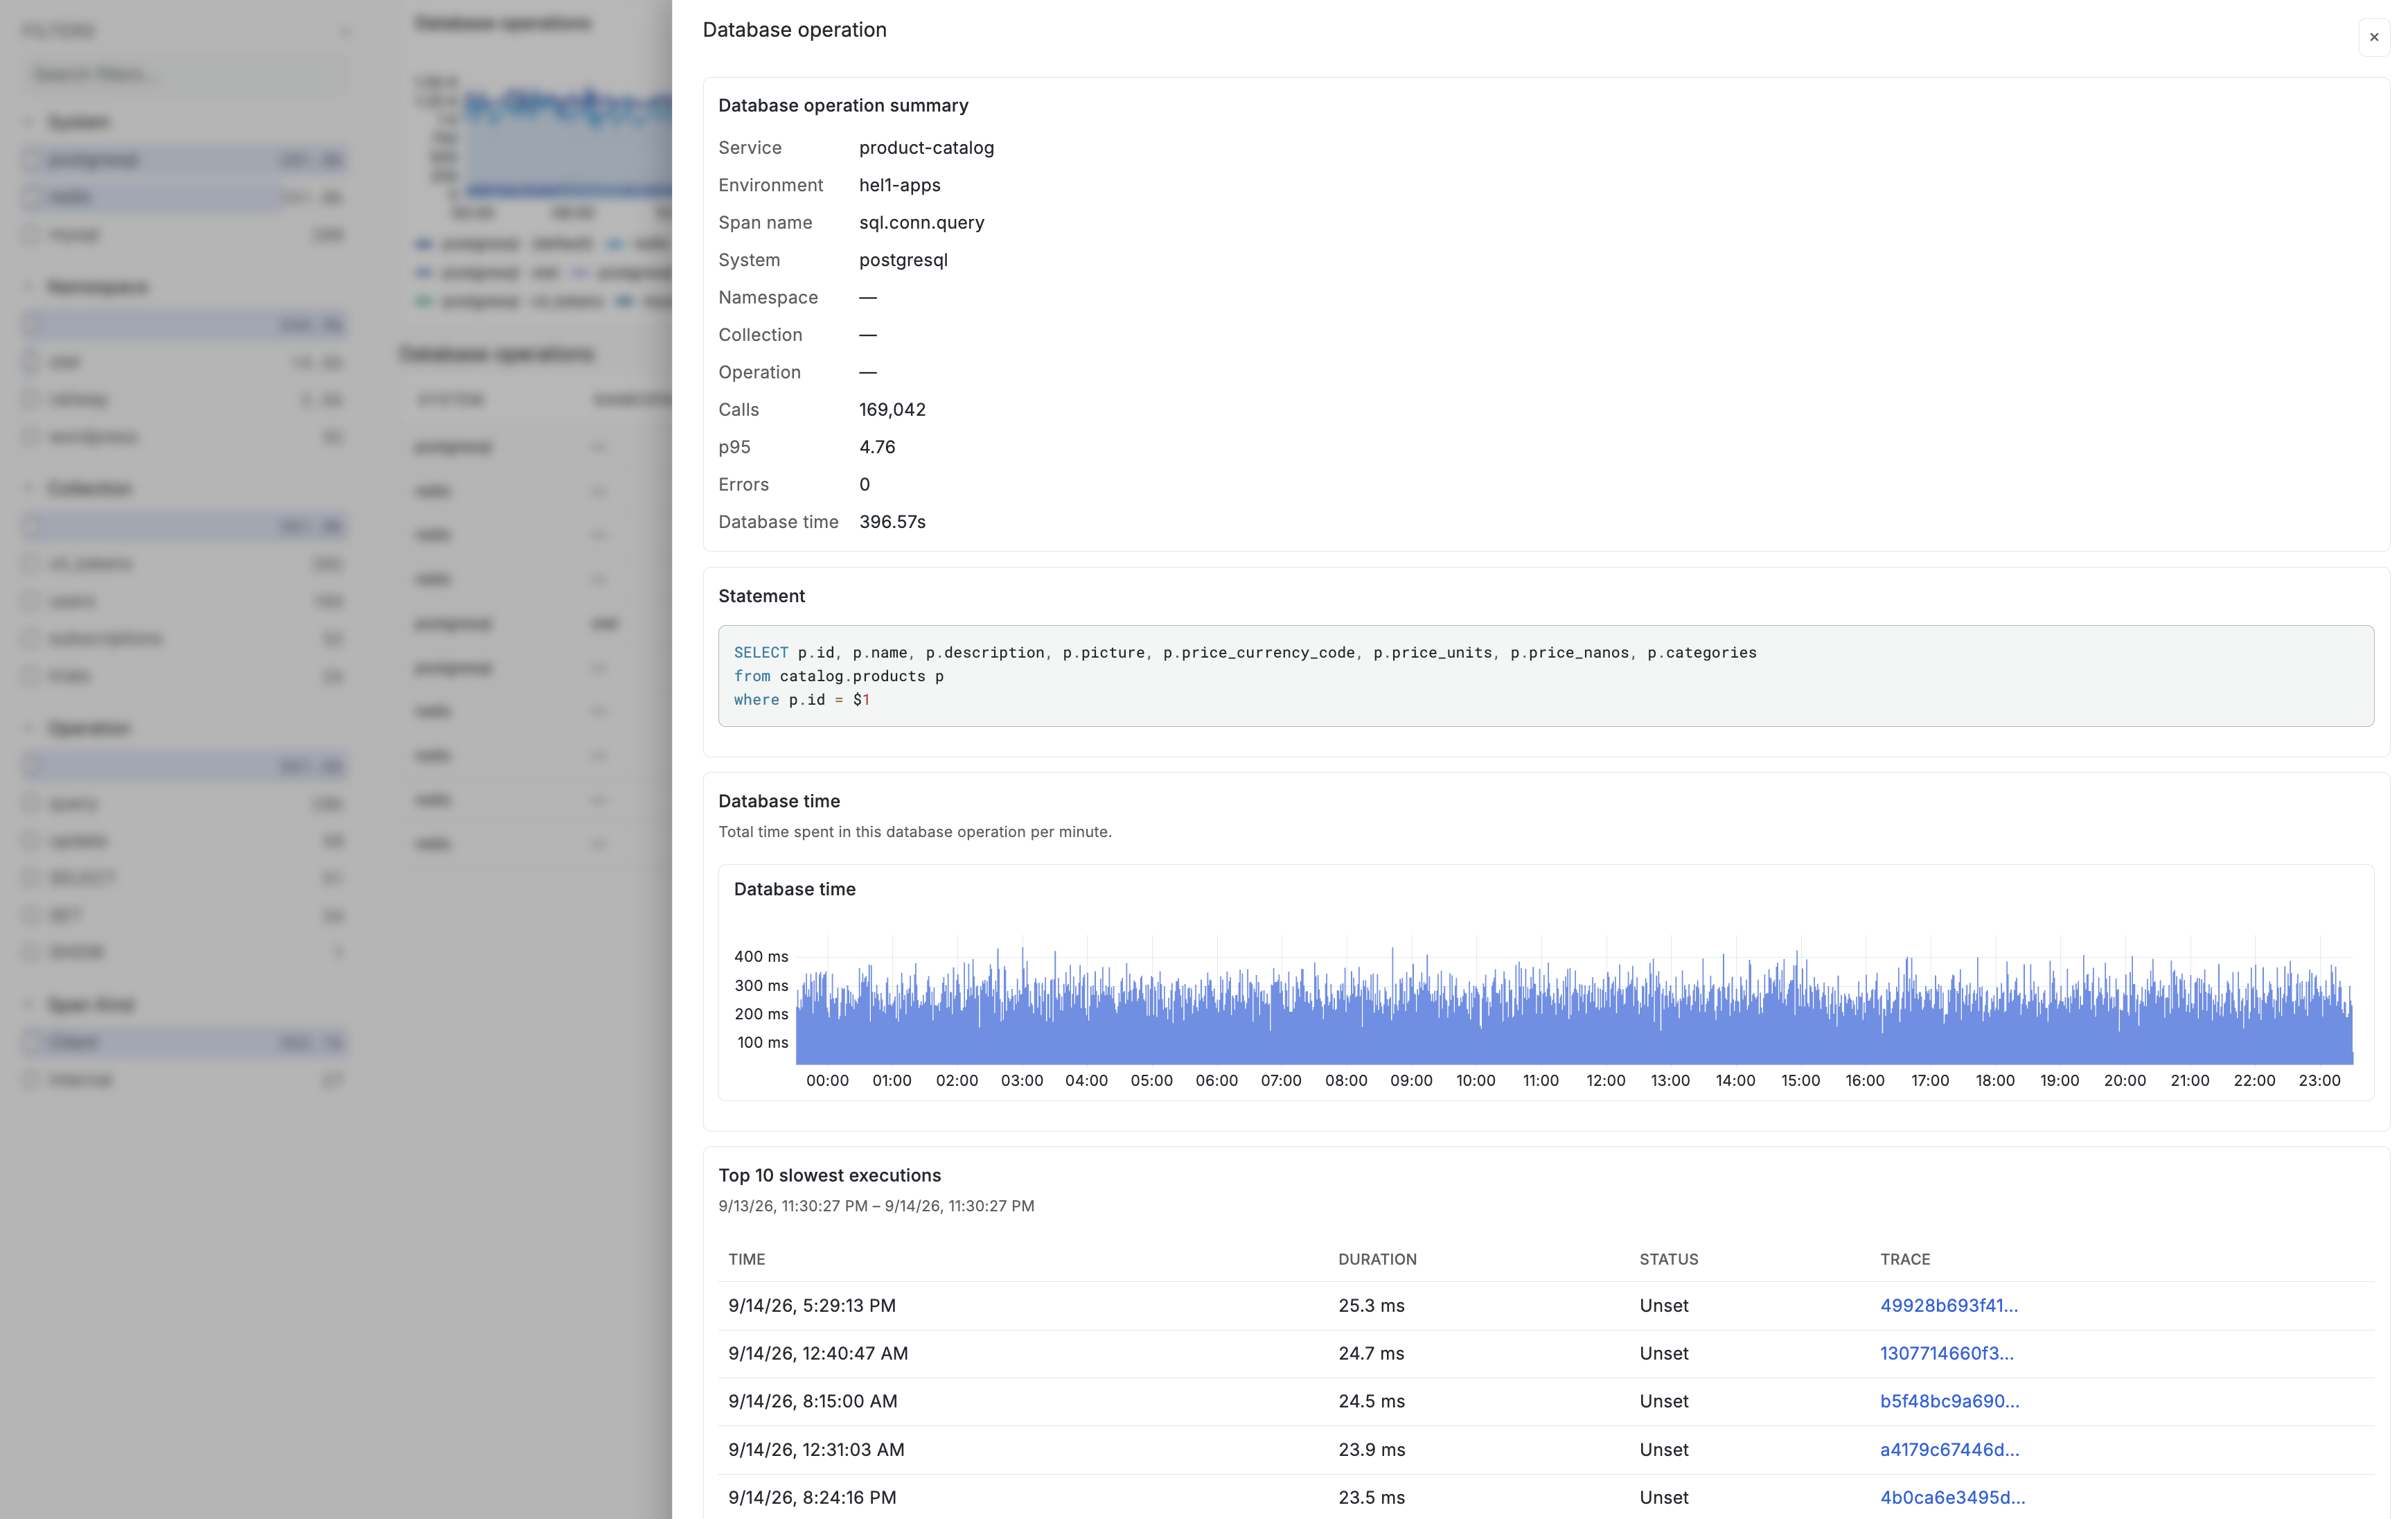
- A summary with service, environment, span name, database dimensions, calls, P95, errors, and total database time.
- A syntax-highlighted statement.
- A per-minute Database time chart.
- The Top 10 slowest executions from raw spans.
The chart remains rollup-backed. Slowest executions are loaded separately, so a raw-query failure does not remove the operation summary or chart.
Raw Execution Window
The slowest-executions section displays the exact absolute range queried. The start is moved forward when necessary so APM never reads data older than the administrator's raw trace limit. No progressive one-hour search applies here; the top ten are selected over the entire allowed portion of the chosen range.
Select an execution to open its exact trace and database span in traceX.