Messaging Queues
Messaging Queues reports RED-style metrics for instrumented messaging spans. It groups activity by the dimensions stored in the messaging rollup rather than attempting to infer producer or consumer categories.
The tab appears only when enabled for a deployment with the messaging rollup configured.
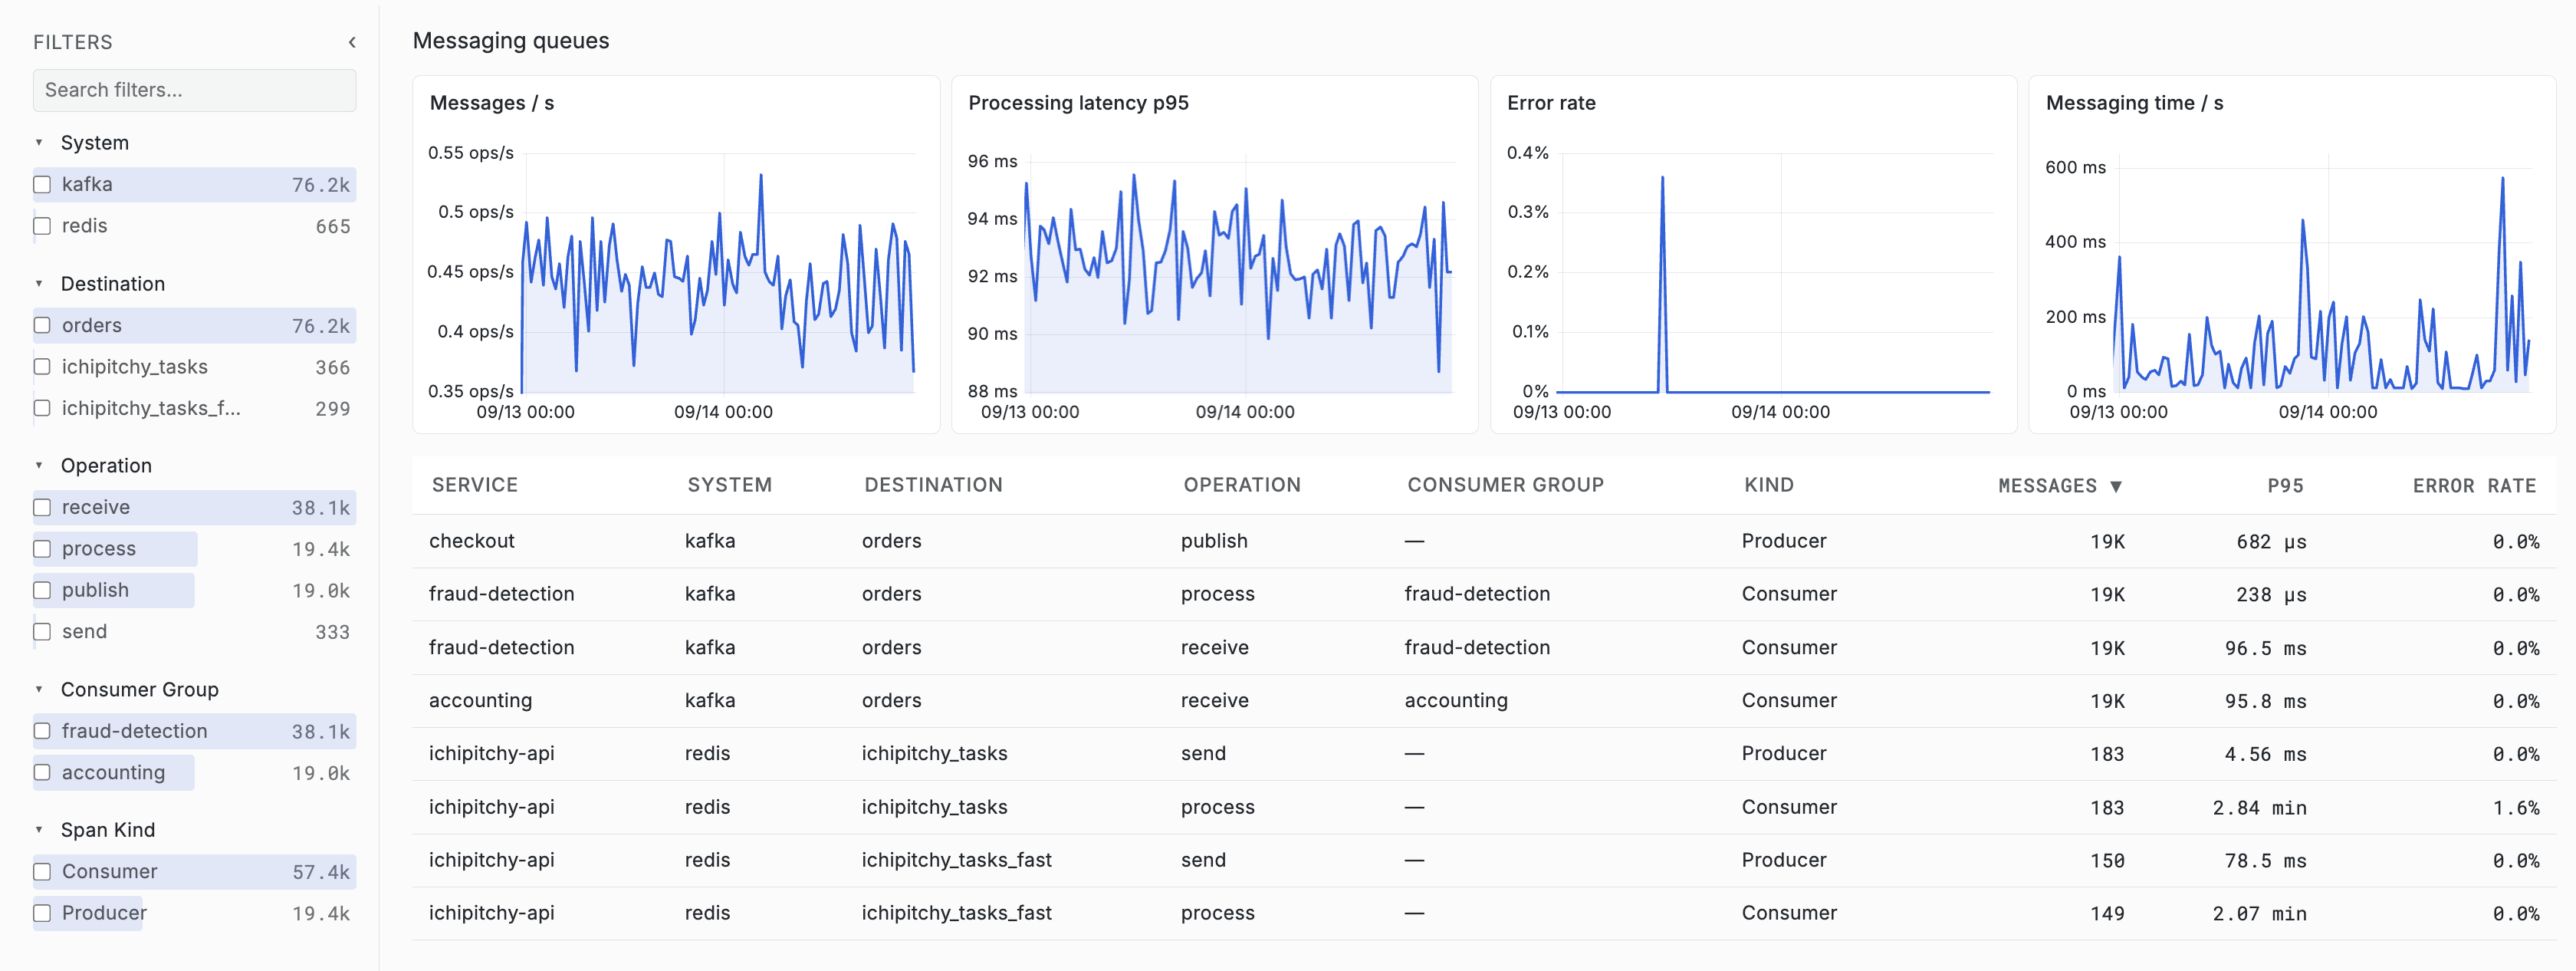
Overview Charts
Four charts follow the current environment, service, search, filter, and time scope:
| Chart | Meaning |
|---|---|
| Messages / s | Messaging span throughput |
| Processing latency P95 | P95 span duration |
| Error rate | Percentage of messaging spans with Error status |
| Messaging time / s | Aggregate messaging duration per second |
Drag across a chart to narrow the application to that interval.
Search and Filters
Topbar search matches messaging system, destination, operation, and consumer group. The filter sidebar provides facets for:
- System.
- Destination.
- Operation.
- Consumer group.
- Span kind.
Span kind is the value reported by the instrumented span. A receive
operation may therefore appear as Client, Consumer, or another value based
on its instrumentation. APM does not reclassify it from the operation name.
Messaging Table
| Column | Meaning |
|---|---|
| Service | Service that emitted the span |
| System | Messaging system, such as Kafka or Azure Service Bus |
| Destination | Queue, topic, subscription, or destination name |
| Operation | Reported messaging operation |
| Consumer group | Consumer group when provided |
| Kind | Raw OpenTelemetry span kind stored by the rollup |
| Messages | Number of matching spans |
| P95 | P95 messaging-span duration |
| Error rate | Percentage with Error status |
Click a heading to sort. Select a row to open its resizable detail drawer.
Messaging Detail
The drawer's summary and charts are scoped to the selected service, environment, system, destination, operation, consumer group, and raw span kind. It contains:
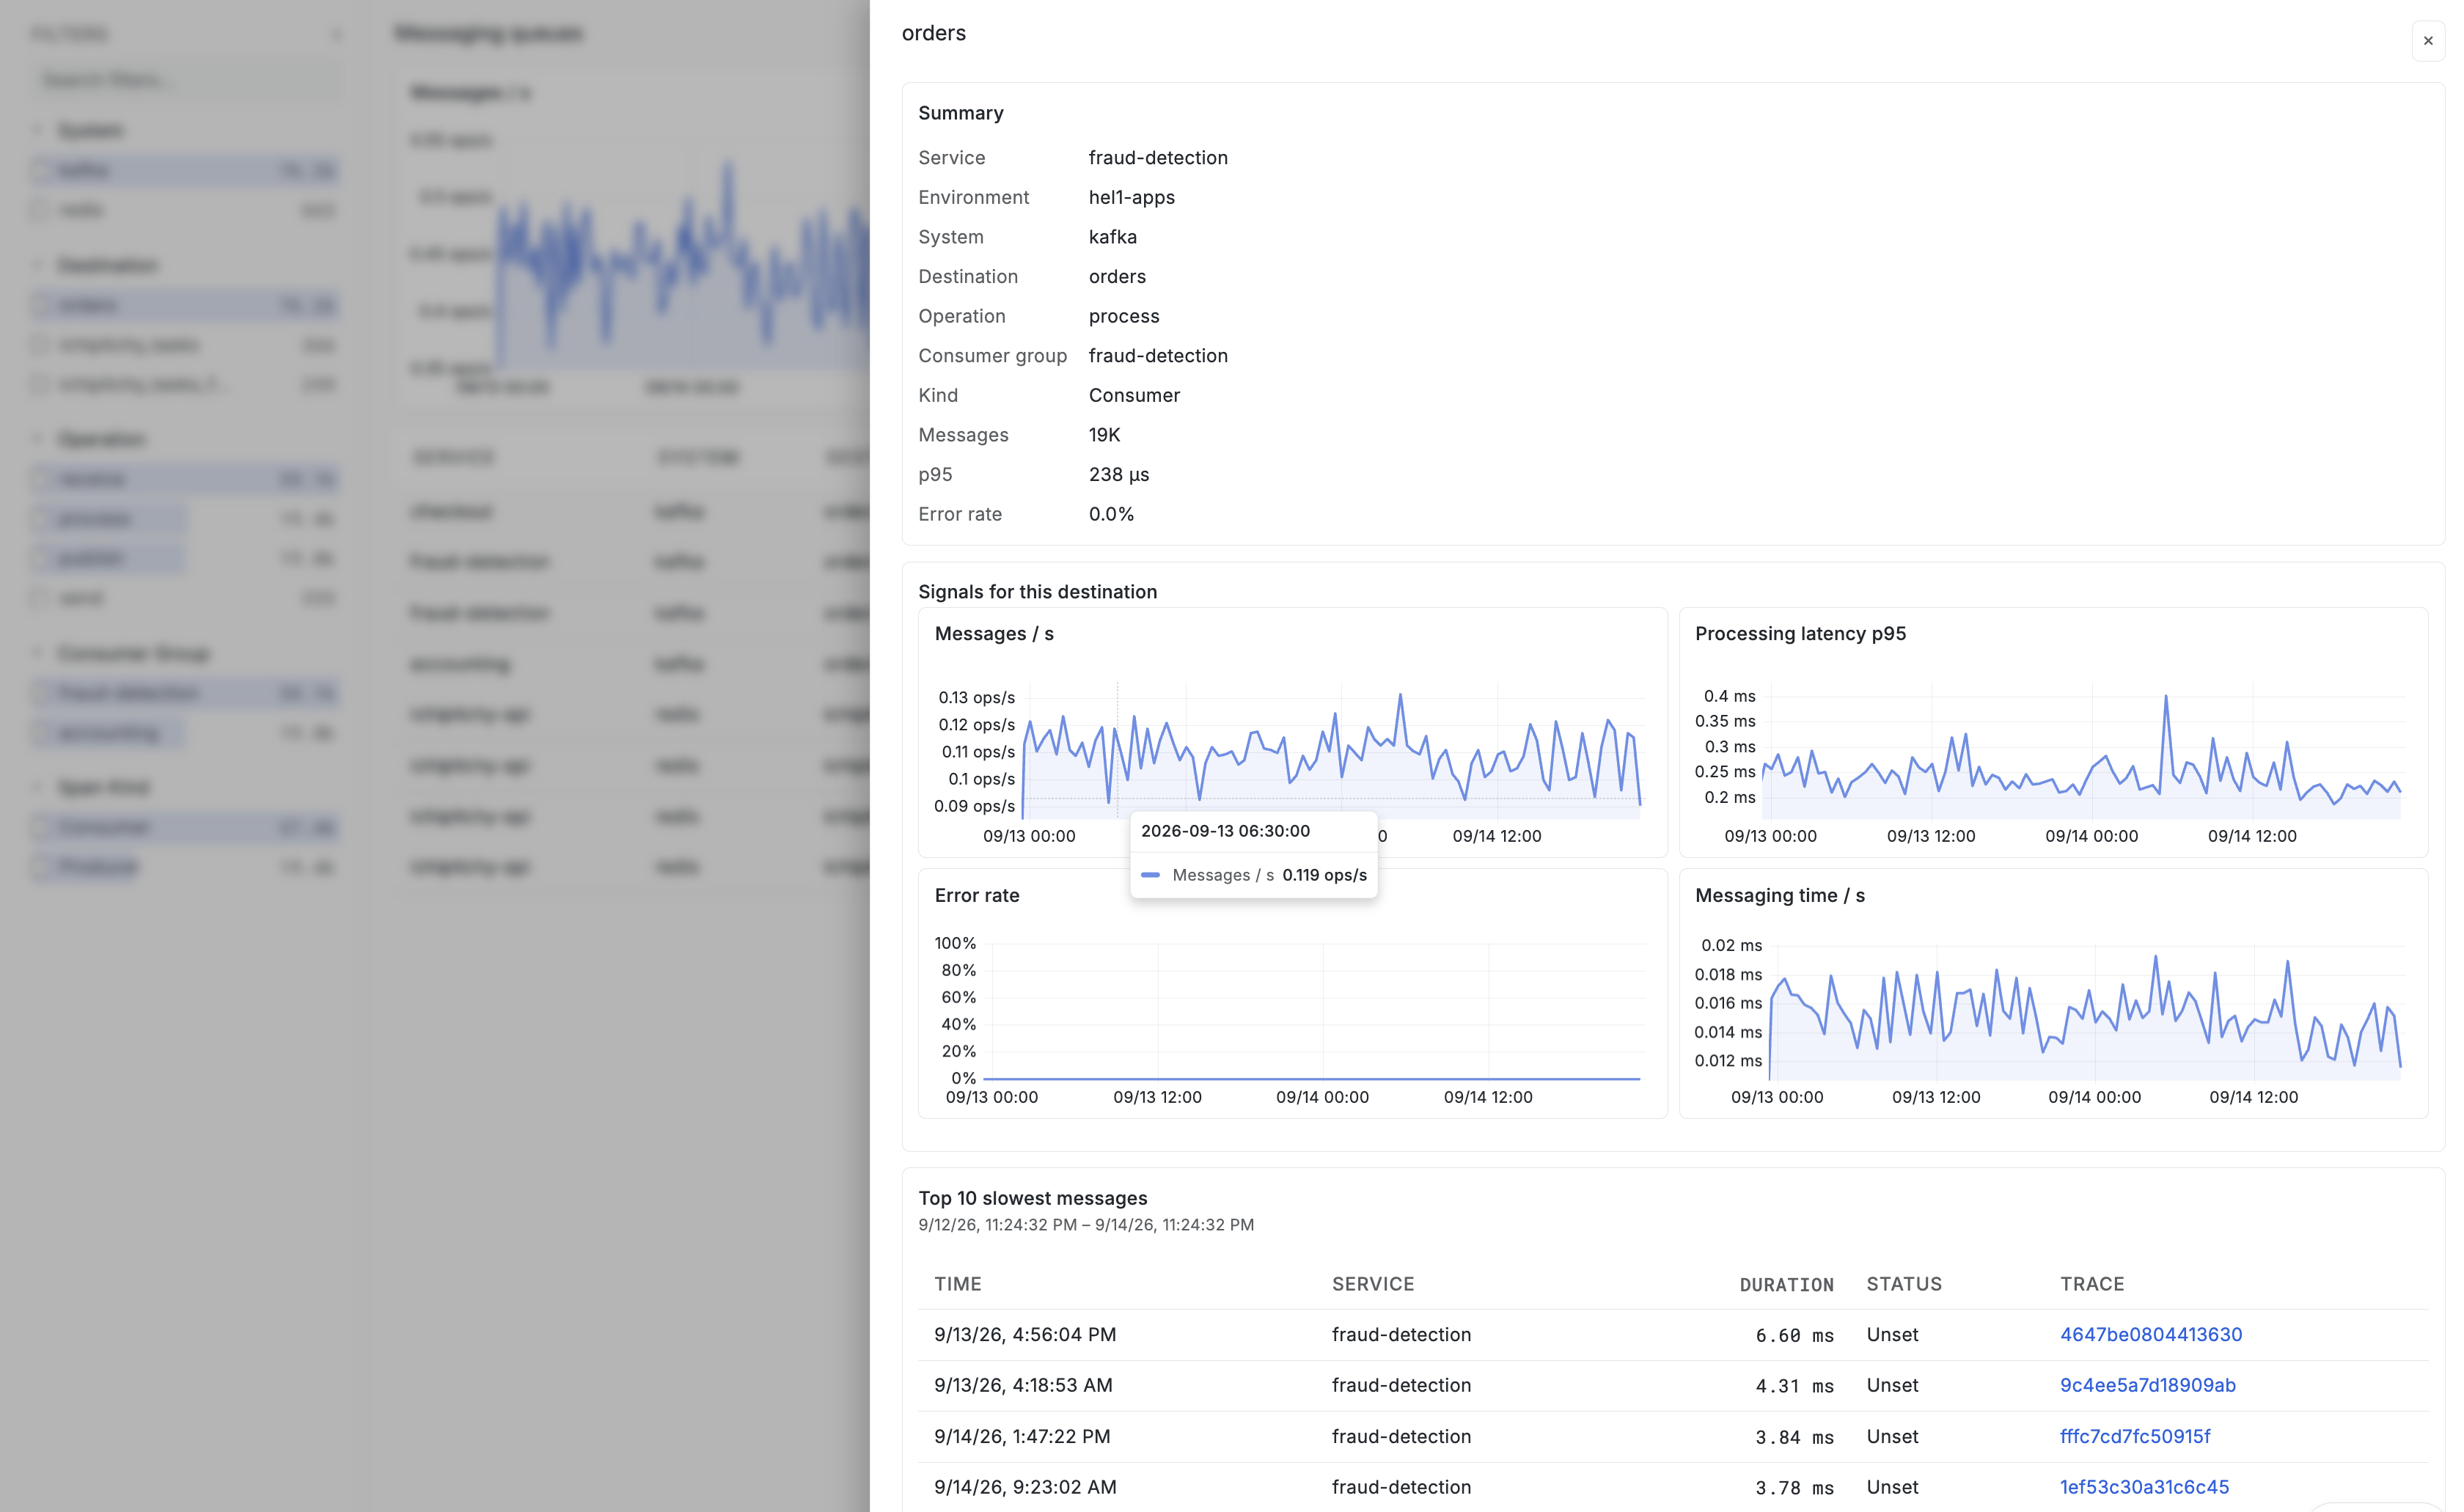
- A summary of those dimensions and their RED metrics.
- Throughput, P95 latency, error-rate, and messaging-time charts.
- The Top 10 slowest messages found in raw spans.
The detail deliberately does not present a separate producer-versus-consumer panel or derive either role from the operation name.
Raw Message Window
The slowest-messages section displays the exact absolute interval queried. If the selection extends beyond the administrator's raw trace limit, APM moves the start to that retention floor. No progressive one-hour search applies to this list; it finds the ten slowest spans over the entire allowed interval.
Raw occurrence matching uses service, environment, system, destination, operation, and span kind. If charts contain data but the raw list is empty, check that the rollup and raw span use the same values and configured attribute mapping for those dimensions. In particular, the rollup's span kind must remain the raw span kind.
Select a slow message to open its exact trace and span in traceX.