Infra
The Infra tab helps answer the question that follows an application regression: is it the code, or the machine underneath? It presents a focused live view of host or Kubernetes node resource usage next to APM workflows.
The tab appears only when enabled for a deployment with the required OpenTelemetry metrics.
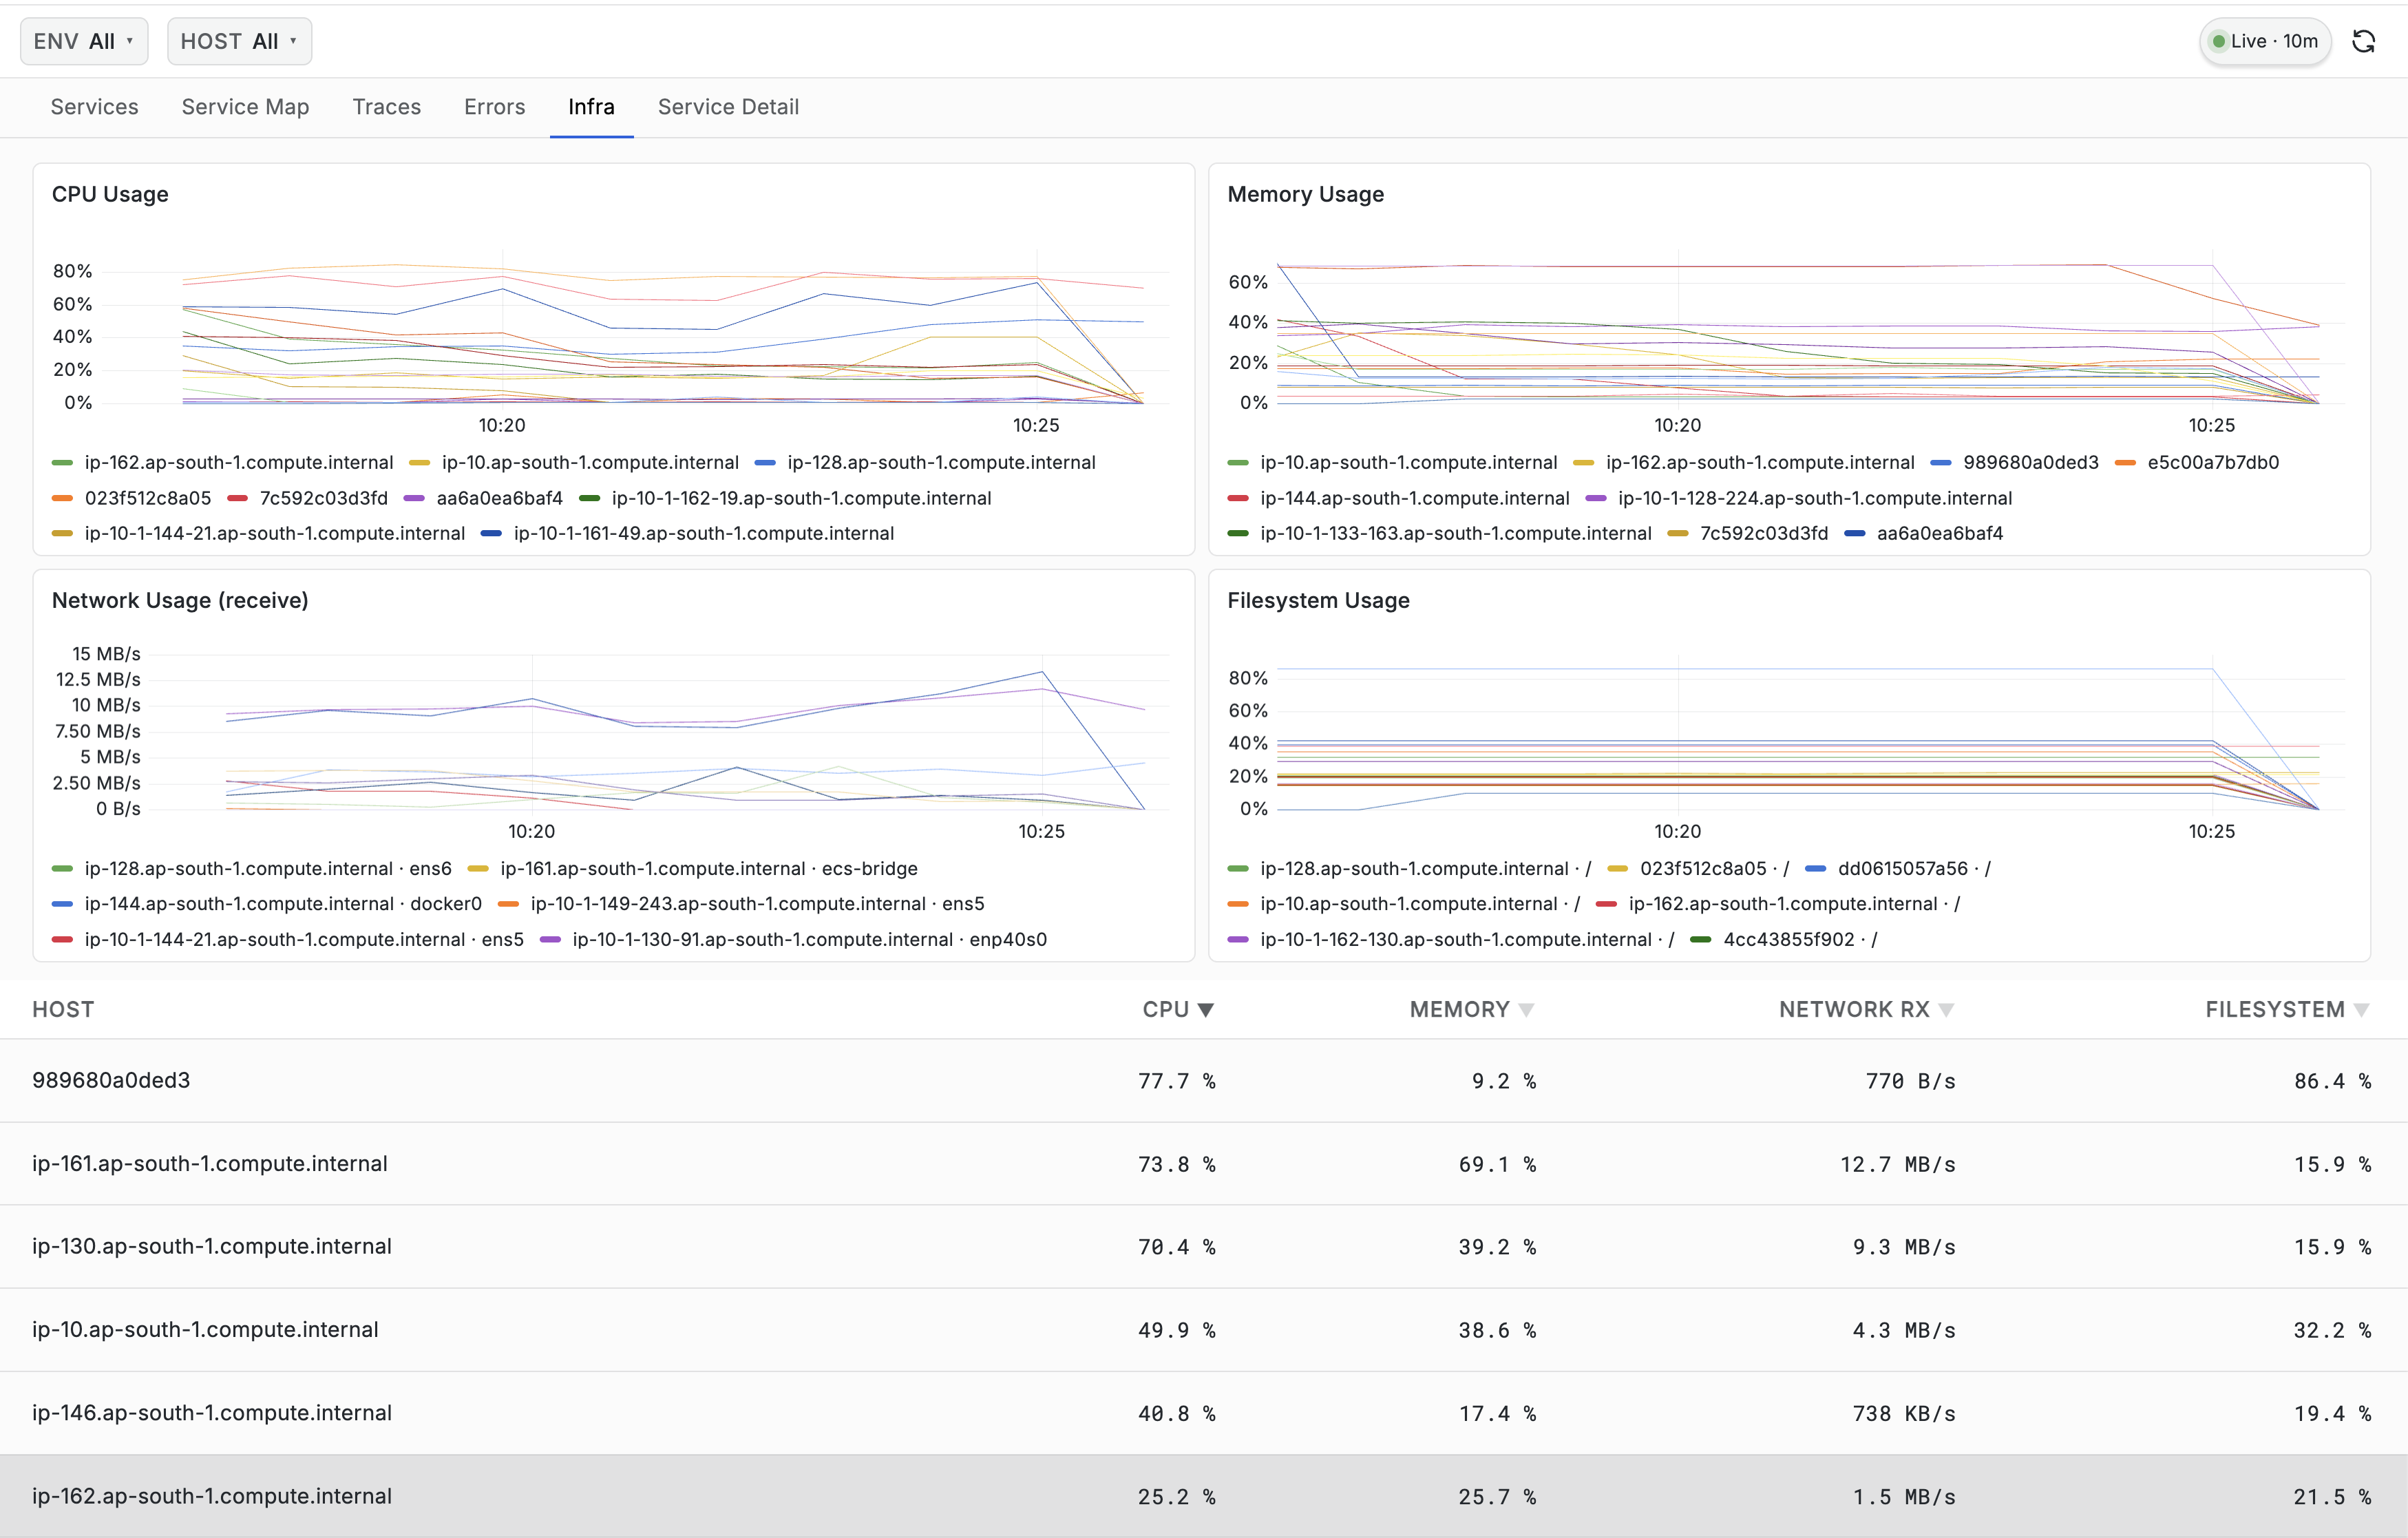
Hosts or Kubernetes Nodes
An administrator configures the page in one of two modes:
- Hosts identifies machines by host name.
- Kubernetes identifies cluster nodes by node name.
Use the instance selector in the topbar to show one or several discovered hosts or nodes. Environment and configured telemetry-service restrictions also apply.
Fixed Live Window
Infra uses a fixed recent window rather than the application's general time picker. Depending on plugin settings, the window is 5, 10, or 15 minutes. The page clearly reports when no instances have sent data during that interval.
Charts
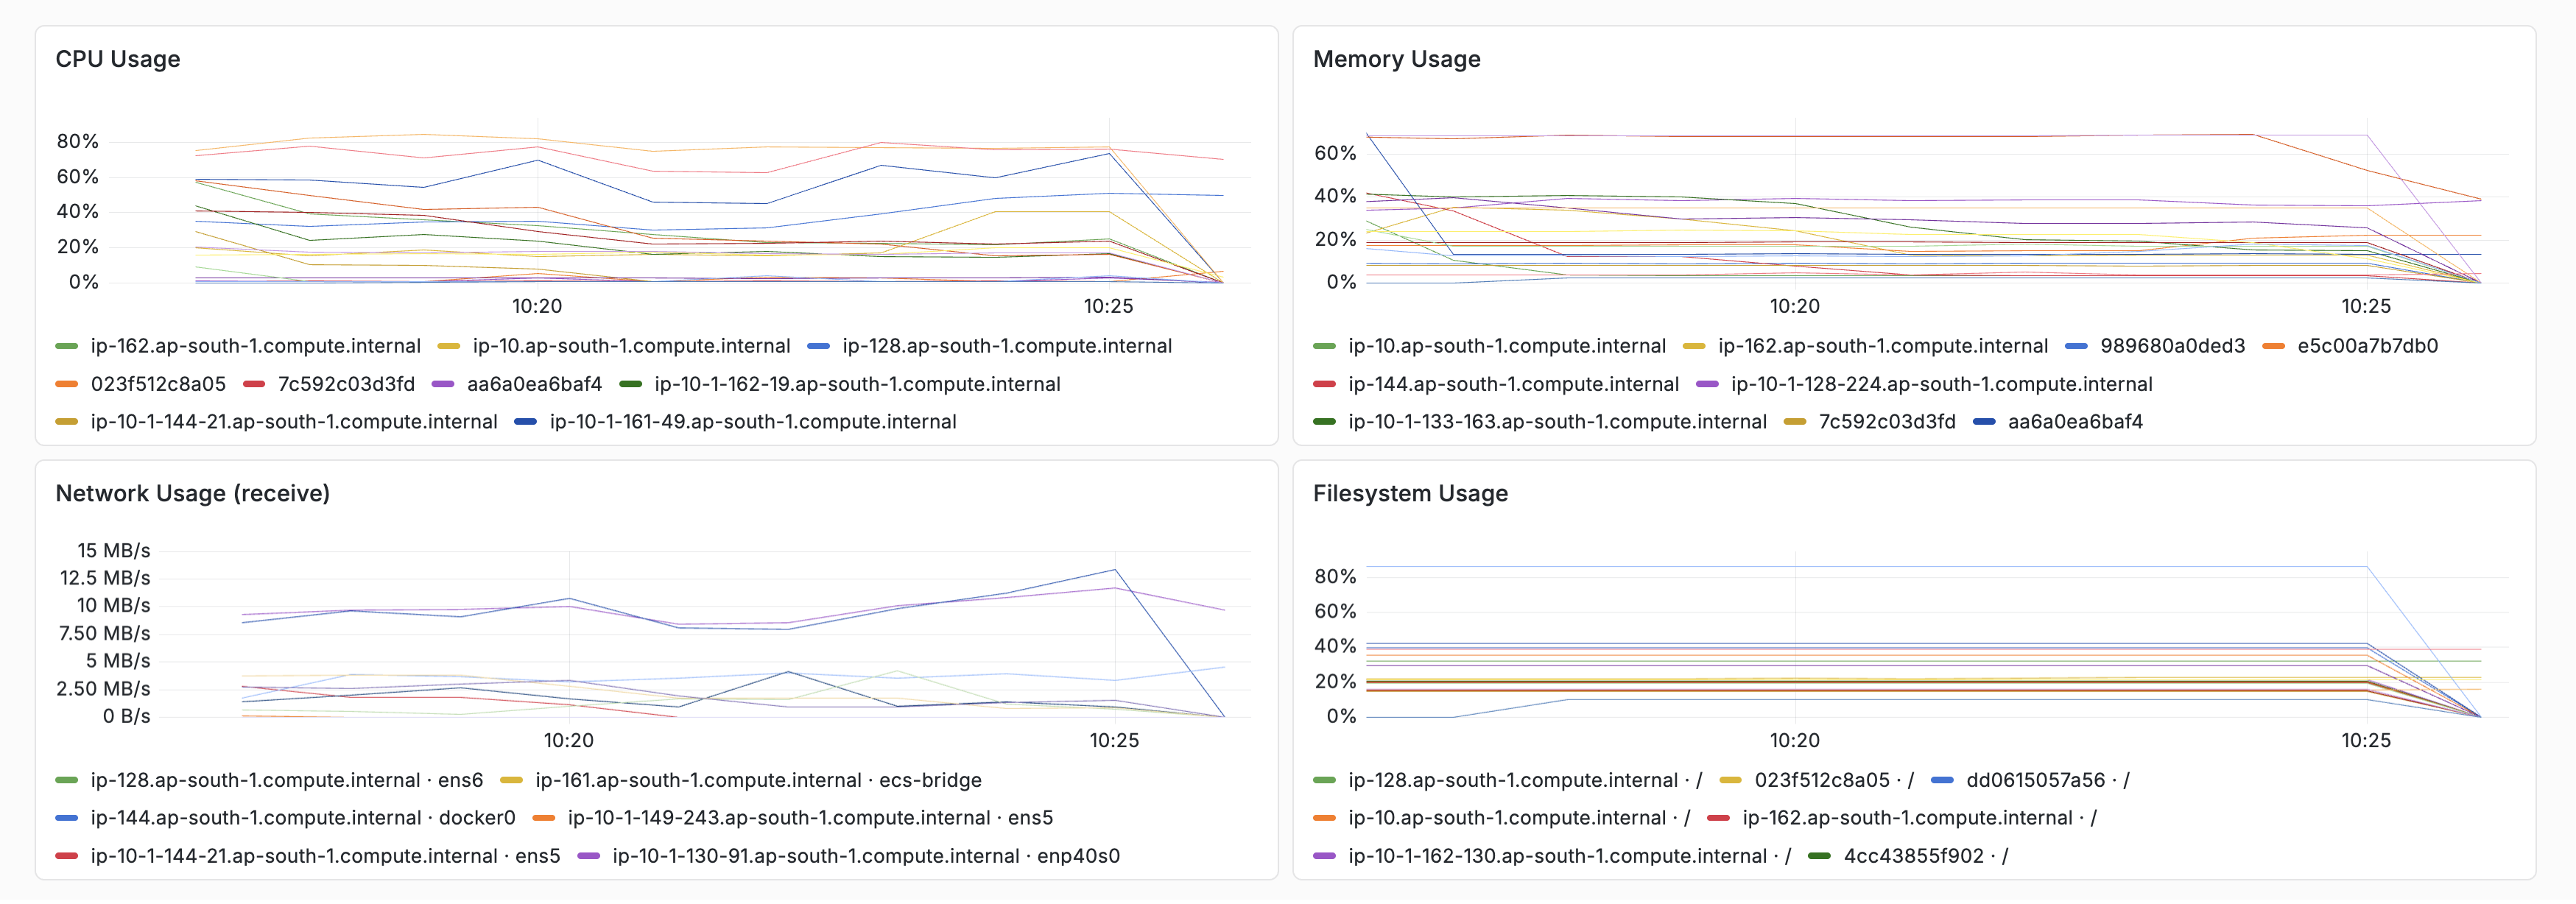
| Chart | What it shows |
|---|---|
| CPU Usage | CPU utilization percentage per host or node |
| Memory Usage | Memory utilization percentage |
| Network Usage (receive) | Receive throughput in bytes per second |
| Filesystem Usage | Filesystem utilization percentage |
Multiple instances are plotted as separate series. The charts do not share a crosshair because each resource uses a different unit or scale.
Instances Table
The table shows the latest recorded CPU, memory, network receive, and filesystem value for every visible host or node. Select any metric heading to sort; missing measurements stay below recorded values in either direction.
Create Infrastructure Alerts
Each chart menu can open a Grafana alert-rule draft for the selected host or node scope. The query, environment, data source, metric, and infra mode are pre-filled. Review the threshold before saving. Availability depends on your Grafana permissions and alerting configuration.