Errors
The Errors tab groups exceptions into issues so a recurring failure appears as one item with a count and trend rather than thousands of separate events. The tab is available when your deployment has enabled the error rollup.
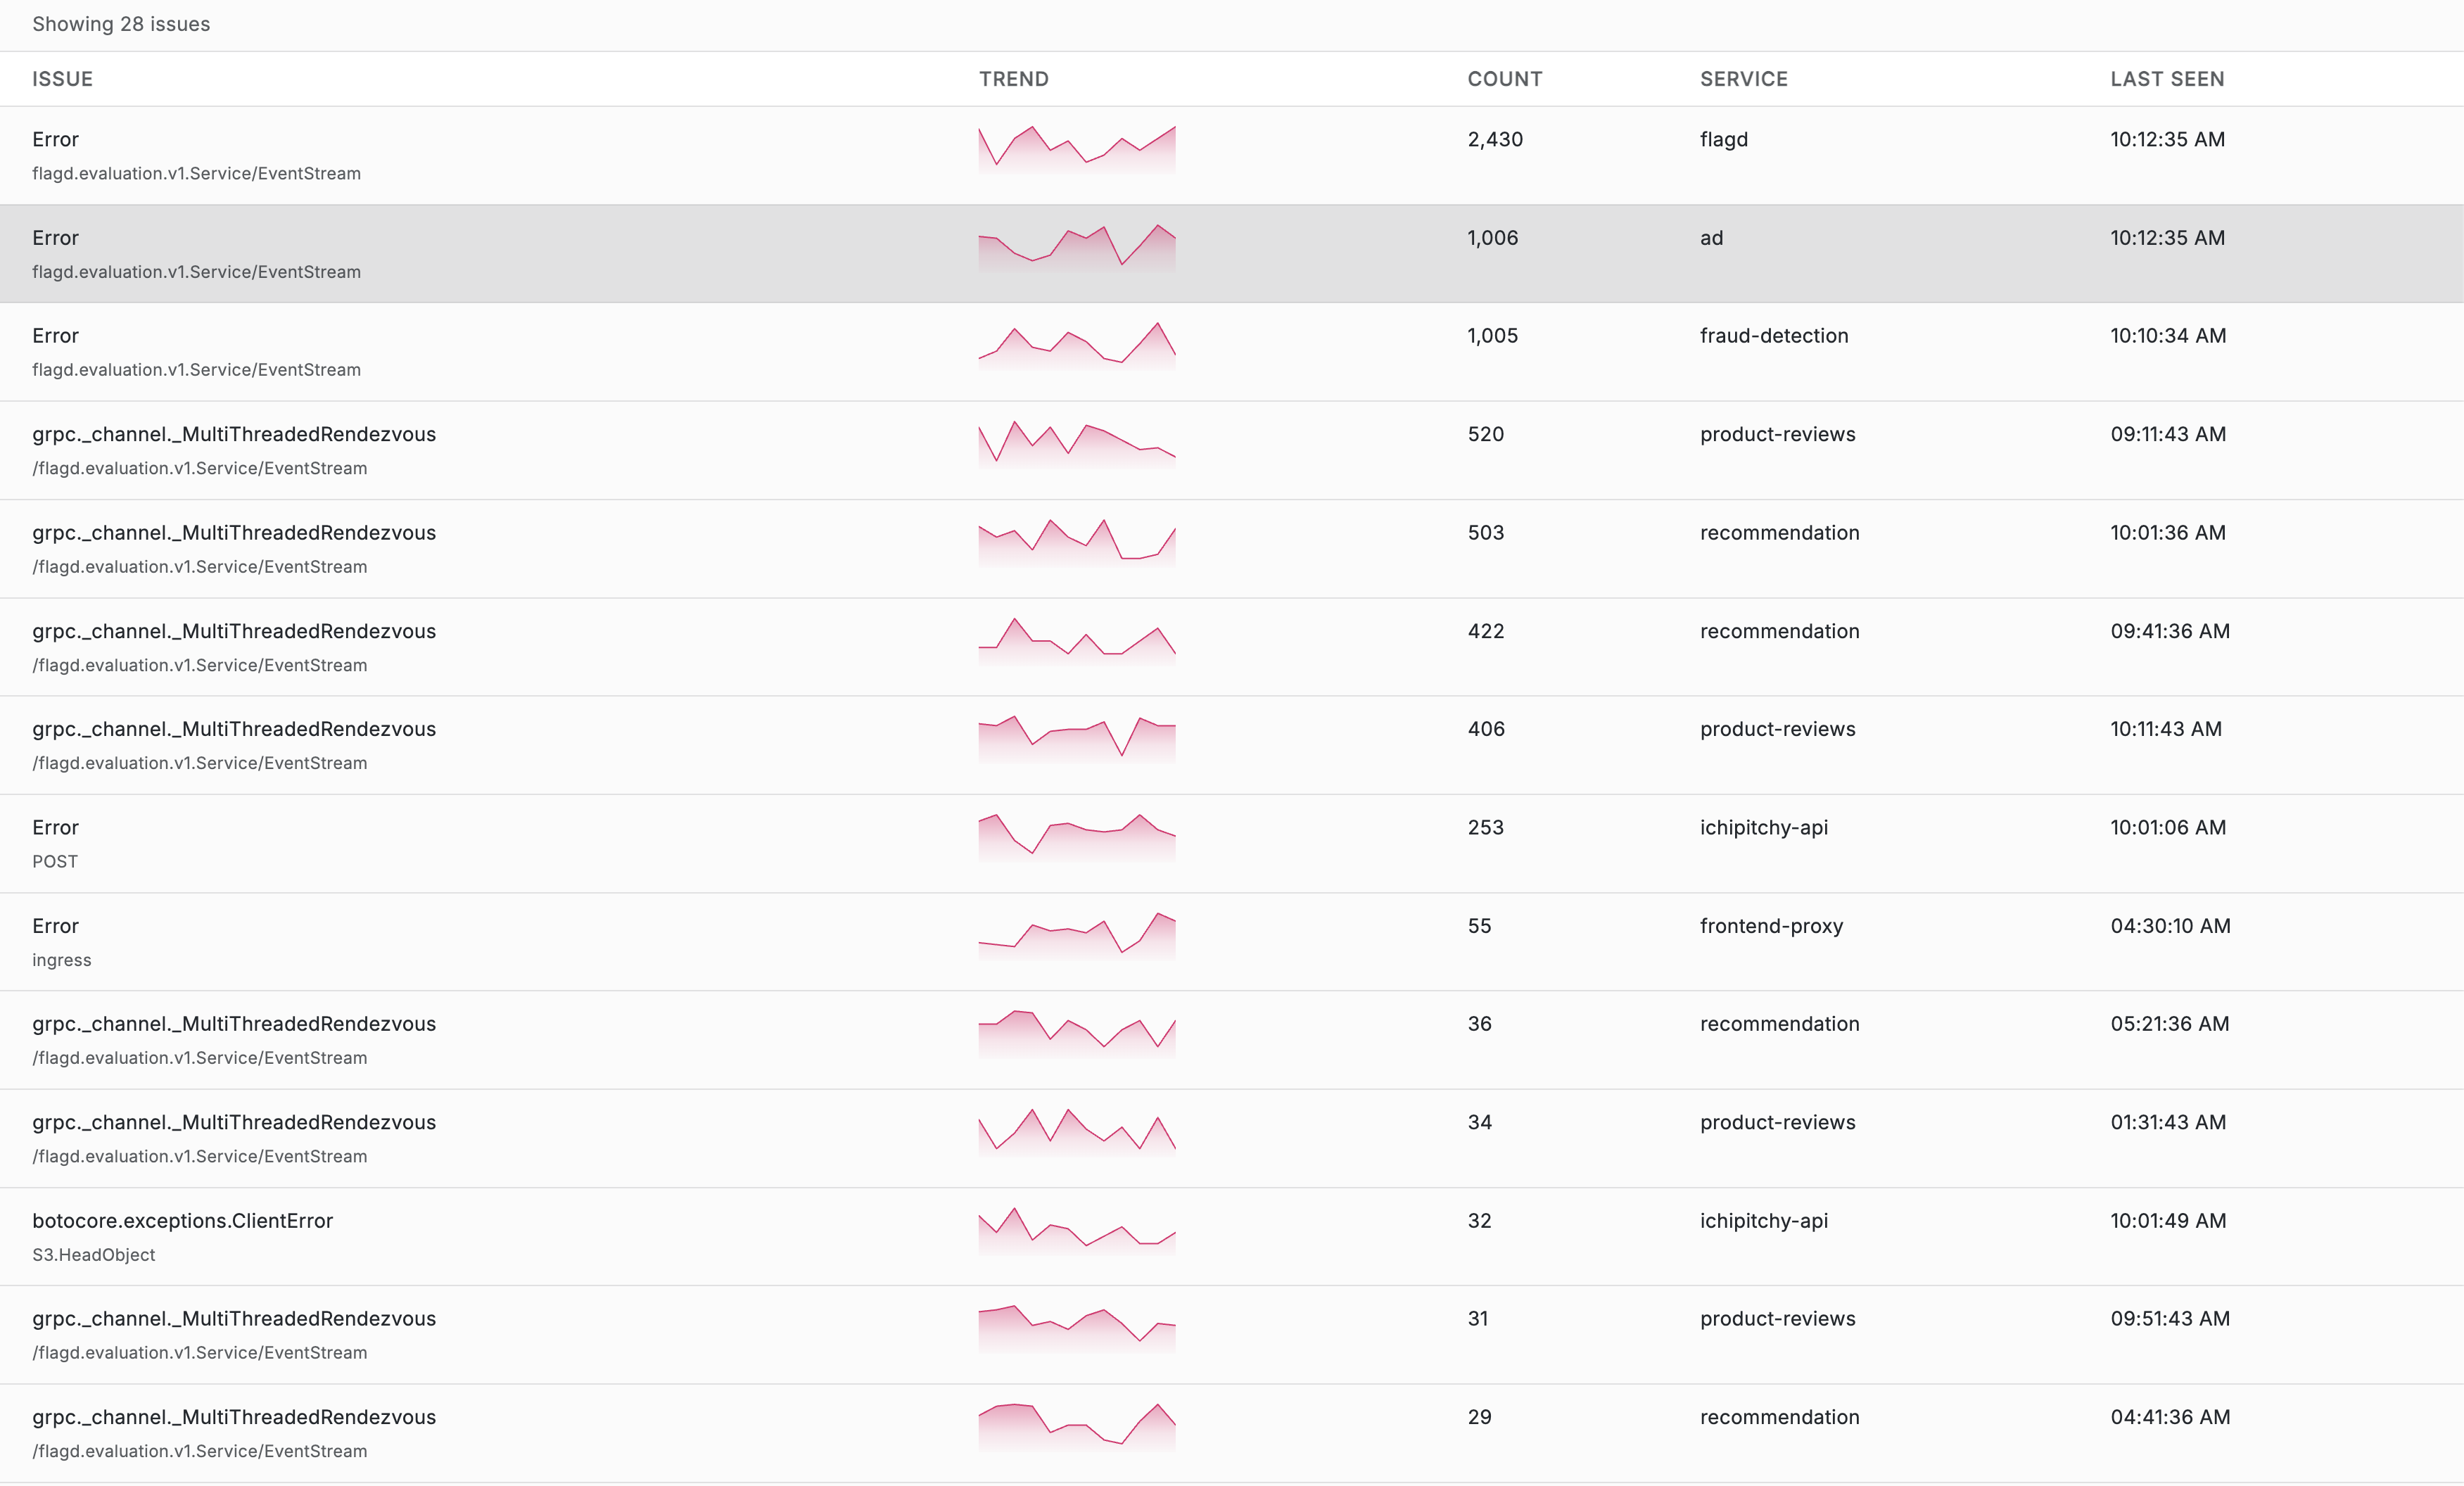
Issues List
Each issue shows:
| Column | Meaning |
|---|---|
| Issue | Exception type and representative message |
| Trend | Occurrence trend across the selected range |
| Count | Number of occurrences |
| Service | Service reporting the exception |
| Last seen | Most recent occurrence |
- Search by exception type, message, or operation.
- Click a sortable heading to change order.
- Use Load 50 more to retrieve another batch of grouped issues.
- Select an issue to open its resizable detail drawer.
Issue Detail
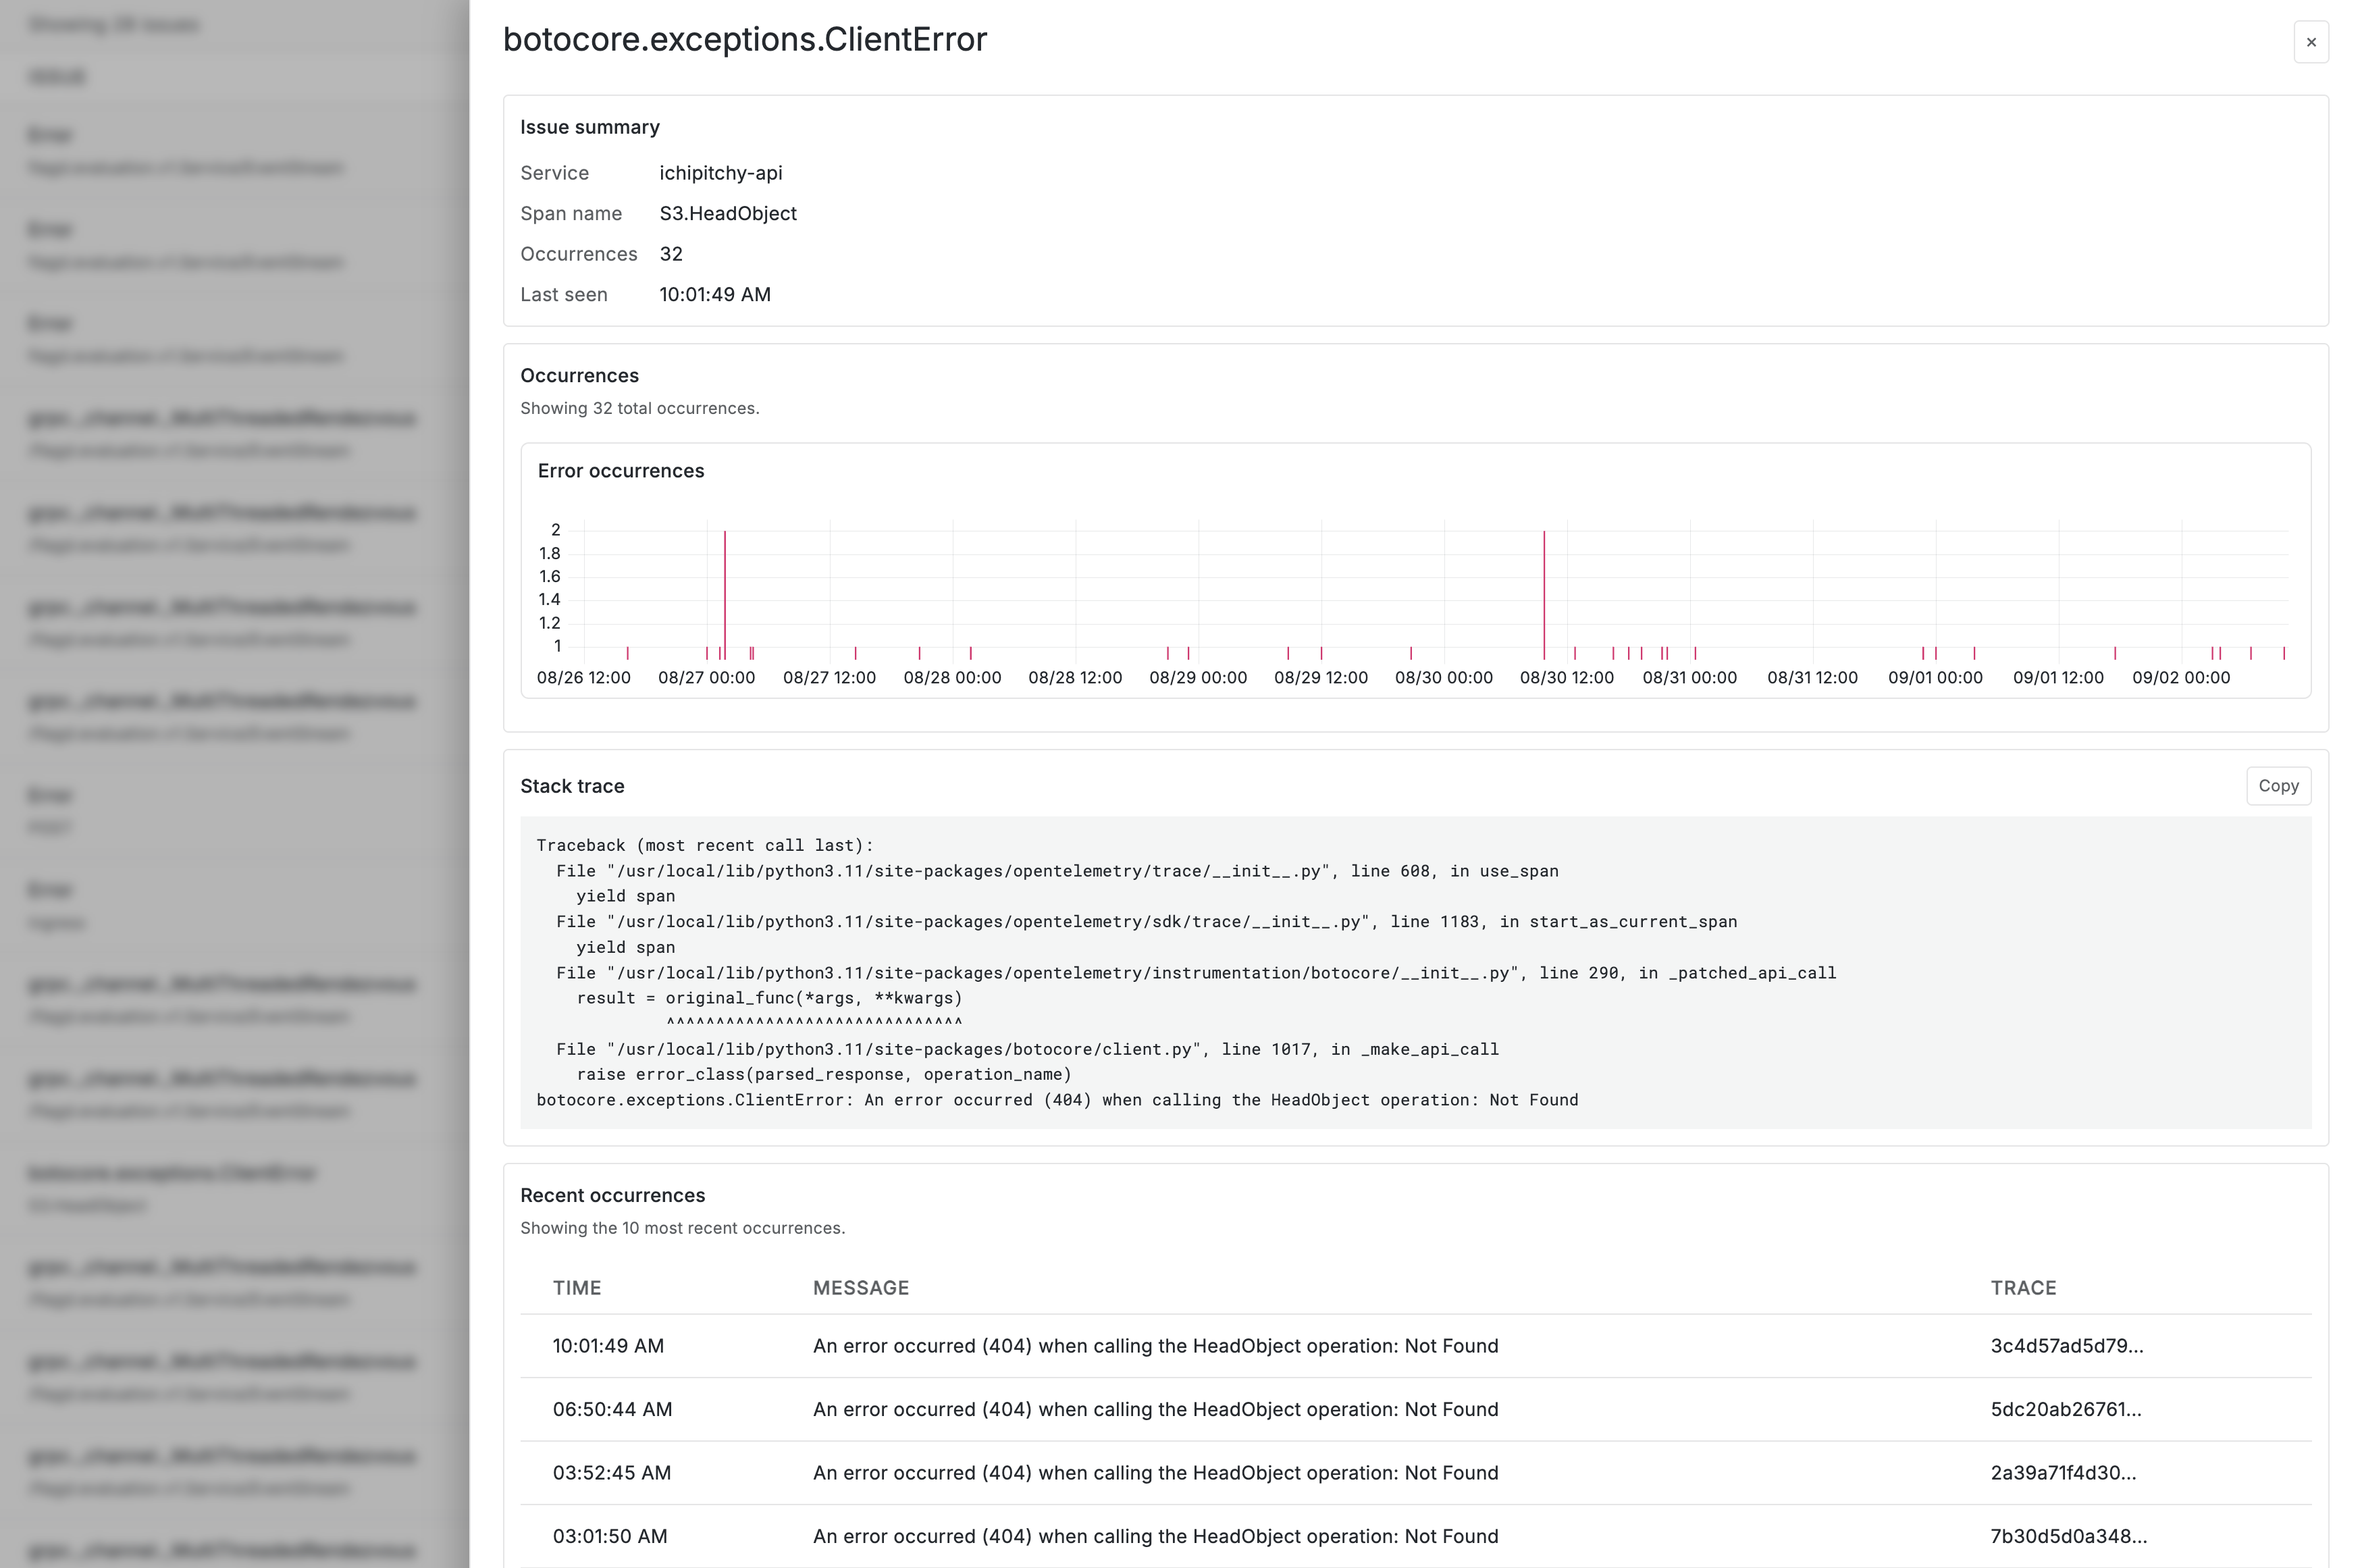
The drawer contains:
- Issue summary with service, span name, count, and last-seen time.
- An Occurrences chart across the full selected range.
- The latest available Stack trace, with a copy action.
- Recent occurrences with time, message, and trace ID.
The grouped count and chart come from the error rollup. Stack traces and recent occurrences are loaded from raw spans only after you select an issue.
Raw Occurrence Window
The Recent occurrences caption states the exact absolute interval queried. If the selected interval begins before the administrator's raw trace limit, APM moves the start to that retention floor. A completely expired historical range returns no raw events rather than reading older data.
Use Load 10 more to retrieve additional occurrences within that same allowed interval.
From Error to Trace
Select an occurrence to open traceX on its exact trace and failing span. This shows the request's other service calls, database work, events, and timing around the failure.
Create an Error Alert
When the issue is backed by the error rollup, the Occurrences chart menu can open a Grafana alert-rule draft scoped by the issue's numeric error key. The error message is not placed in the alert URL or labels. Review the query and threshold before saving; the action requires Grafana alerting permissions.