Service Map
The Service Map draws services as nodes and calls as directed edges. It helps identify dependencies, failure propagation, and high-latency connections without requiring you to know the topology in advance.
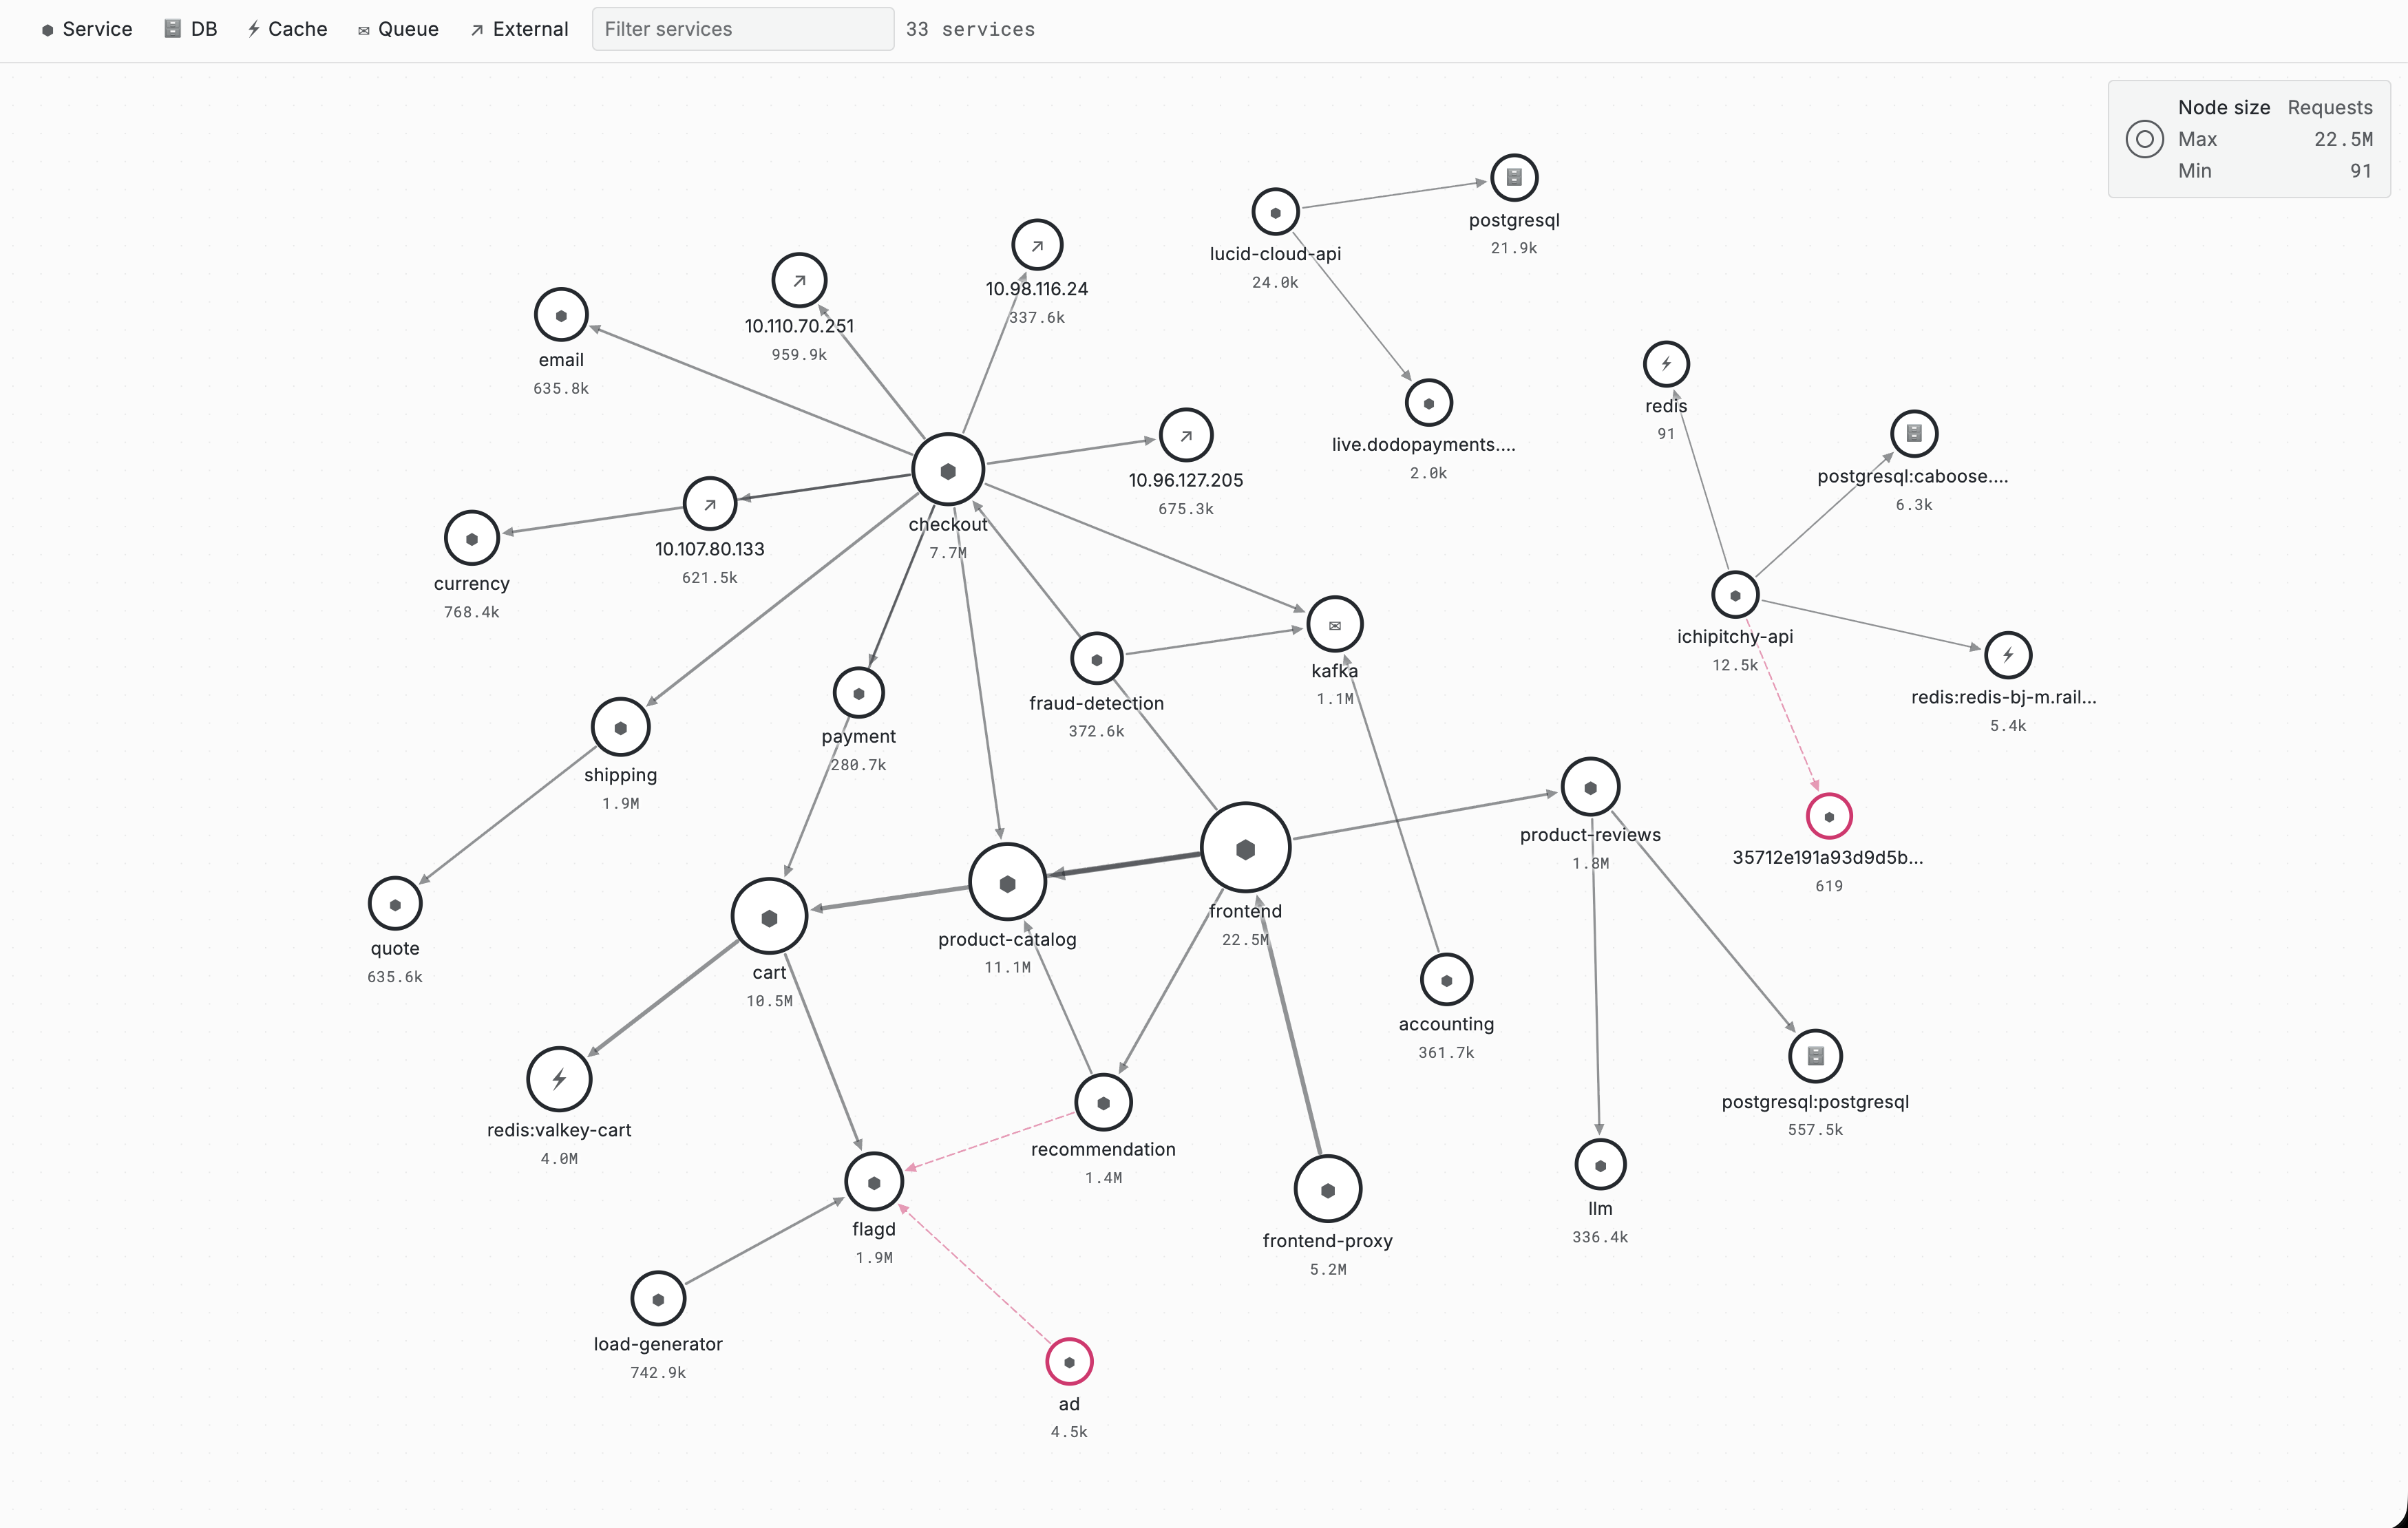
Explore the Map
- Node size and health styling summarize traffic and errors.
- Directed edges represent observed calls between services.
- Service-kind chips show or hide categories of nodes.
- Filter services searches the map by service name.
- Selecting a service isolates its immediate neighborhood; clear isolation to return to the full map.
- The map follows the selected environment, service, and time range.
Inspect a Service
Select a node to open its side panel.
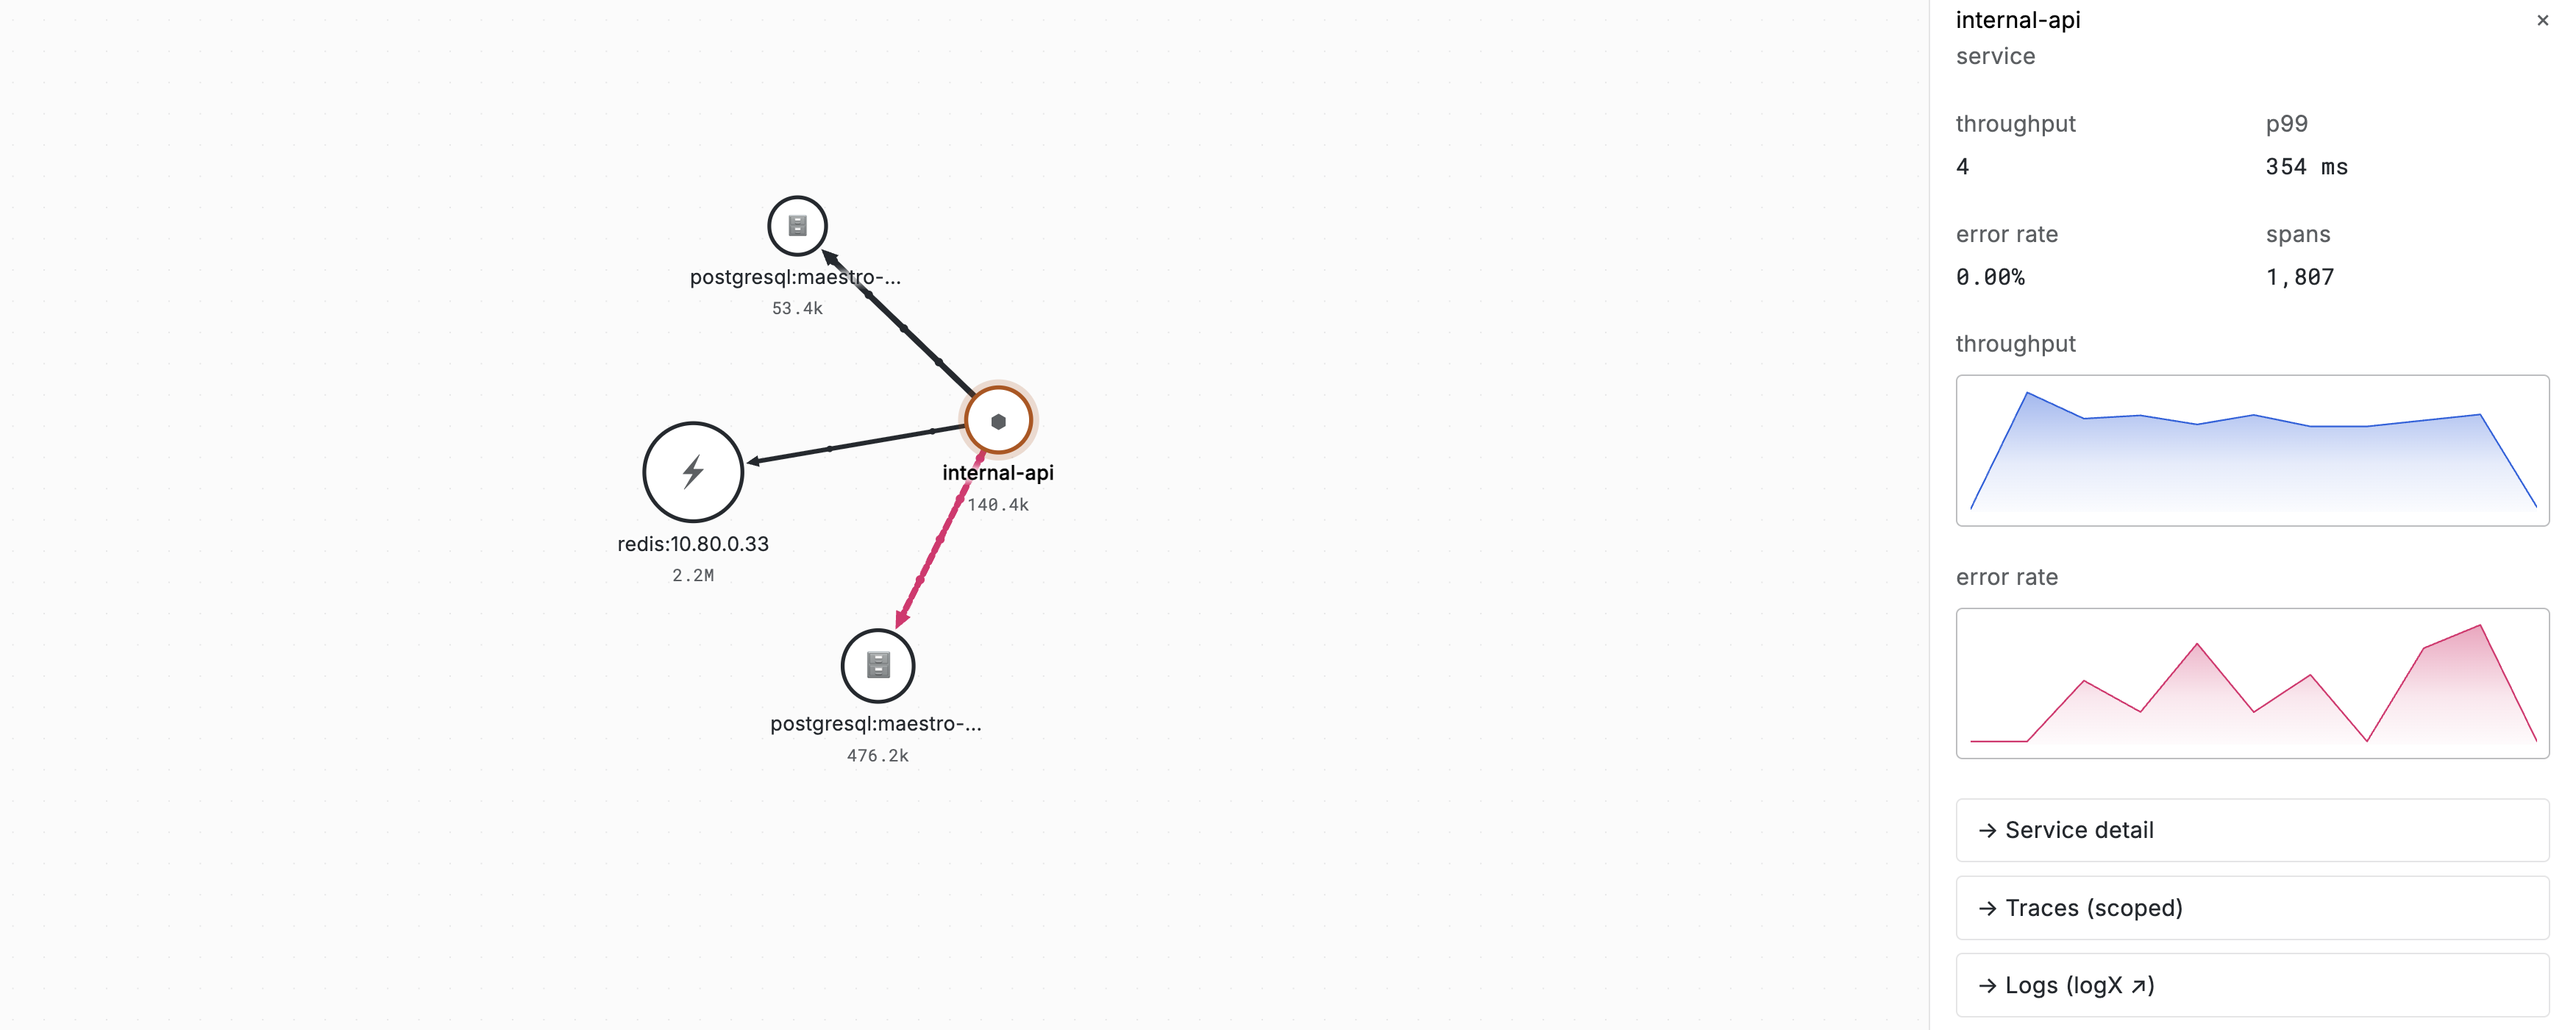
The panel shows:
- Throughput, P99 latency, error rate, and span count.
- Throughput and error-rate trends.
- A link to Service Detail.
- A scoped link to Traces.
- A link to the service's logs in logX when logX is available.
Inspect a Connection
Select an edge to inspect the relationship between its caller and callee. The connection panel includes:
- Call volume.
- Average, minimum, and maximum latency.
- Error rate and last-seen time.
- The operation identifying the connection.
- Links to either service's detail and to traces from the caller.
Connection statistics come from observed trace relationships, so a missing edge generally means no matching relationship was recorded in the current scope.
Typical Workflow
- An alert identifies a user-facing service with rising failures.
- Open Service Map and isolate that service.
- Inspect unhealthy incoming and outgoing connections.
- Open the suspected dependency's Service Detail, traces, or logs.
- Use browser Back to return to the previous map context.
Was this page helpful?