APM
APM is the application performance monitoring app built into base14 Scout. It turns OpenTelemetry traces and metrics into service health views, dependency maps, grouped errors, database and messaging analysis, and links to individual traces.
Most charts and lists read pre-aggregated data from the Scout Telemetry Data Lake. APM reads raw spans only after you select a specific operation, error, database call, or message. This keeps broad investigations fast while retaining trace-level drill-down when you need it.
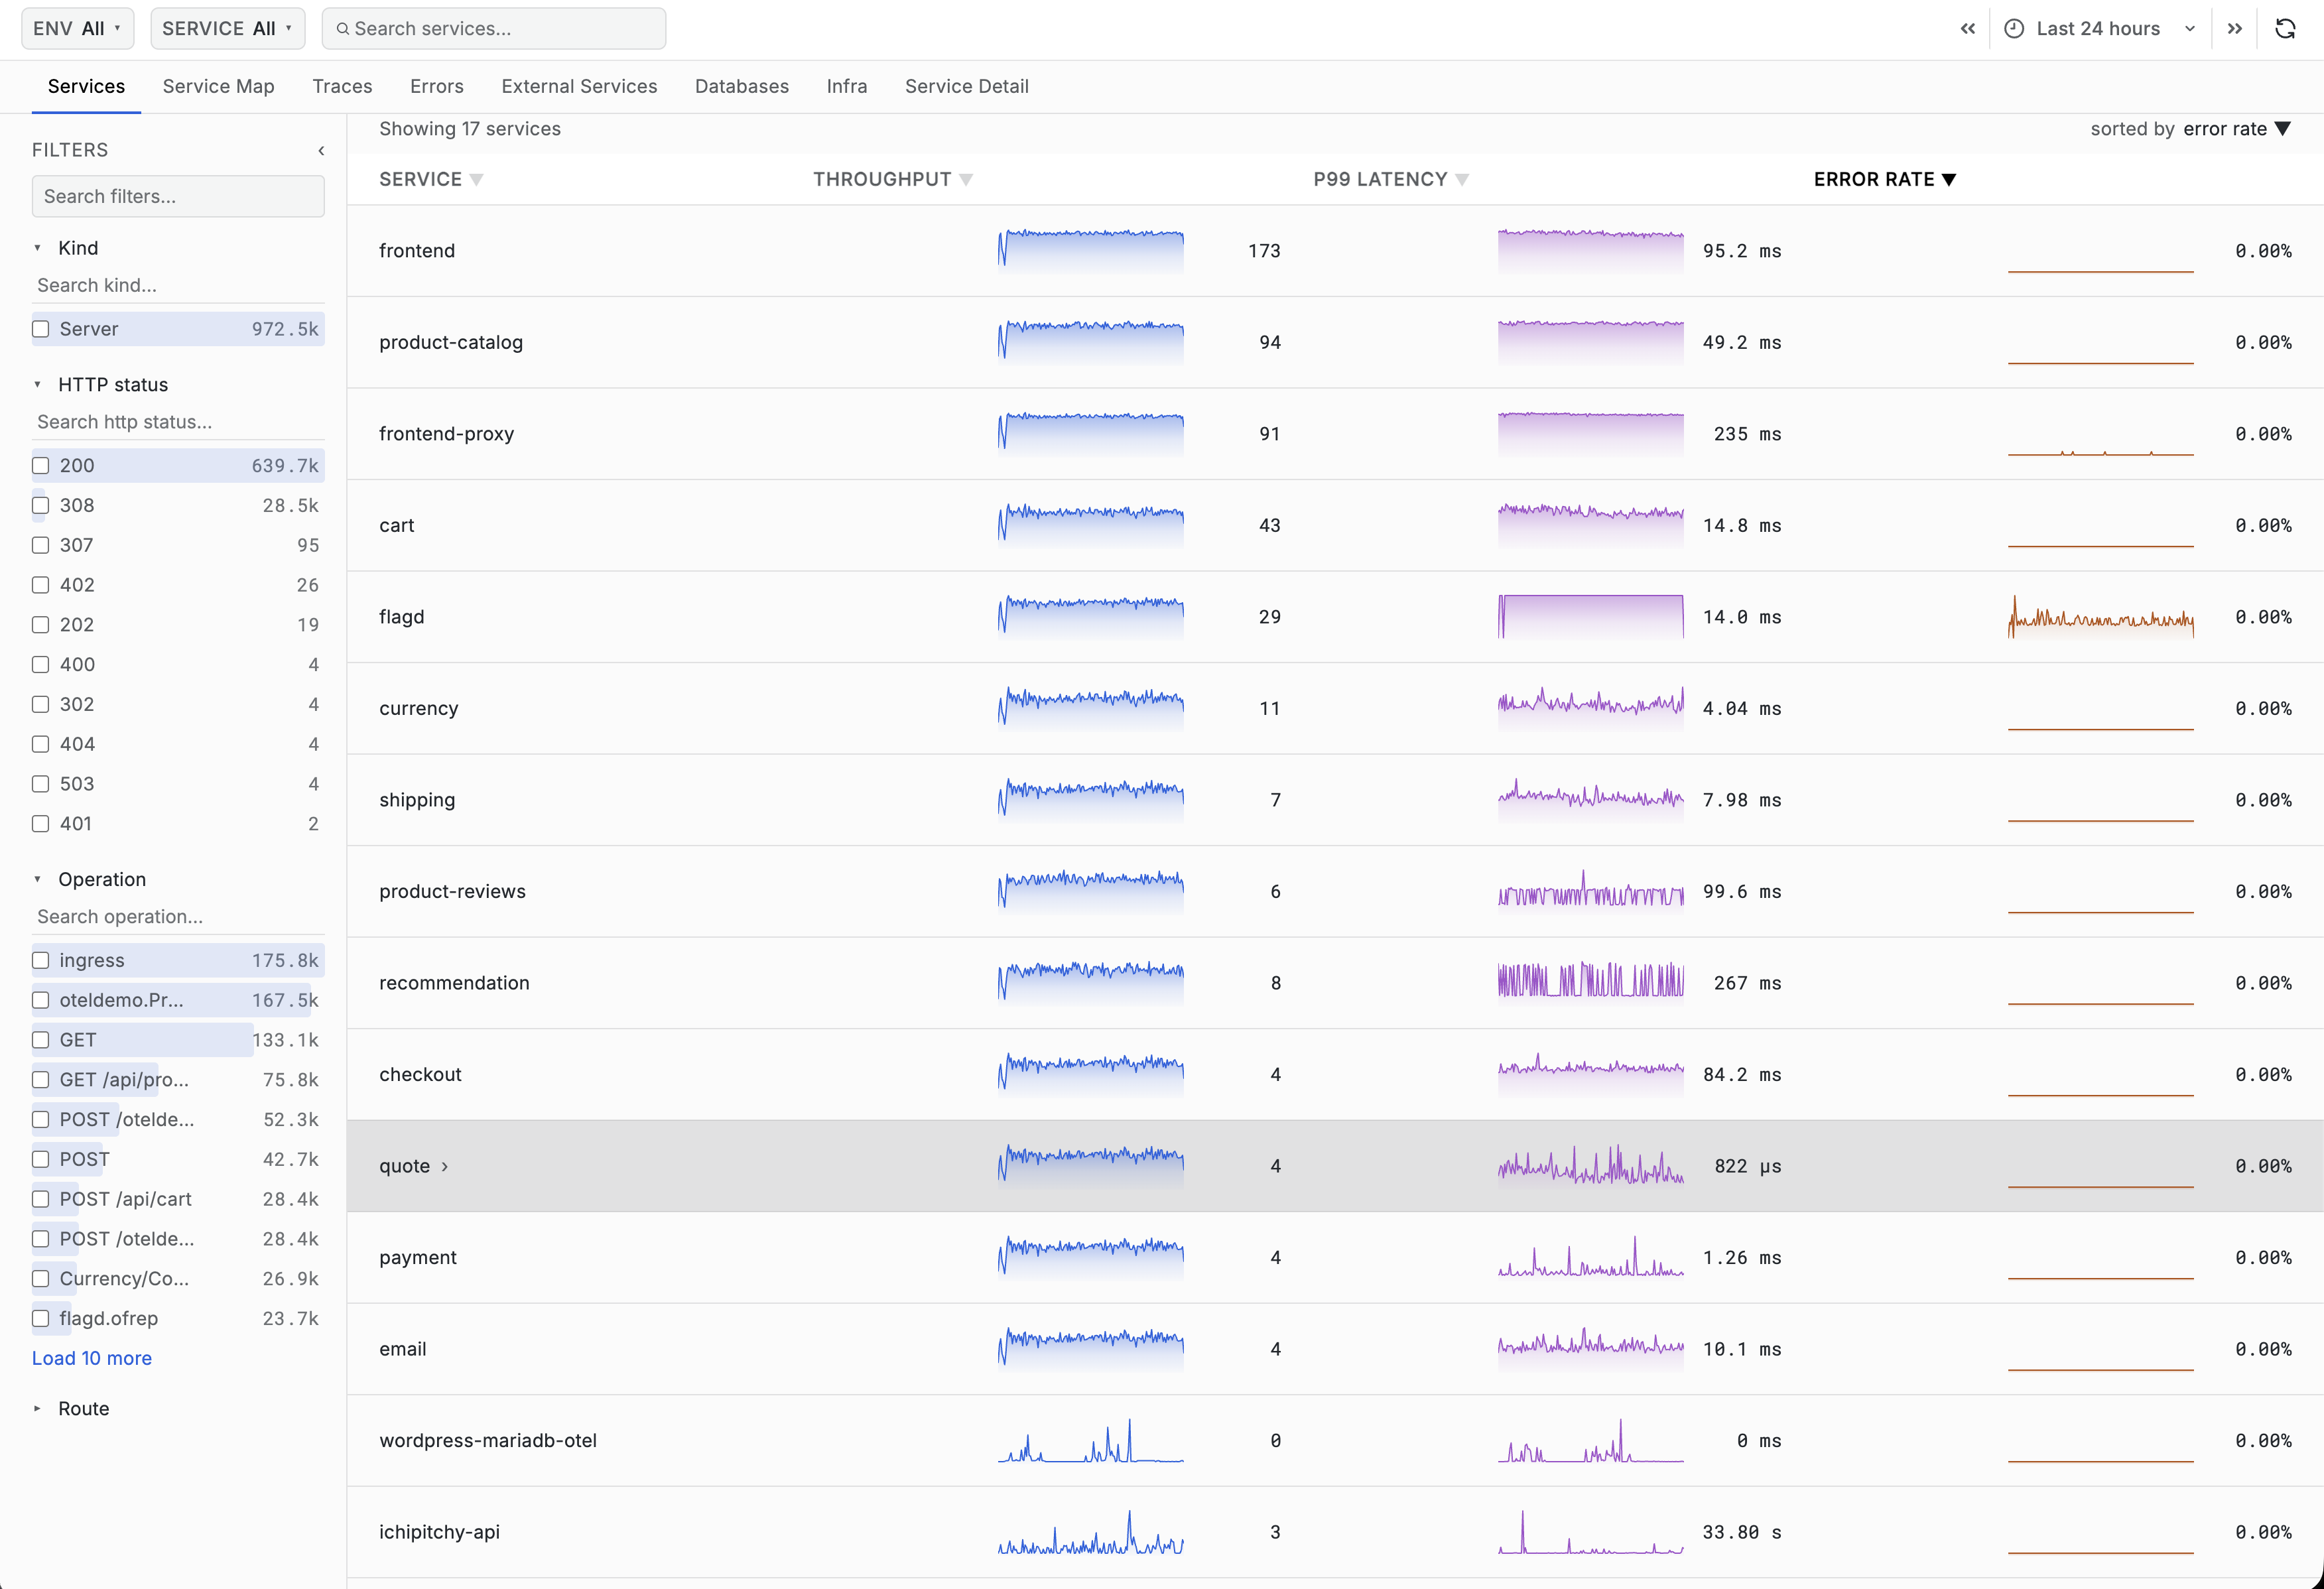
Interface Overview
| Section | Description |
|---|---|
| Topbar | Environment group, environment, service, page-specific selectors, search, time range, and refresh |
| Tabs | Services, Service Map, Traces, and the optional analysis tabs enabled for your deployment |
| Filter sidebar | Faceted filtering on Services, Errors, Database Operations, and Messaging Queues |
| Charts | Rate, error, latency, and resource charts that follow the current scope |
| Tables | Sortable lists with scrolling or pagination and contextual drill-downs |
| Detail views | Service and operation pages plus resizable issue, database, and messaging drawers |
The available tabs depend on your deployment and its telemetry. Errors, Database Operations, Messaging Queues, and Infra can be hidden until their data sources and rollups are ready.
Getting Started
Select a Scope
- If shown, choose the Production or Staging environment group.
- Use ENV to select an environment, or leave it on All.
- Use SERVICE to focus on one service when needed.
- Set the time range. All time-aware charts and tables follow it.
- Use the page search or filter sidebar to narrow a long result set.
Selections are reflected in the URL, so scoped views can be shared. Detail navigation also works with the browser Back button.
Start with Services
The Services tab is the usual starting point. It compares each service by throughput, P99 latency, and error rate, with synchronized sparklines for the selected window.
Click a service to open Service Detail. From its Spans table, click an operation to inspect aggregate statistics and real span occurrences before opening a trace.
Drill to a Trace
Trace links open the embedded traceX view with the relevant service, environment, span, trace ID, and time context. An occurrence link opens the exact trace; an aggregate link opens a filtered trace search.
Tabs at a Glance
| Tab | What it answers |
|---|---|
| Services | Which services or server operations have abnormal traffic, latency, or failures? |
| Service Map | What calls what, and which node or connection is unhealthy? |
| Traces | What happened during an individual request? |
| Errors | Which exceptions are recurring, and what did their latest occurrences do? |
| Database Operations | Which database statements or operations are slow, frequent, or failing? |
| Messaging Queues | Which messaging operations are busy, slow, or failing? |
| Infra | Are the hosts or Kubernetes nodes beneath the services healthy? |
Time Ranges and Raw Trace Safety
- Drag across a time-series chart to apply that interval to the whole app.
- Alert and custom annotations can be overlaid on supported charts and sparklines.
- Your administrator sets the maximum overall APM range.
- Raw detail queries have a separate retention-style limit. They never read spans older than the configured distance from the current time, even if an older historical range is selected.
- Detail views display the absolute raw interval they actually queried.
- Span occurrence search starts with the most recent part of the selected range. By default it searches one hour and, when empty, offers to search 30 minutes earlier. Administrators can change both window sizes.
The raw limit affects occurrence lists in operation, error, database, and messaging details. It does not shorten charts backed by rollup tables.
Table Navigation
Supported APM tables can use either a continuously loaded list or page controls, depending on plugin settings. Column headings sort server-side data, while Load more retrieves another batch where available.