Getting Started with RUM
RUM (Real User Monitoring) is a mobile monitoring app built into Scout. It gives you visibility into how real users experience your mobile applications: tracking crashes, errors, ANRs, app startup, screen performance, network calls, and full session timelines.
RUM queries mobile telemetry stored in the Scout Telemetry Data Lake and
correlates crashes, sessions, and screens so you can move from a symptom
(a crash spike) to a root cause (a specific screen, app version, or device) in
a few clicks. Every attribute you see throughout RUM - service.name,
device.model.name, session.id, and the rest - is a standard OpenTelemetry
resource or span attribute, so this data lines up directly with any traces and
logs you already send to Scout.
Before You Start
This page assumes your app is already sending telemetry to Scout. See Instrument a Flutter app for SDK setup. The SDK batches telemetry and holds one keep-alive connection per signal. Offline buffering is off by default, so the only disk writes are crash evidence, and metrics are opt-in per app - see Performance considerations for the full breakdown.
If you send RUM telemetry from your own OpenTelemetry setup rather than the Flutter SDK, RUM with OpenTelemetry lists the exact span names and attributes each tab reads.
Interface Overview
Every RUM tab shares the same layout:

| Section | Description |
|---|---|
| Application Selector | Choose which mobile application to inspect (top left) |
| Environment Selector | Scope data to a specific environment, or All |
| Search Attributes | Free-text search across the attributes available on the page |
| Navigation Tabs | Switch between Applications, Overview, Crashes, Errors, ANR, Sessions, Screens, Network, and Users |
| Time Picker | Set the time range for every panel on the page |
| Filters Sidebar | Slice every panel by device, app, session, network, and user attributes |
Select an Application
The Applications tab lists every mobile app reporting telemetry to Scout, each tagged with its platform.
- Open the Applications tab
- Select the application you want to monitor
- RUM loads that app's data across all other tabs
Each application card shows its Crash-Free rate, Sessions, Active Users, and current Version for the selected time range, so you can spot a struggling app before drilling in.

Set the Time Range
Use the time picker to scope every panel to a time window (for example, the last 30 days). All charts, tables, and breakdowns update to the selected range.
Filters
Every RUM tab has a Filters sidebar for narrowing down to a specific slice of traffic. A category only appears when the page's data carries those attributes, so the exact set varies by page. These five are the common ones:
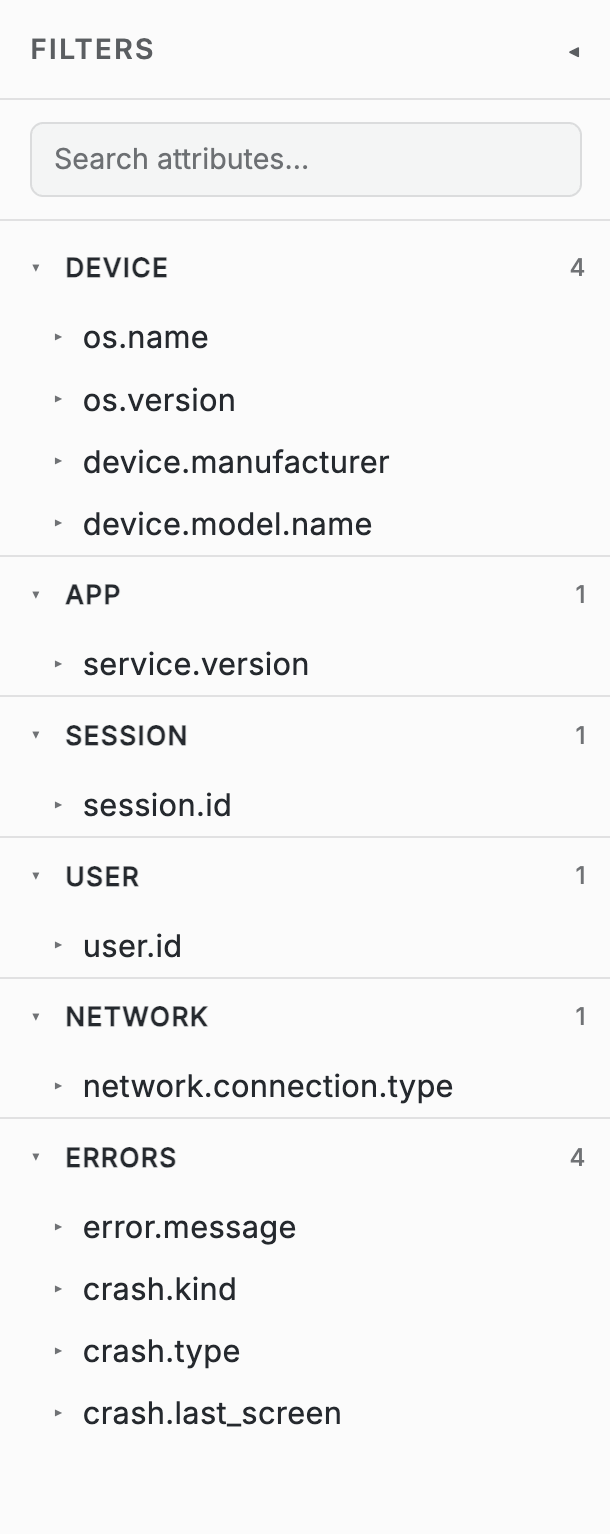
| Category | Common attributes | Use it to... |
|---|---|---|
| Device | os.name, os.version, device.manufacturer, device.model.name | Isolate a specific OS version or device model |
| App | service.version | Compare behavior across app releases |
| Session | session.id, session.sample_rate | Jump to a specific session |
| Network | network.connection.type | Separate wifi from cellular behavior |
| User | user.id, user.anonymous_id | Investigate a single user's experience |
Some pages layer on their own attributes: Crashes, Errors, and ANR add an
Errors category (error.message, crash.kind, crash.type,
crash.last_screen); Network adds HTTP attributes
(http.host, http.route, http.method, http.status_code); Users adds
richer user identity attributes (user.email, user.name, user.phone,
user.plan, user.tenant). Each page's guide below calls out what's specific
to it.
User-identifying attributes only show up here if your app sets them - the SDK
doesn't capture them by default. If you do set them, beforeSend lets you
redact or drop specific attributes before they're exported; see
Security considerations.
Related Guides
- Overview - Health-at-a-glance dashboard
- Crashes - Crash groups and symbolicated stack traces
- Errors - Non-fatal error groups
- ANR - Frozen-UI events
- Sessions - Session list and event timelines
- Screens - Per-screen performance
- Network - API and network performance
- Users - Per-user activity and history
- Instrument a Flutter app - SDK setup and configuration
- RUM with OpenTelemetry - Span names and attributes RUM reads, for custom instrumentation