RUM Sessions
The Sessions tab lists individual user sessions so you can go from an aggregate stat straight to the exact session that produced it.
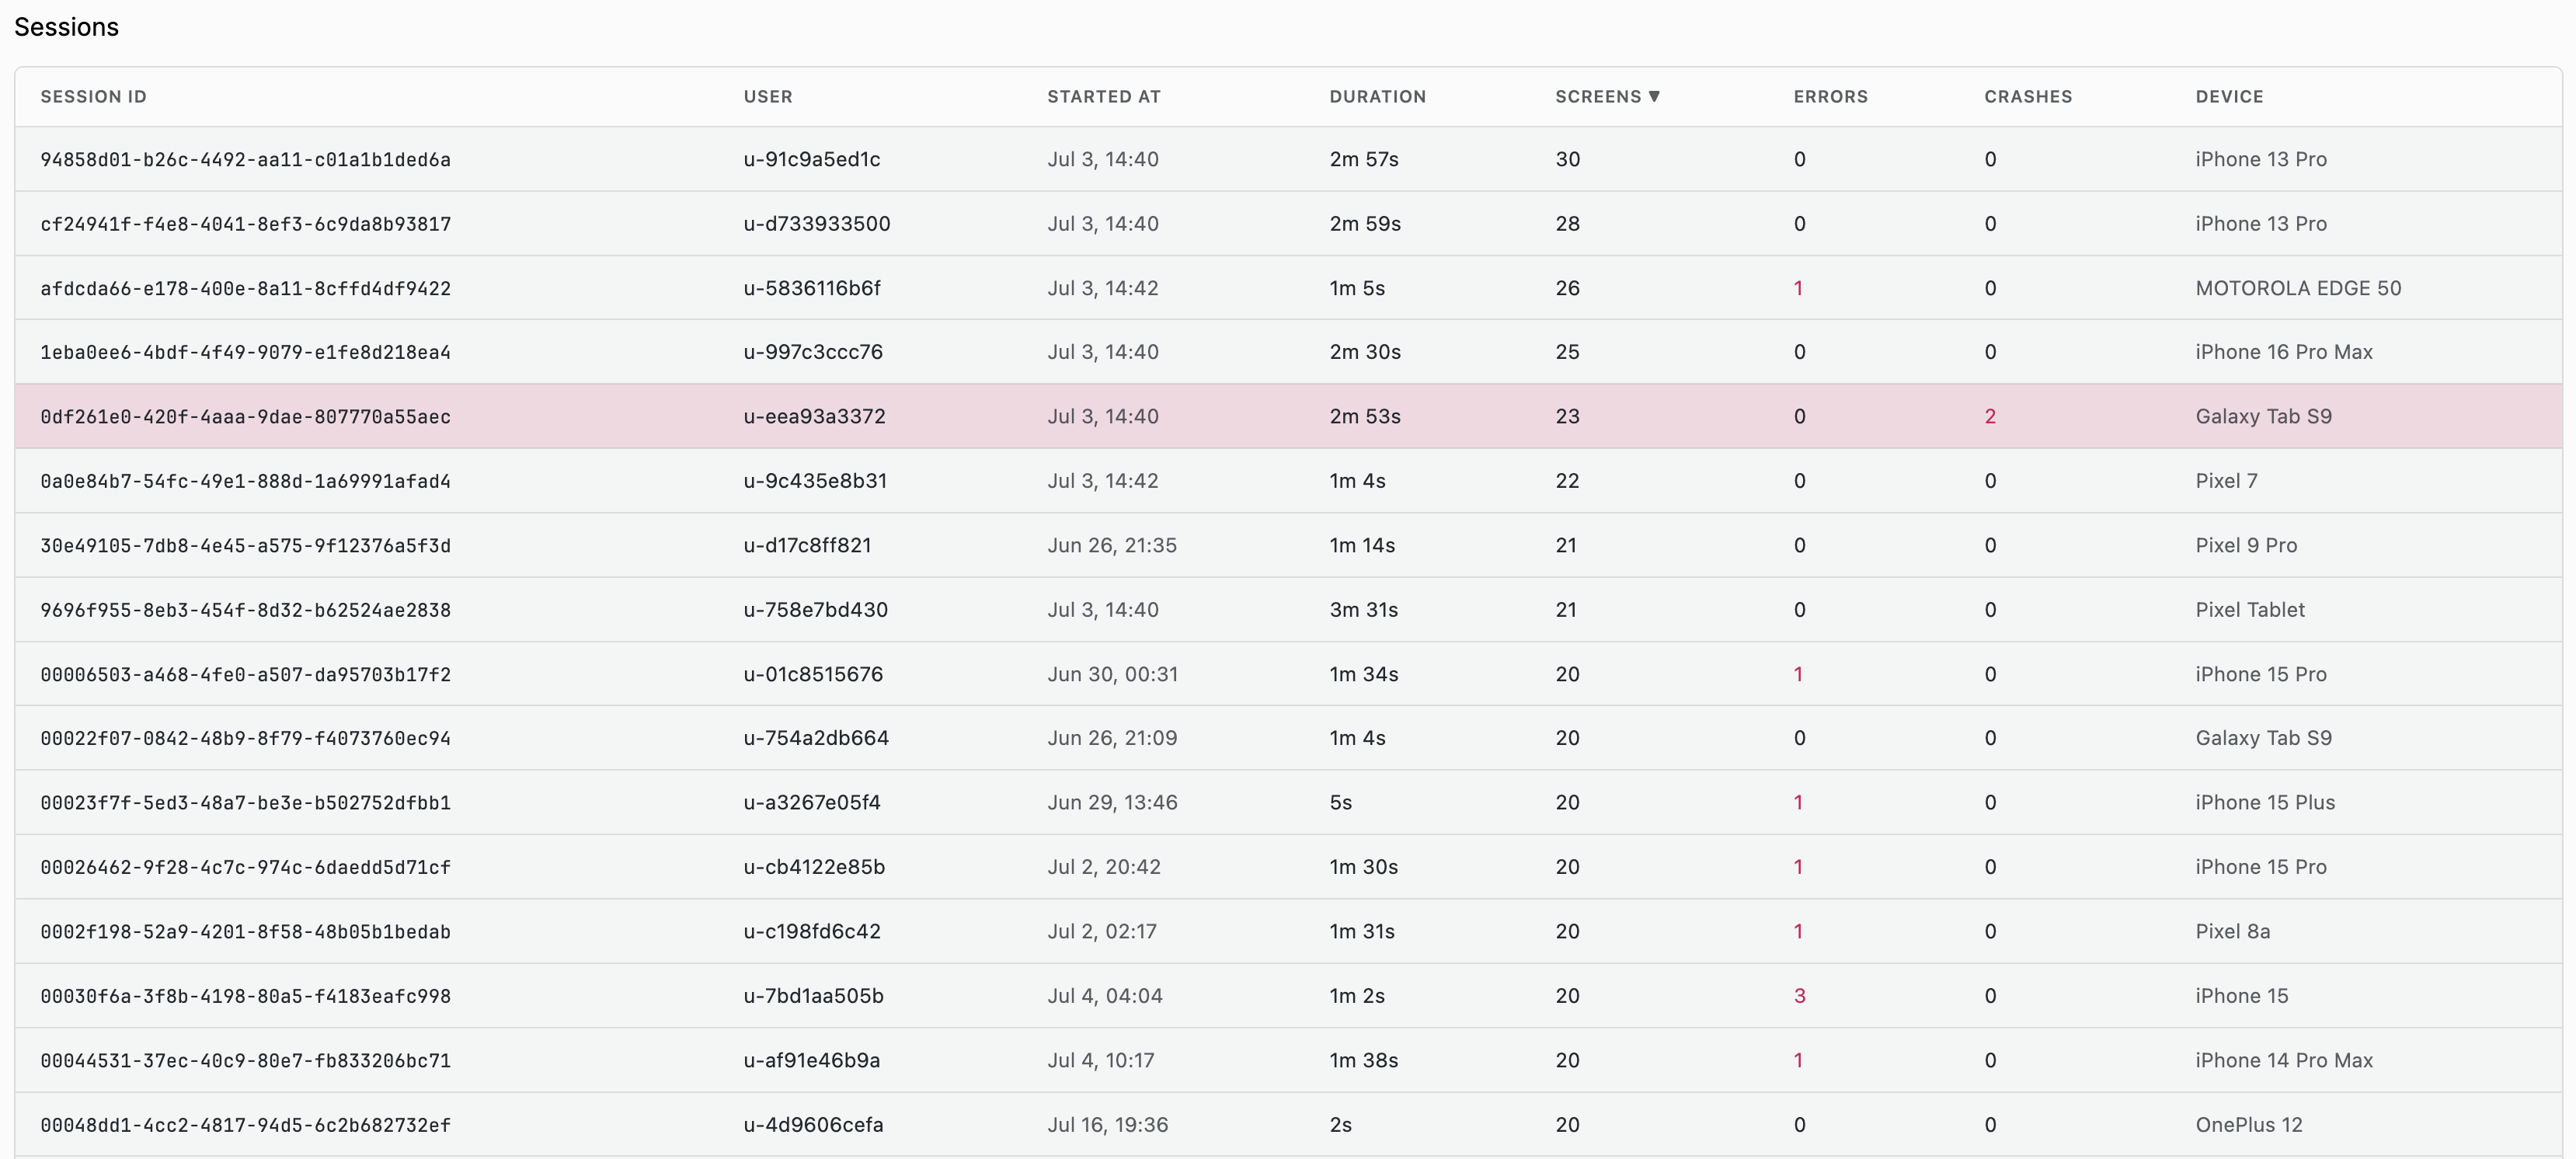
Session List
Table Columns
| Column | Description |
|---|---|
| Session ID | Unique identifier for the session |
| User | The user's identifier |
| Started At | When the session began |
| Duration | How long the session lasted |
| Screens | Number of distinct screens viewed |
| Errors | Non-fatal errors during the session |
| Crashes | Crashes during the session |
| Device | Device model the session ran on |
Sessions with one or more crashes are highlighted in the table so you can spot them while scanning. Sort by Duration or Errors to find outliers worth a closer look.
The shared Filters sidebar applies here too,
plus user.anonymous_id under the User category.
Session Timeline
Click a session to open its timeline: a chronological view of everything that happened during that session.
Session Attributes and Resource Attributes
Two separate attribute panels:
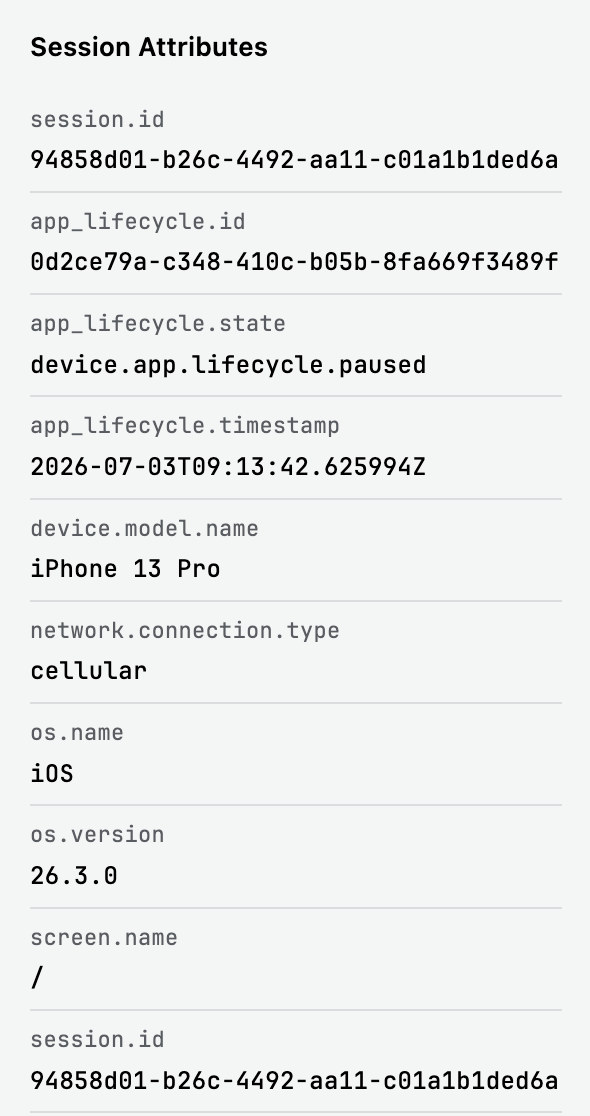
- Session Attributes -
session.id,session.sample_rate,session.sampled,session.start_time,session.type,app_lifecycle.id,app_lifecycle.state,app_lifecycle.timestamp, device and OS identifiers, and (when the user is identified)user.id,user.email,user.name,user.phone,user.plan,user.tenant,user.anonymous_id
session.sample_rate is the app's configured sampling percentage (the SDK
defaults to 1%); session.sampled shows whether this particular session was
kept. Crash, error, and ANR spans bypass the sample rate and are always
exported (alwaysCaptureErrors, on by default), so those events are never
lost. The rest of the session - screen views, network calls, interactions - is
only recorded when session.sampled is true, so an unsampled session that
crashed shows the crash without the timeline that led up to it. See
Sessions in the
instrumentation guide.
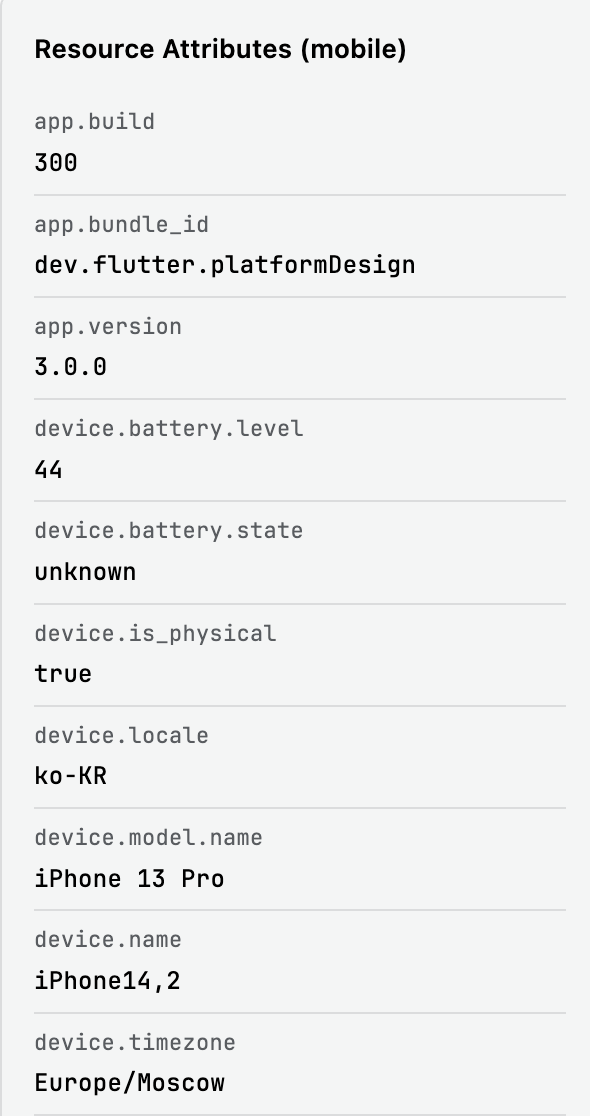
- Resource Attributes (mobile) - the static resource context attached to
every event in the session:
app.build,app.bundle_id,app.version,device.battery.level,device.battery.state,device.is_physical,device.locale,device.model.name,device.type,host.arch,network.connection.type,os.build,os.name,os.version,service.name,service.version,telemetry.sdk.language,telemetry.sdk.name,telemetry.sdk.version
Summary Stats
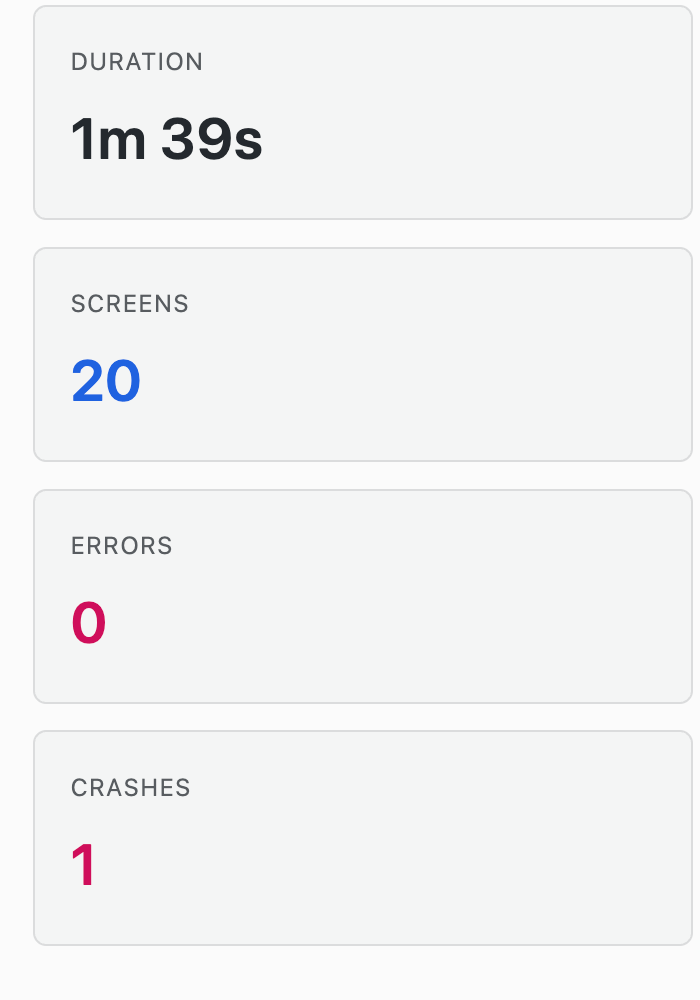
Duration, Screens, Errors, and Crashes for the session, matching the columns in the Session List.
Event Timeline
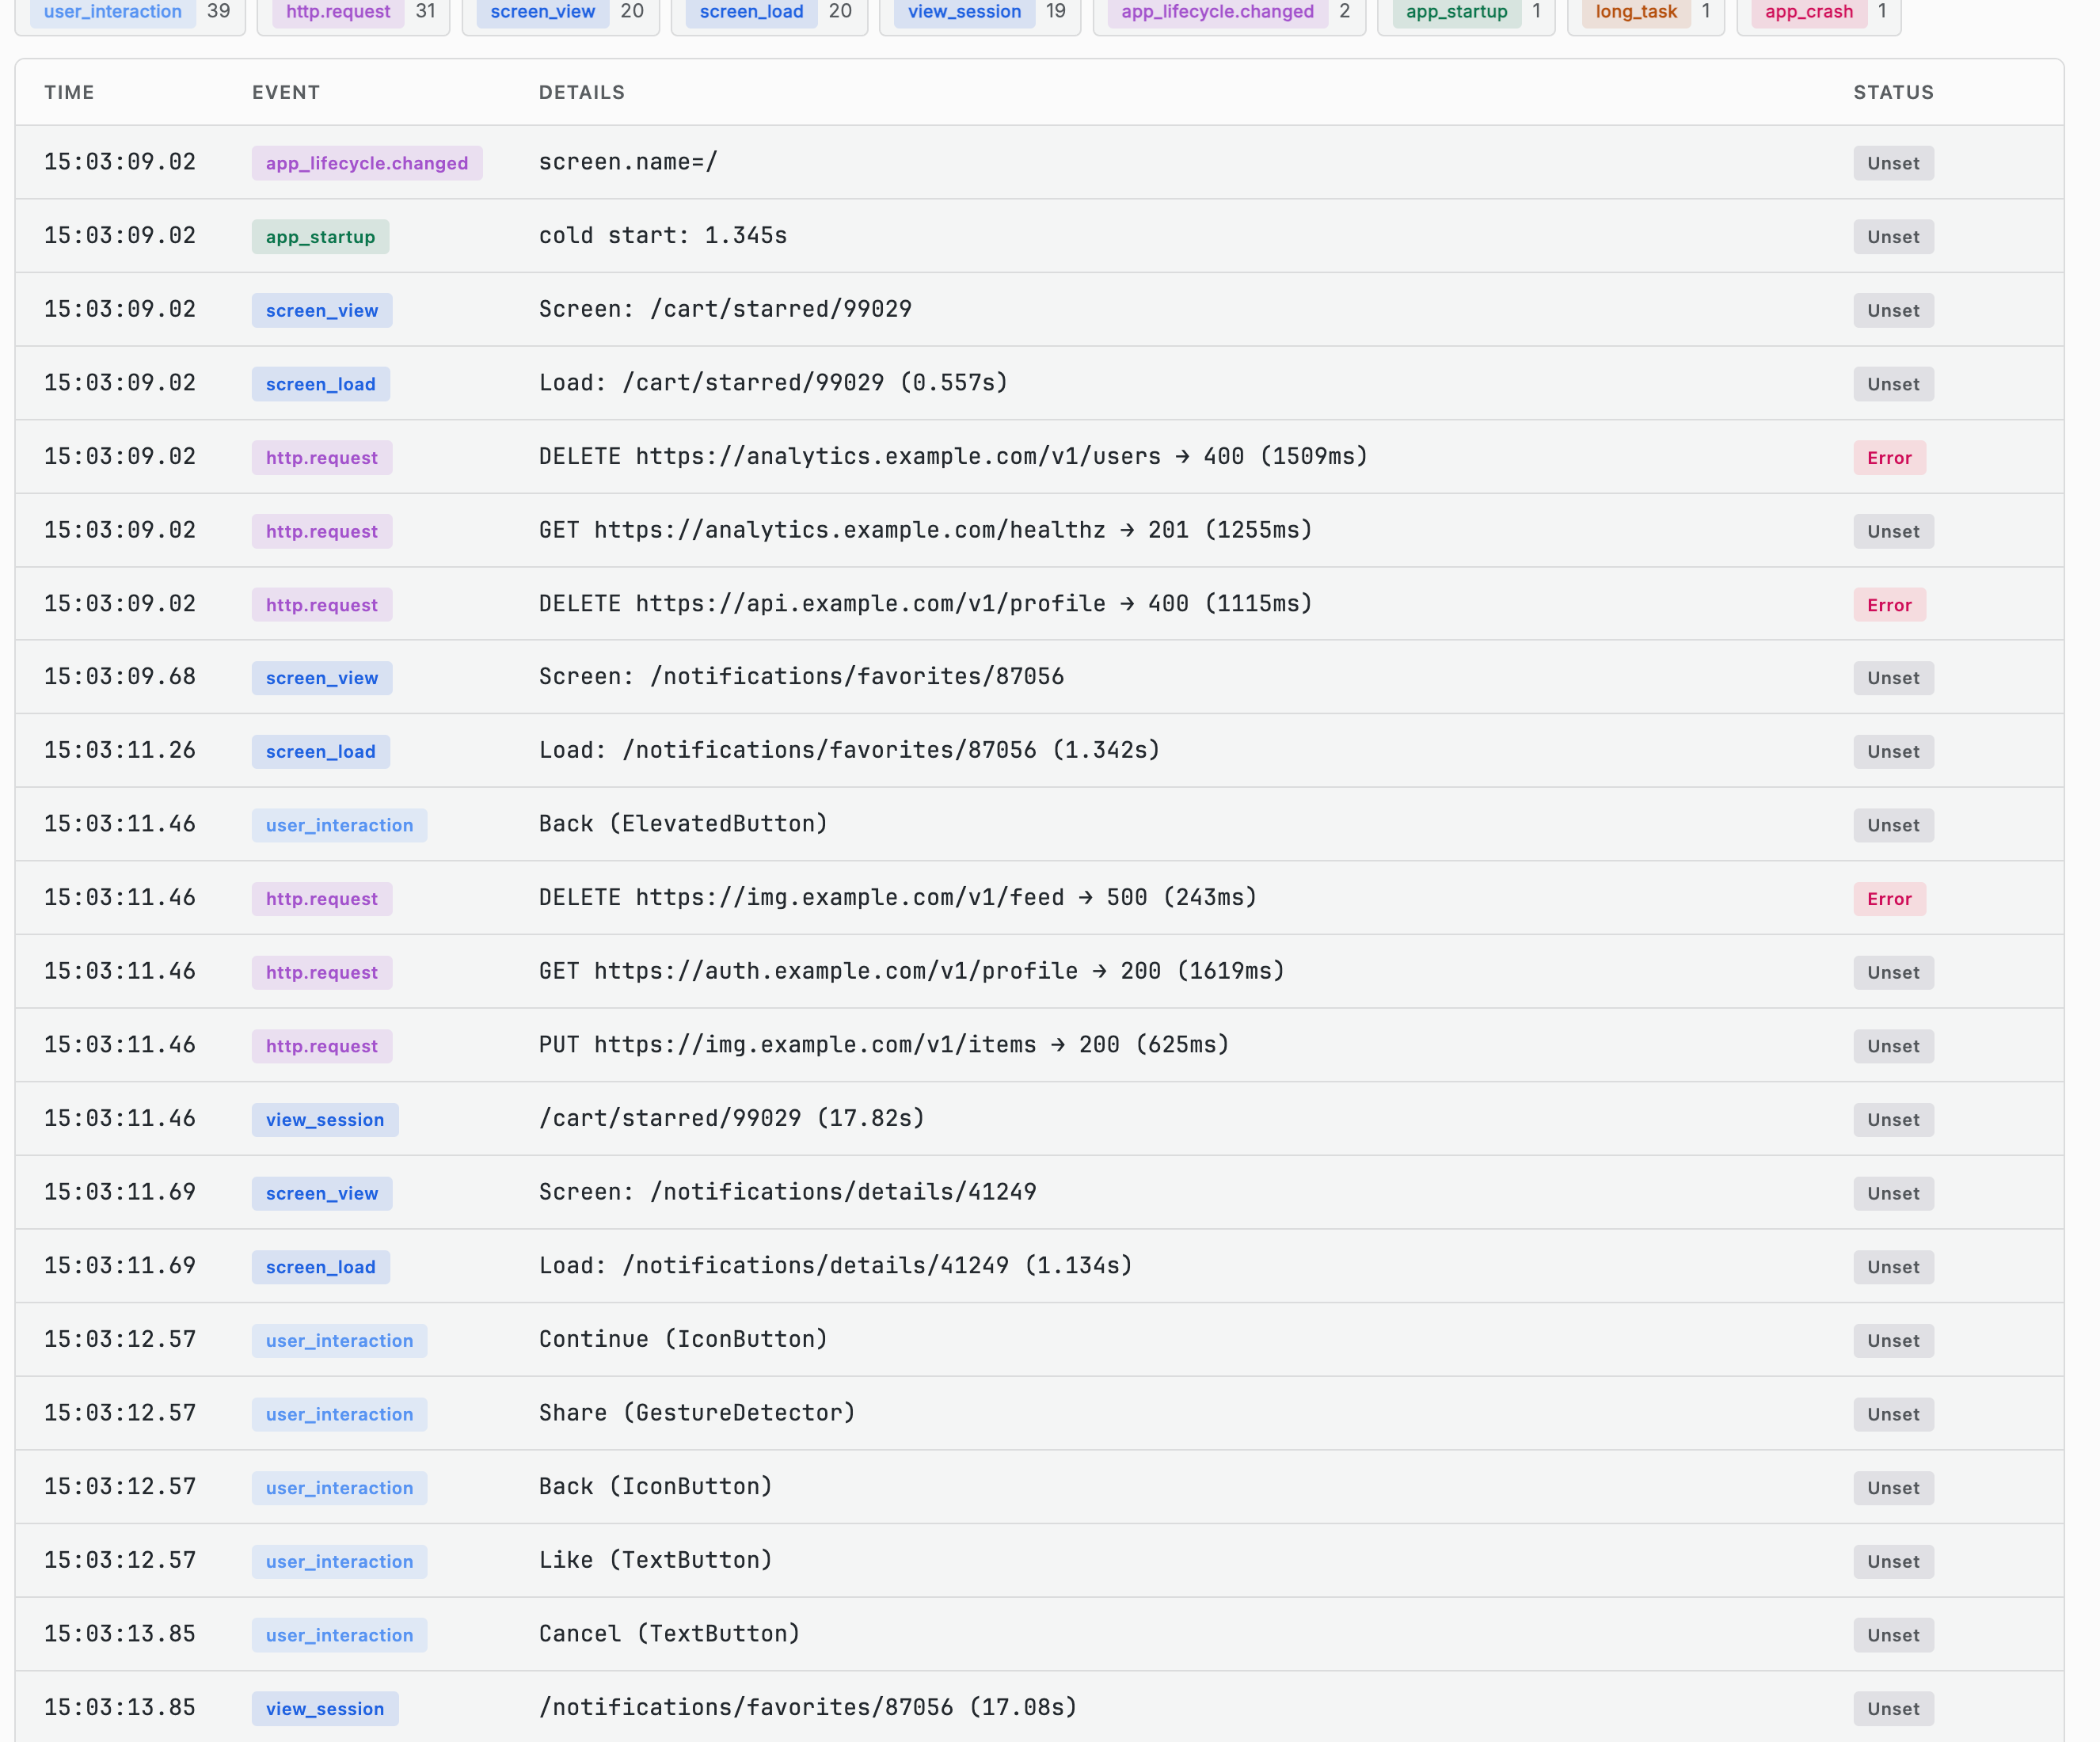
A chronological table (Time, Event, Details, Status) of every event captured during the session, including:
| Event type | What it represents |
|---|---|
screen_view / screen_load | A screen was shown / finished loading, with load duration |
user_interaction | A tap or gesture, with the widget name in Details (for example "Back (ElevatedButton)") |
http.request | An API call, with method, URL, status code, and duration |
view_session | Time spent on a screen - an "entered" marker when the user arrives, paired with a duration when they leave |
app_startup | App start, tagged cold or warm, with startup duration |
long_task | A long-running task on the UI thread (potential jank) |
app_lifecycle.changed | App lifecycle transitions (backgrounded, resumed) |
app_crash | A crash occurred during the session |
Failed requests and errors are highlighted in the Status column so they
stand out in a long timeline. Use the event-type filter chips above the
timeline (with per-type counts) to toggle categories on or off and cut a
noisy session down to just, say, http.request and app_crash events.
Use Cases
Reproducing a Bug Report
- Find the user's session (filter by
user.idif known, or search by session ID from a support ticket) - Open the timeline and filter down to
screen_viewanduser_interactionevents - Walk through the sequence leading up to the reported issue
Investigating a Slow Session
- Sort the Session List by Duration
- Open the timeline and filter to
http.requestandlong_taskevents - Look for slow requests or repeated long tasks clustered together
FAQ
Why does a crashed session have no timeline?
Because the session was not sampled. Crash, error, and ANR spans are exported
by default, but screen views, network calls, and interactions are recorded only
when session.sampled is true. An unsampled session that crashed shows the
crash without the events that led to it.
What is the difference between Session Attributes and Resource Attributes?
Session Attributes describe this session: its ID, sample rate, lifecycle state, start time, and the user when one is identified. Resource Attributes are the static context attached to every event in it, such as app version, device model, OS, and SDK version.
What does session.sample_rate tell me?
session.sample_rate tell me?It is the app's configured sampling percentage, 1% by default, while
session.sampled tells you whether this particular session was kept. Read the
two together before drawing conclusions from a session count.
Related Guides
- Getting Started - Interface layout and shared filters
- Overview - Session volume trend
- Crashes - Crash groups, with a link back into the session
- Users - Per-user session history