RUM Screens
The Screens tab measures per-screen performance across your app, so you can find the slowest or jankiest screens without knowing what to look for up front.
Load Time on Mobile vs. Web
What "load time" means depends on the platform, and the tab adapts to the app you have selected:
| Mobile (Flutter, iOS, Android) | Web | |
|---|---|---|
| Headline load metric | Load Time: time to render the screen after navigation | LCP (Largest Contentful Paint) by default, or FCP (First Contentful Paint), p75 |
| Secondary timing | — | Route Transition: time from a client-side route change to the next rendered frames |
| Core Web Vitals row | Only when the app relays vitals from embedded WebViews | Always |
On the web, Route Transition is not a page-load measurement. It's a few milliseconds for most navigations. It can also stretch to hours when a tab is left in the background, because the browser stops rendering hidden tabs. For that reason it is reported as p50 / p95 rather than an average. LCP, which the browser measures once per full page load, is the page-load number.
Choosing LCP or FCP
An admin picks the web page-load metric under Administration → Plugins → RUM → Web Performance → Page Load Metric:
- LCP (default) - when the page's main content has rendered. This is the Core Web Vitals standard, and the closest match to "the page looks loaded".
- FCP - when the browser first renders anything (text, an image, a background). It is always earlier than LCP, and tracks server response and render-blocking resources rather than the main content.
The setting changes the Slowest Screen tile, the Overview's Slowest Screens table, the screen's trend chart (LCP Trend or FCP Trend) and its slowest-loads table (Slowest LCP or Slowest FCP). With FCP selected, the screen list also gains an FCP p75 column. The Core Web Vitals row always shows LCP, INP, and CLS, and mobile apps keep their own Load Time whatever the setting. FCP carries no attribution, so Slowest FCP has no Delay / Load / Render or Element columns.
All load times are shown as percentiles (p50 / p95 for load time and route transition, p75 for Core Web Vitals) so that a handful of extreme outliers cannot dominate them.
Screen List
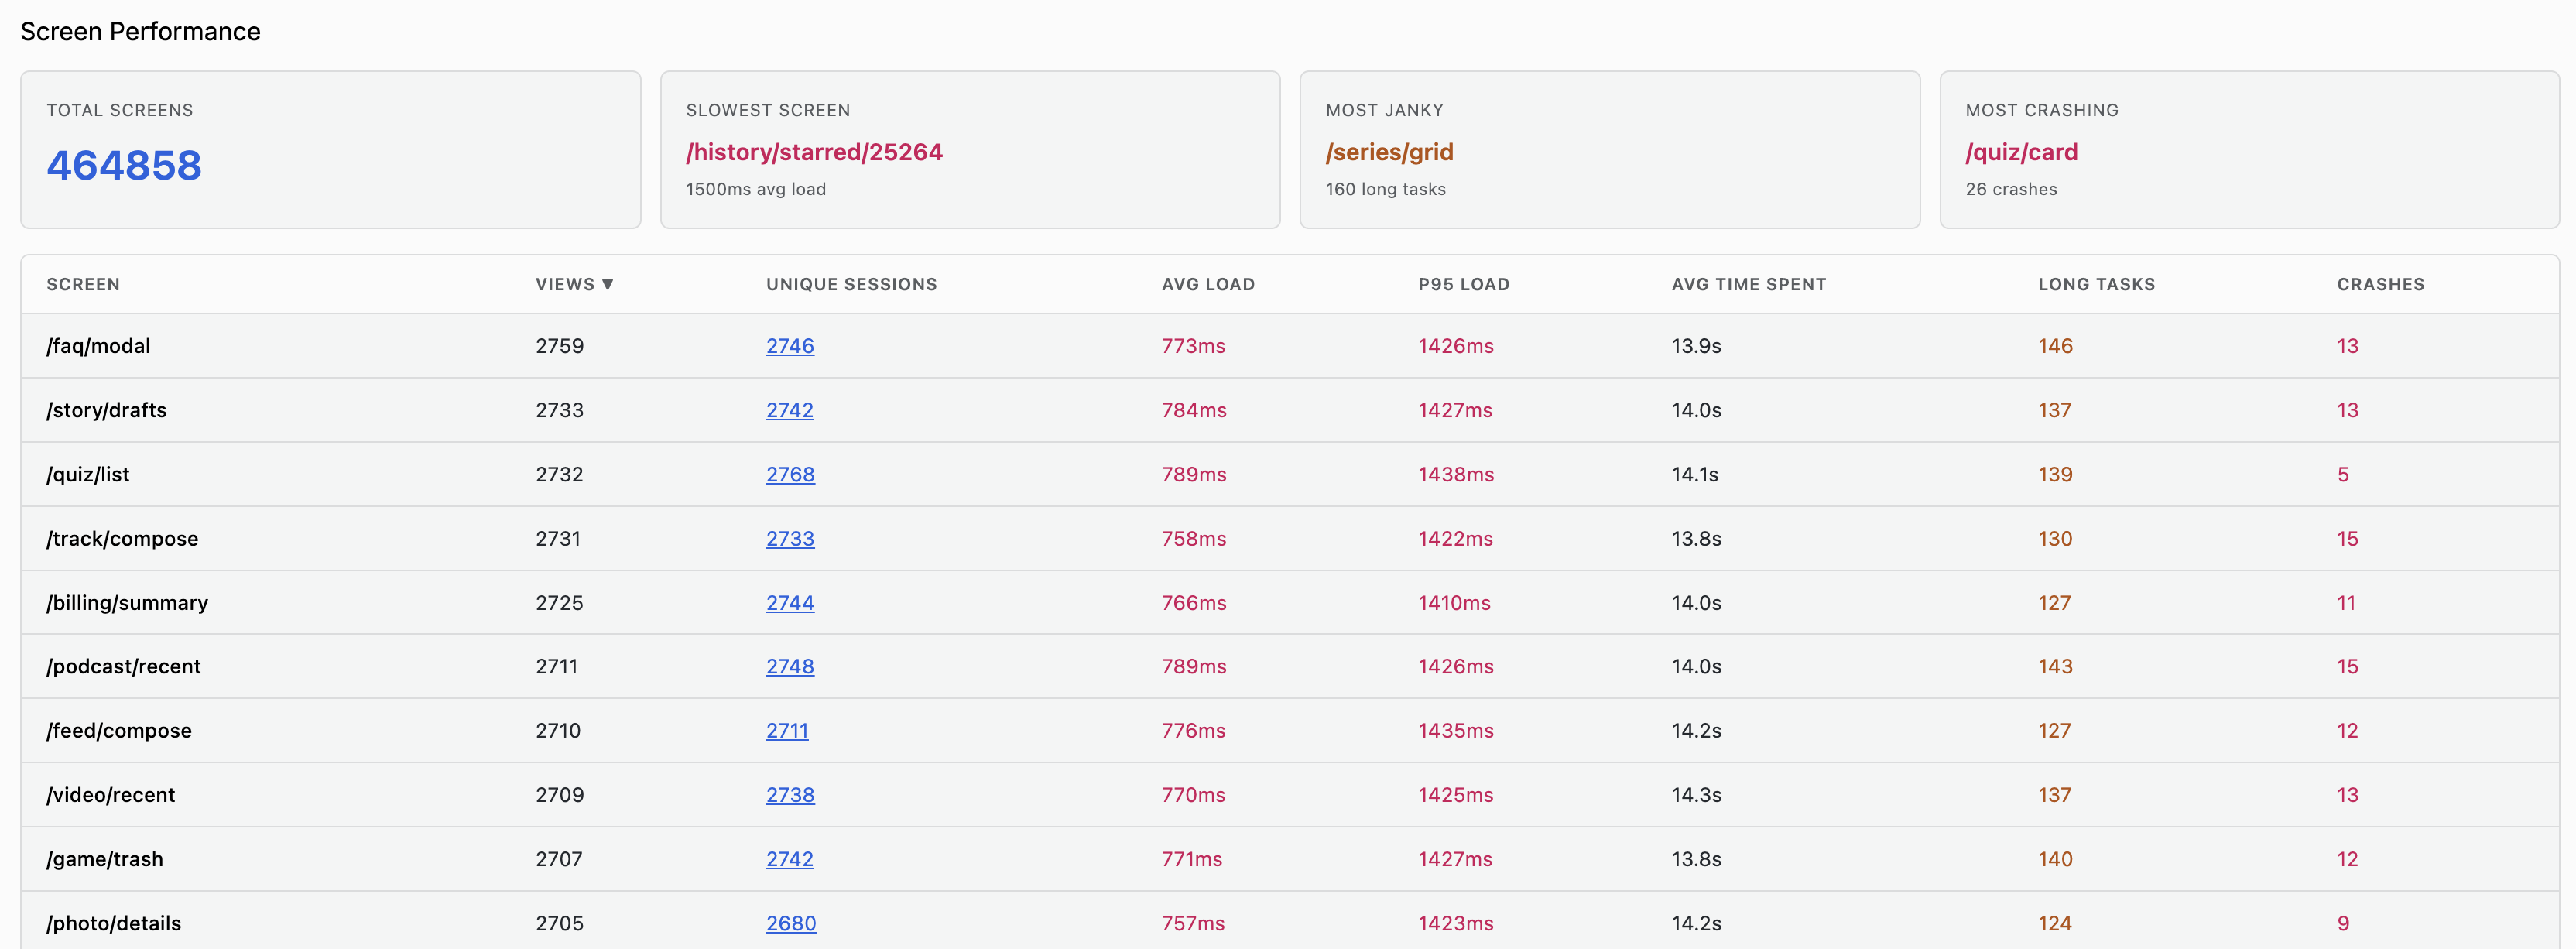
Four stat tiles summarize the whole app before the table: Total Screens, Slowest Screen, Most Janky (with its long task count), and Most Crashing (with its crash count). Slowest Screen is ranked by p75 LCP on web apps (or p75 FCP, if configured) and by p95 load time on mobile apps.
Core Web Vitals
On web apps, and on mobile apps that embed WebViews, a row of three tiles sits above the table: LCP, INP (Interaction to Next Paint), and CLS (Cumulative Layout Shift). Each shows the p75 value, colored against the standard thresholds:
| Vital | Good | Needs improvement | Poor |
|---|---|---|---|
| LCP | ≤ 2.5 s | ≤ 4 s | > 4 s |
| INP | ≤ 200 ms | ≤ 500 ms | > 500 ms |
| CLS | ≤ 0.1 | ≤ 0.25 | > 0.25 |
Under each value, a bar shows the share of measurements the browser itself rated good, needs improvement, or poor.
Table Columns
| Column | Description |
|---|---|
| Screen | The screen's route/name |
| Views | Number of times the screen was viewed |
| Unique Sessions | Distinct sessions that viewed it (links to a filtered session list) |
| LCP p75 / INP p75 / CLS p75 | Core Web Vitals for the screen (web apps and WebView-embedding apps only) |
| Load Time p50 / p95 | Median and 95th-percentile load time. Shown as Route Transition p50 / p95 on web apps |
| Avg Time Spent | Average time users spent on the screen |
| Long Tasks | Count of long-running UI-thread tasks (jank) |
| Crashes | Crashes that occurred on this screen |
Sort by LCP p75 (web), Load Time p95 (mobile), or Long Tasks to find the screens most in need of optimization.
Screen Details
Select a screen to see its full performance breakdown.
Summary Stats

Views, Unique Sessions, Load Time p50, Load Time p95, Long Tasks, and Crashes for the selected screen and time range. On a web app the load tiles are labeled Route Transition p50 / p95, and the screen's own Core Web Vitals row (LCP / INP / CLS at p75) sits beneath them.
Load Time Trend and Views Over Time
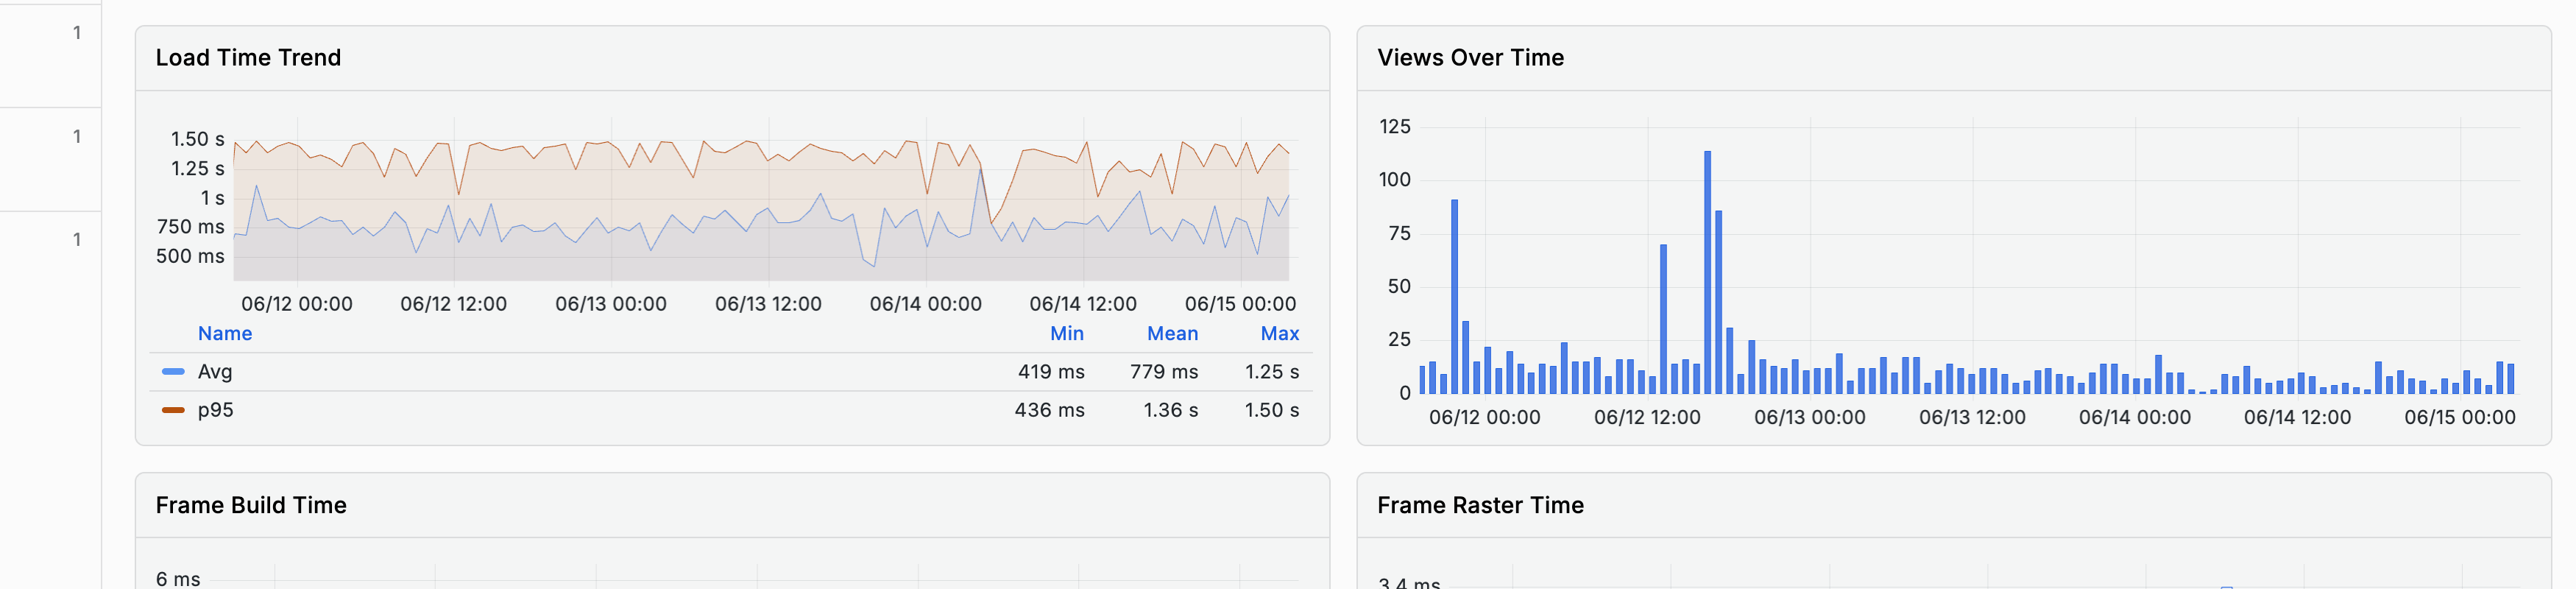
- Load Time Trend (mobile) - p50 and p95 load time over the range, with a Name / Min / Mean / Max table
- LCP Trend (web) - p50 and p75 LCP over the range (FCP Trend when the app is configured for FCP). The Route Transition Trend follows further down the page
- Views Over Time - view volume over the range
Web Vitals
On web apps two further charts follow:
- Web Vitals (p75) - LCP, INP, FCP, and TTFB for the screen, one line each, in milliseconds
- CLS (p75) - layout shift on its own axis, since it is a unitless score
Rendering and Resource Usage
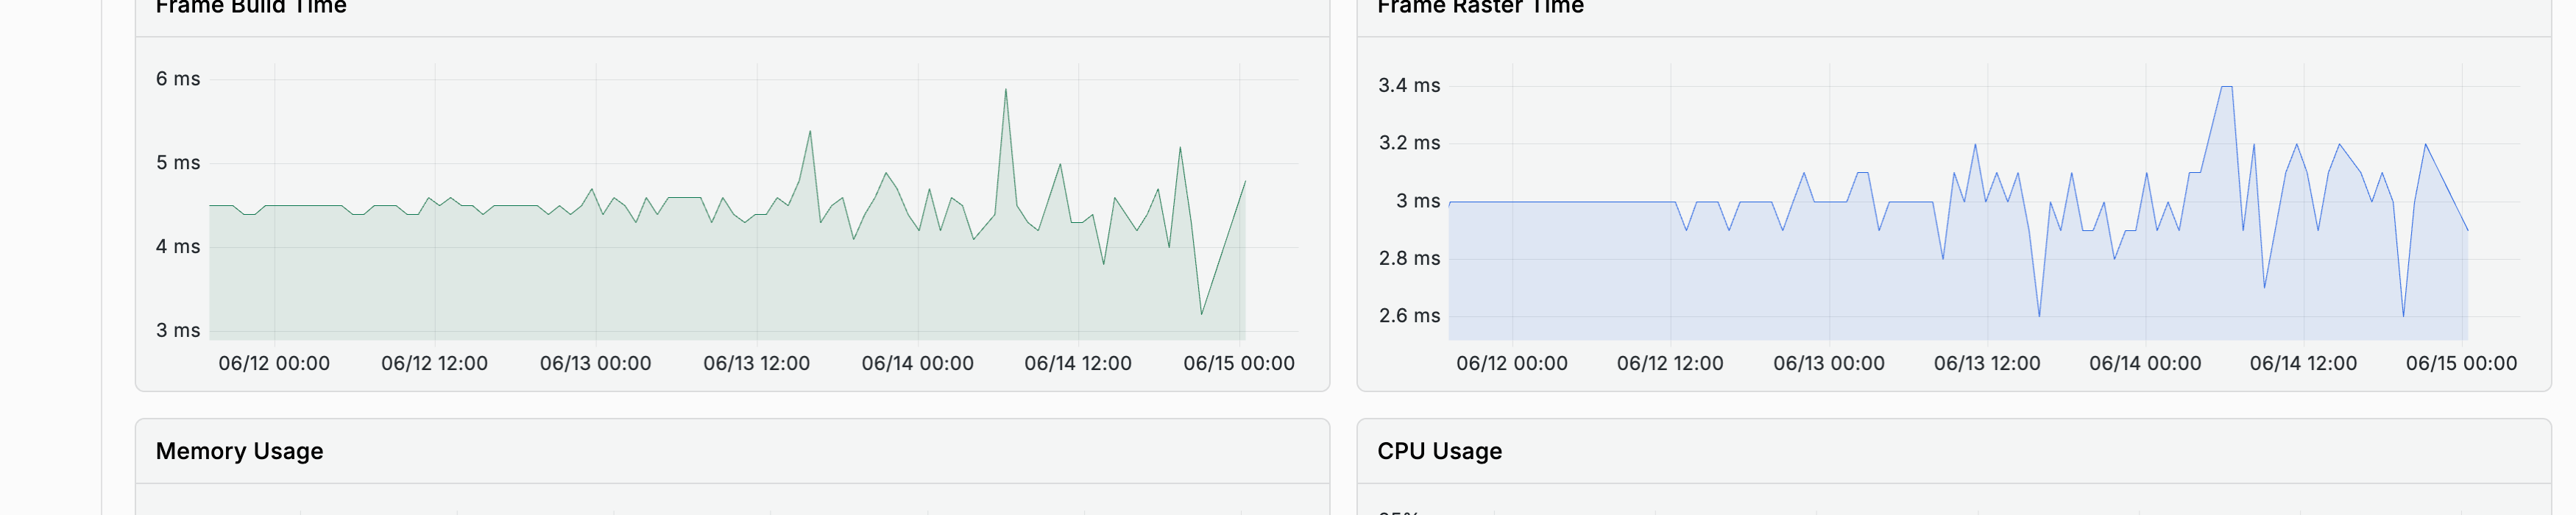
- Frame Build Time and Frame Raster Time - how long each frame took to build (widget/layout work) versus rasterize (GPU work); sustained spikes in either indicate jank
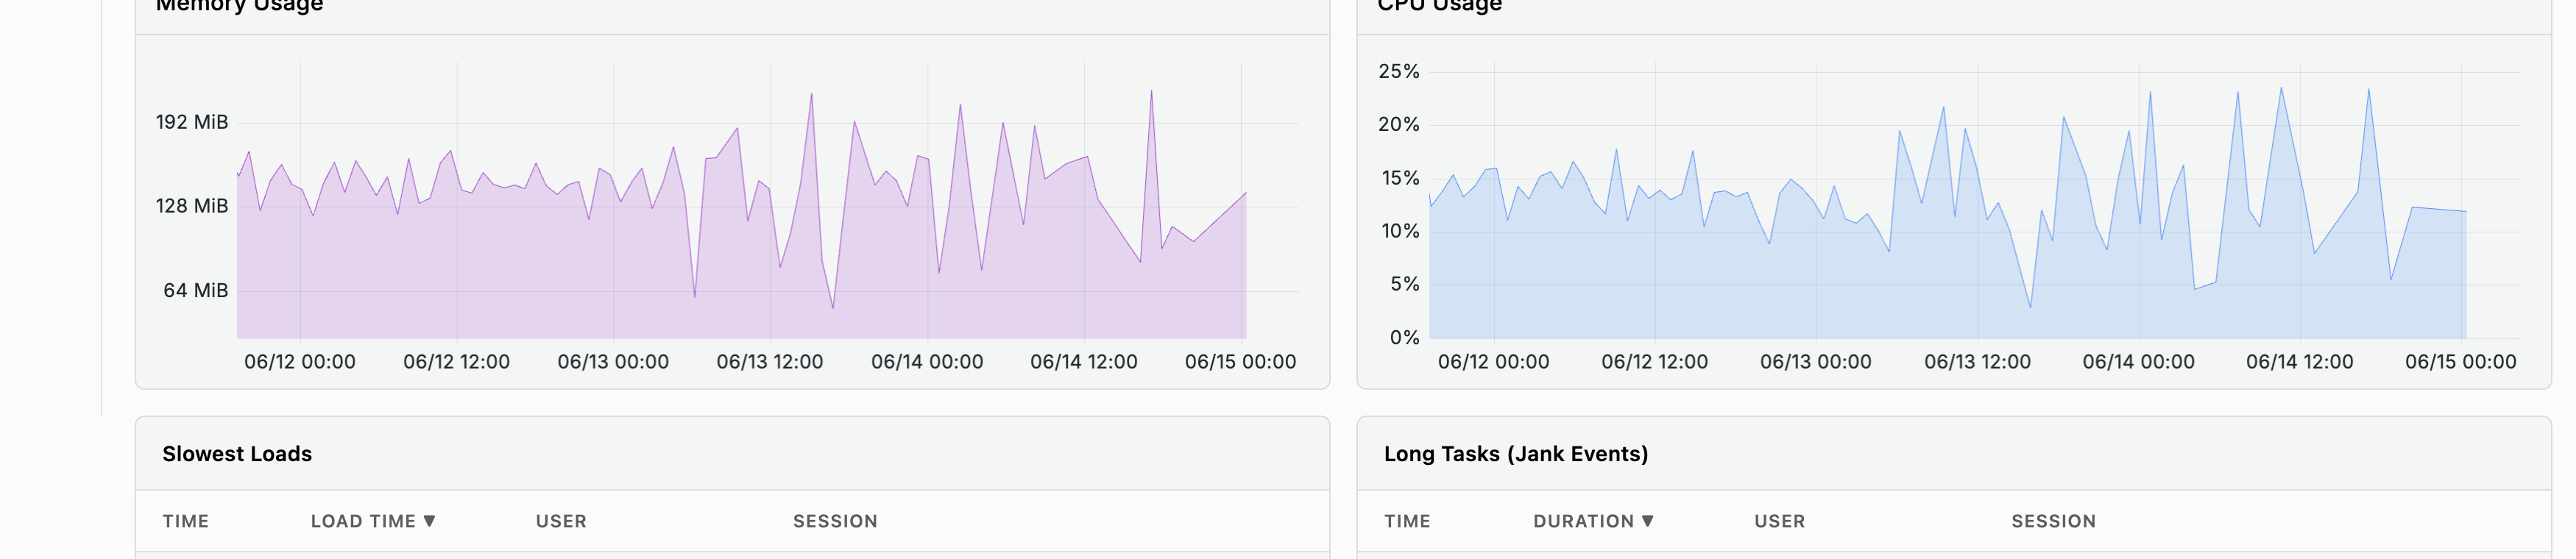
- Memory Usage - resident memory over time
- CPU Usage - CPU utilization over time
Slowest Loads and Long Tasks
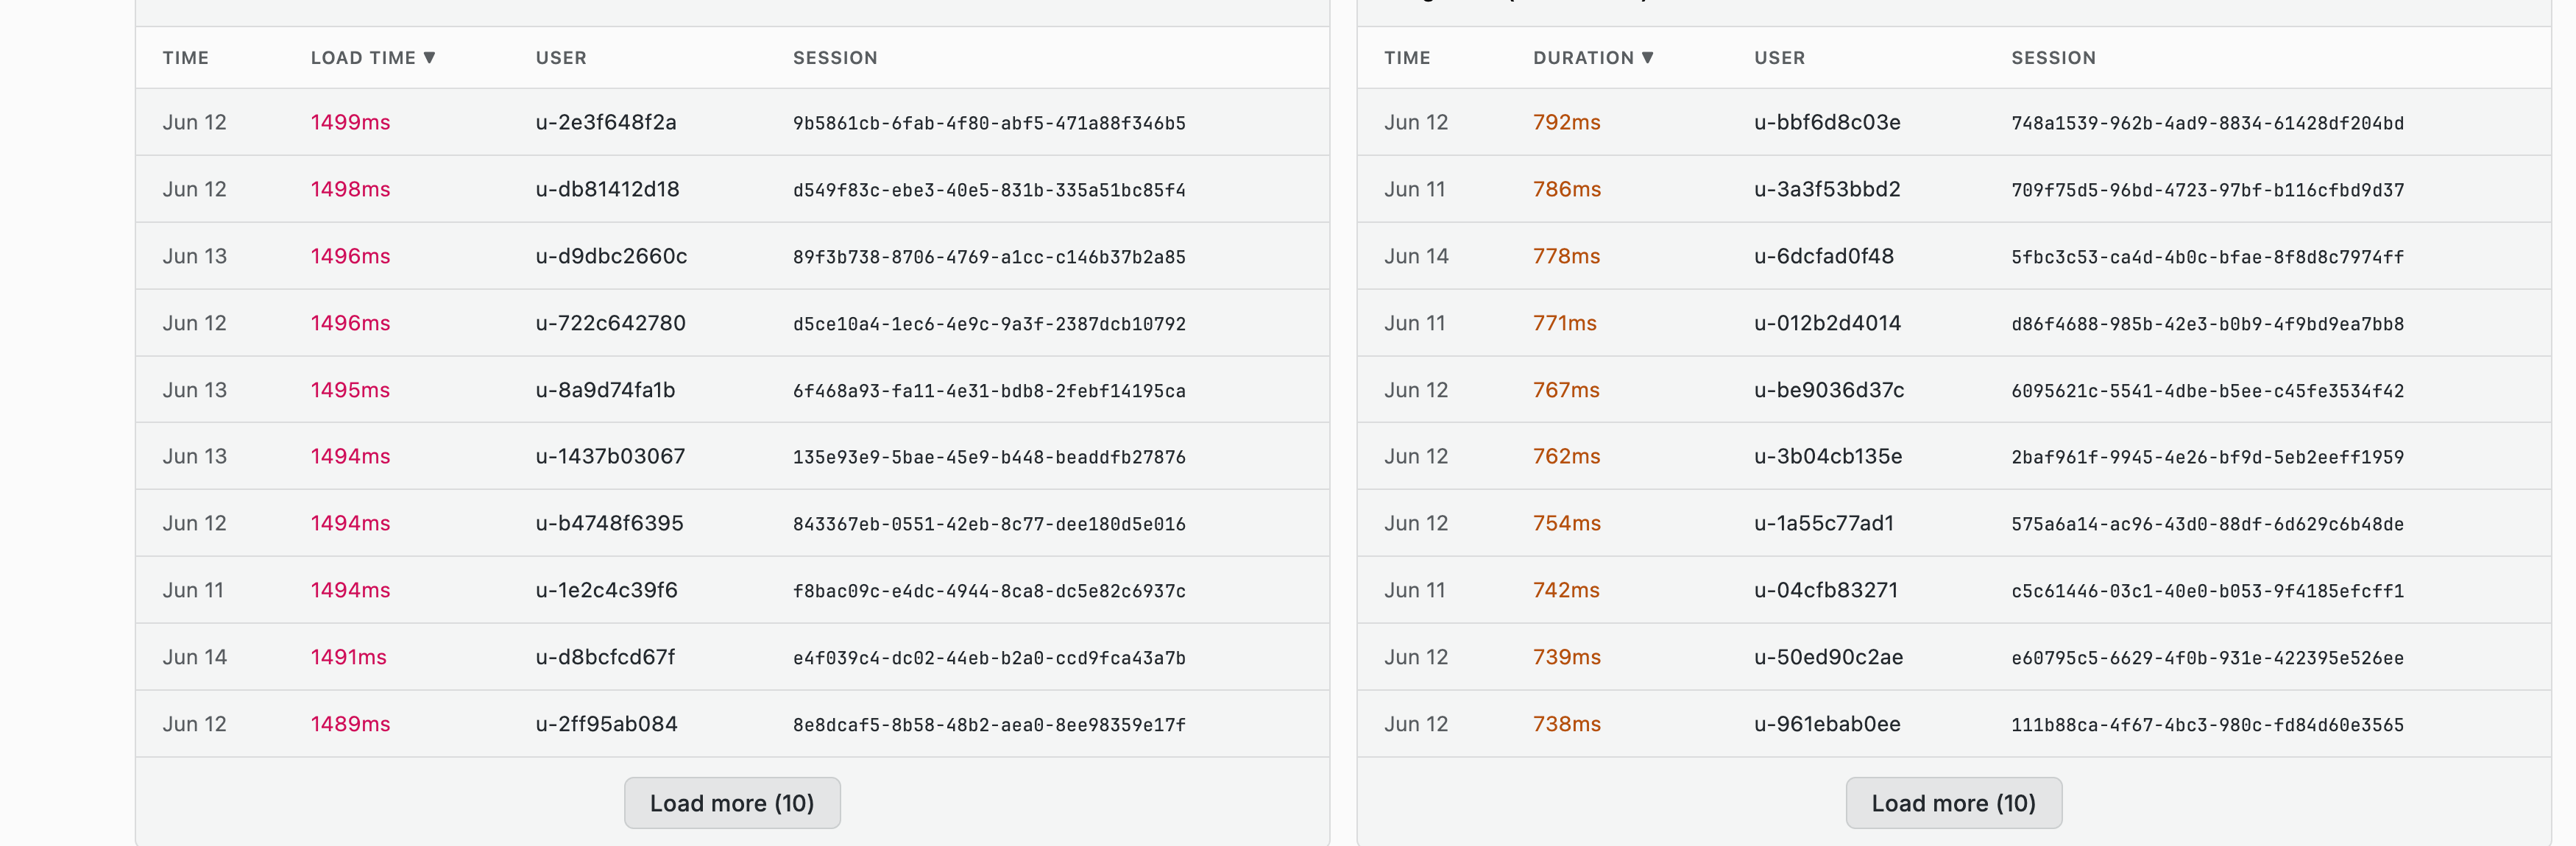
- Slowest Loads (mobile) - table of individual slow screen loads (Time, Load Time, User, Session)
- Slowest LCP (web) - table of the slowest individual page loads by LCP, with the LCP broken into Delay / Load / Render (resource load delay, resource load time, render delay, in ms) and the Element resource that was the largest paint. A large delay points at the server or at late-discovered resources, a large load time at the resource itself, and a large render delay at blocking scripts or styles. When the app is configured for FCP this is Slowest FCP, without the breakdown
- Long Tasks (Jank Events) - table of individual long tasks (Time, Duration, User, Session)
Both tables link straight to the User and Session involved, and support Load more to page through additional rows.
Crashes on this Screen

A table of crashes attributed to this screen (Time, Error Type, Message, Session), or "No crashes on this screen" when there are none in range.
Use Cases
Finding the Slowest Screen
- Check the Slowest Screen stat tile, or sort the Screen List by LCP p75 (web) or Load Time p95 (mobile)
- Open the screen and check LCP Trend / Load Time Trend for a gradual regression vs. a one-time spike
- Cross-check Slowest LCP / Slowest Loads for the specific sessions affected. On the web, the Delay / Load / Render split and the element URL show where the time went
Diagnosing Jank on a Screen
- Check the Most Janky stat tile, or sort by Long Tasks
- Open the screen and compare Frame Build Time vs. Frame Raster Time to narrow down whether it's widget/layout work or GPU work
- Check Long Tasks (Jank Events) for the specific sessions and times
FAQ
What is the difference between frame build time and frame raster time?
Build time is how long the widget and layout work took, and raster time is how long the GPU took to draw the result. Sustained spikes in either show up as jank, but they point at different fixes: build time at your widget tree, raster time at what you are asking the GPU to draw.
What is a long task?
A long task is a long-running piece of work on the UI thread, which is the usual mechanical cause of jank. The Long Tasks (Jank Events) table lists individual occurrences with the user and session involved, so you can open the exact session and see what ran.
p50 looks fine but p95 is bad. Where do I look?
Open the screen and read Slowest Loads (or Slowest LCP on a web app), which lists individual slow loads with their time, duration, user, and session. A healthy median with a bad tail usually means a subset of devices, networks, or accounts, and the session links are how you find which.
Why is Route Transition so much lower than LCP on my web app?
They measure different things. Route Transition is the time from a client-side route change until the next frames render, usually a few milliseconds. LCP measures a full page load, from navigation until the largest element is painted, so it includes the network and rendering. Use LCP to judge how fast pages load, and Route Transition to spot client-side navigation that has become sluggish.
Related Guides
- Getting Started - Interface layout and shared filters
- Overview - Top Crashing Screens and Slowest Screens at a glance
- ANR - Frozen-UI events grouped by screen
- Sessions - Full session timeline for a specific view