RUM Users
The Users tab lists identified users and their activity, so you can start from a known user (a support ticket, an account ID) and drill into exactly what they experienced.
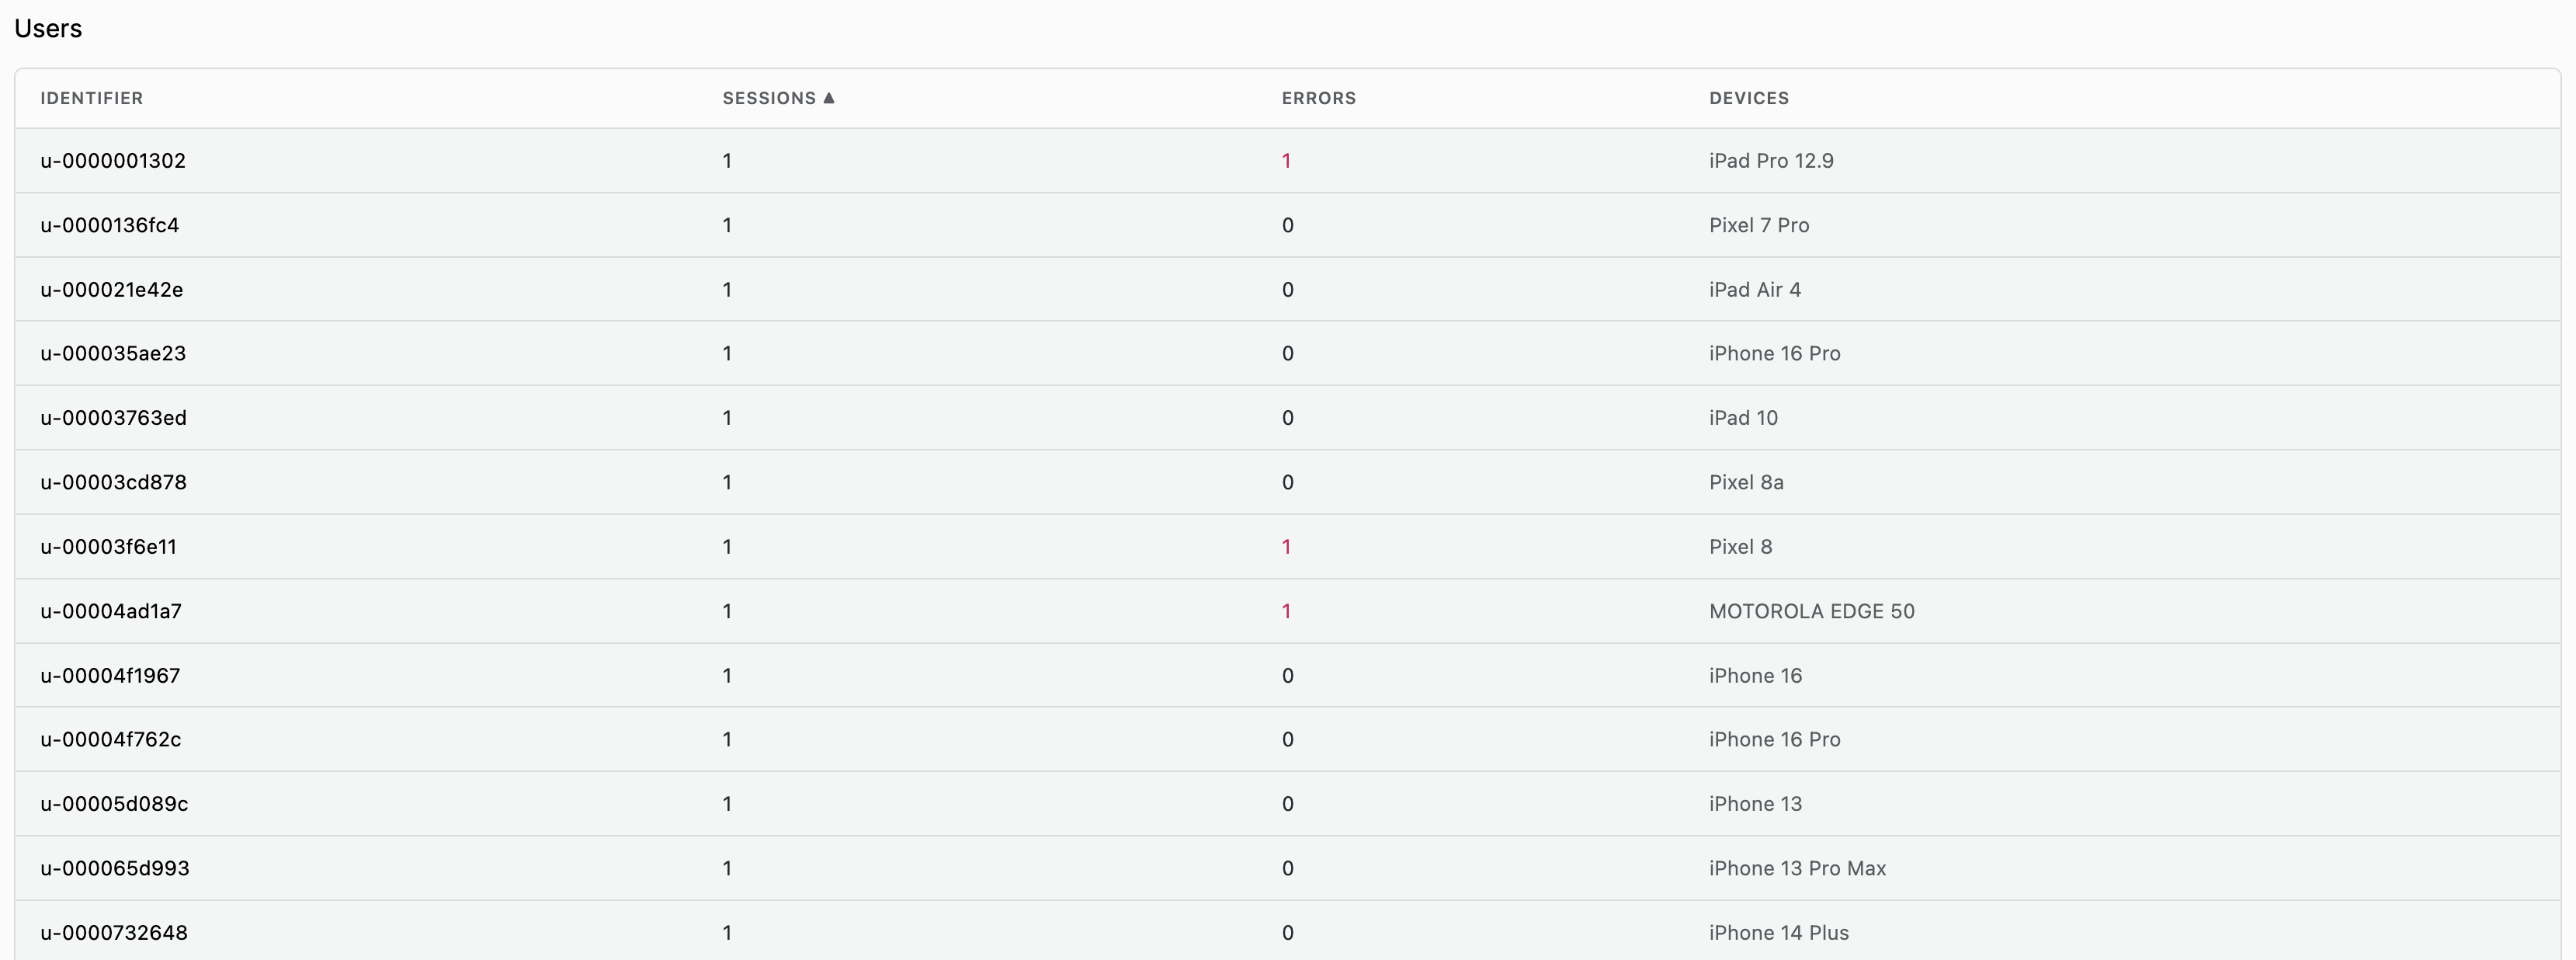
User List
Table Columns
| Column | Description |
|---|---|
| Identifier | The user's identifier |
| Sessions | Number of sessions in the range |
| Errors | Non-fatal errors across all their sessions |
| Devices | Device model(s) they used |
Users with a non-zero error count are highlighted so you can spot who is hitting problems.
The shared Filters sidebar applies here, with
a richer set of User attributes than elsewhere: user.id,
user.anonymous_id, user.email, user.name, user.phone, user.plan,
user.session_seq, and user.tenant.
User Details
Select a user to open their detail view, which brings together everything that user has done in the app.

The header identifies the user and the Devices, OS, and App Versions they used, followed by Crashes, Errors, UI Freezes, and Sessions stat cards summarizing their experience. UI Freezes counts the same frozen-UI events the ANR tab groups, so a high count there is worth following up on.
Screen Performance
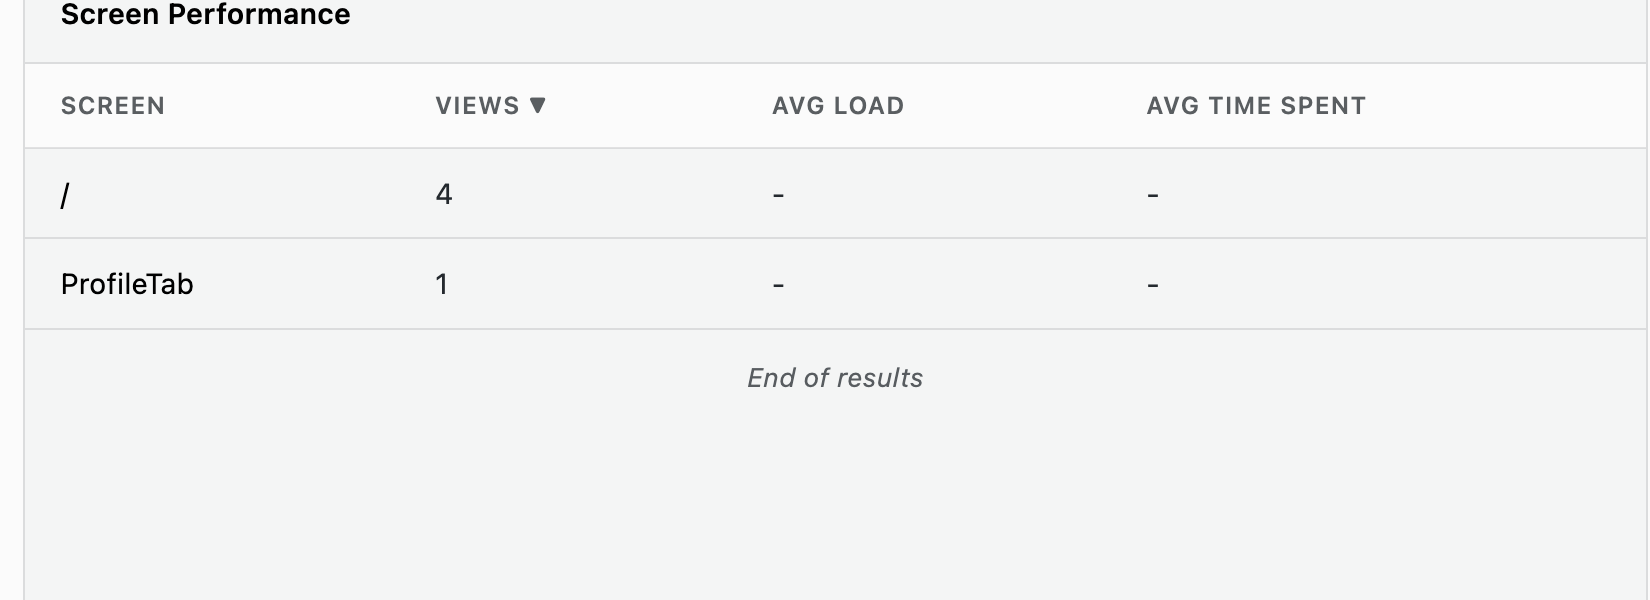
Per-screen Views, Avg Load, and Avg Time Spent for this user, so you can see which screens are slow or failing for them specifically - useful for confirming whether a reported issue is app-wide or unique to this user's device or usage pattern.
Session History
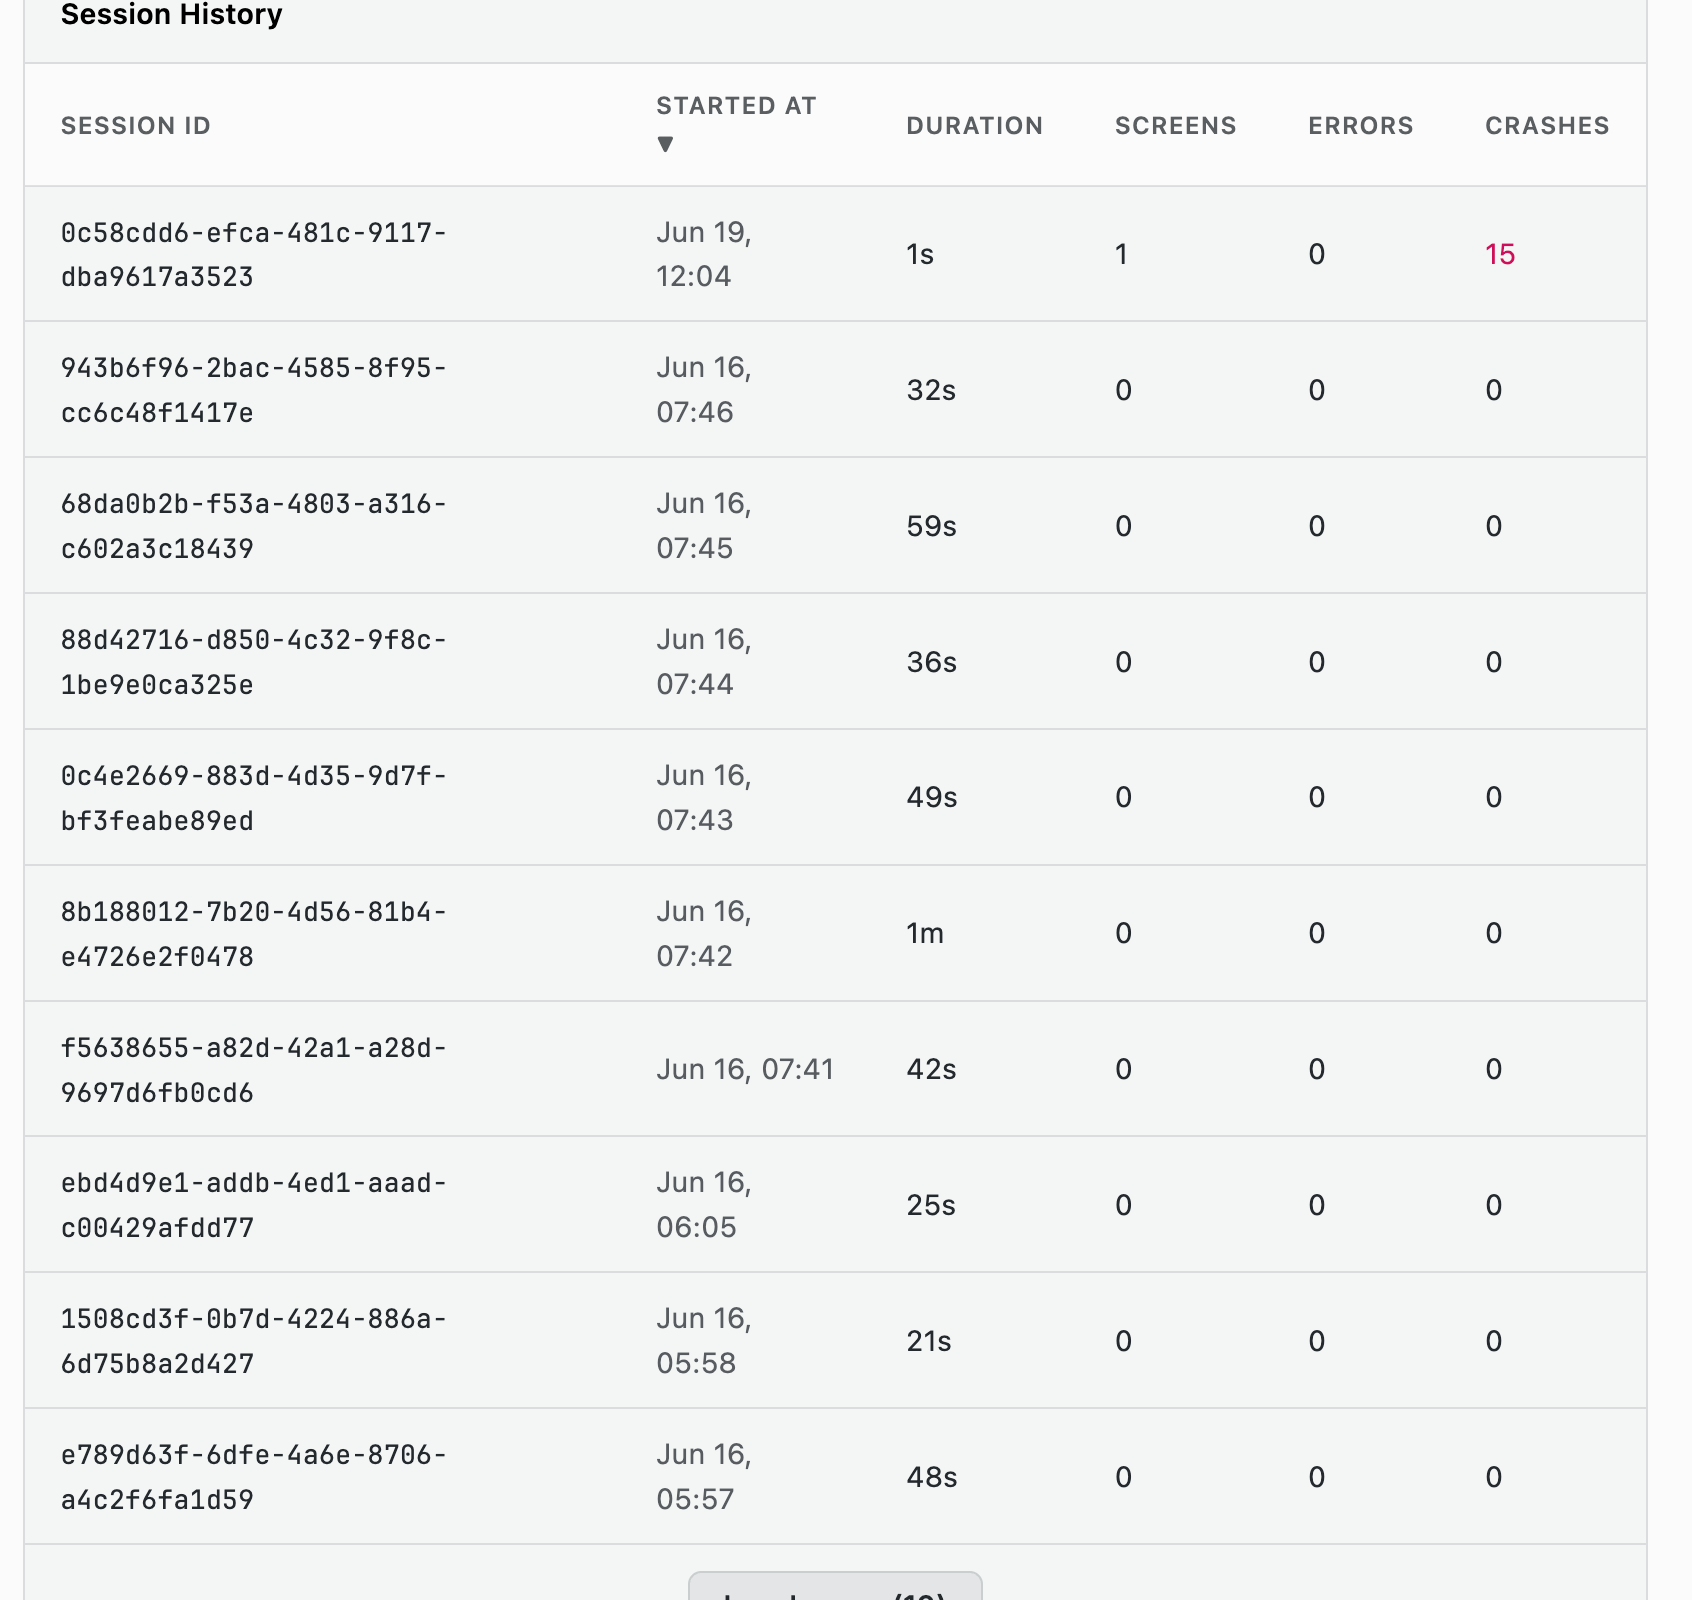
The user's sessions with Session ID, Started At, Duration, Screens, Errors, and Crashes, each linking through to its full session timeline. Sessions with crashes are highlighted, and Load more pages through additional sessions.
Use Cases
Investigating a Support Ticket
- Search for the user's identifier in the User List
- Check the Crashes/Errors/UI Freezes stat cards for a quick read on whether they're having a bad time generally
- Open Session History and jump into the session around when they reported the issue
Checking if an Issue Is User-Specific
- Open the affected user's detail view
- Compare their Screen Performance numbers against the app-wide numbers on Screens for the same screen
- A large gap points at something specific to this user's device, network, or account state rather than a general regression
FAQ
Why do most of my users not appear in the Users tab?
The SDK does not capture user identity by default. A user appears here only
once your app sets attributes such as user.id or user.email, so an app that
never identifies its users will show little on this tab.
What does the UI Freezes stat card count?
It counts the same frozen-UI events the ANR tab groups, scoped to this user. A high count for one user alongside normal app-wide numbers points at their device or network rather than a general regression.
How do I tell whether a reported problem is specific to one user?
Compare that user's Screen Performance numbers against the app-wide numbers for the same screen on Screens. A large gap points at something local to them; matching numbers mean you are looking at an app-wide issue.
Related Guides
- Getting Started - Interface layout and shared filters
- Sessions - Full session timeline and event details
- Crashes - Crash groups, filterable by affected user
- ANR - Frozen-UI events behind the UI Freezes count
- traceX - Distributed tracing explorer
- logX - Log explorer with trace correlation
- Instrument a Flutter app