RUM Crashes
The Crashes tab groups individual crash events into deduplicated crash groups so you can prioritize by impact instead of triaging one crash at a time.
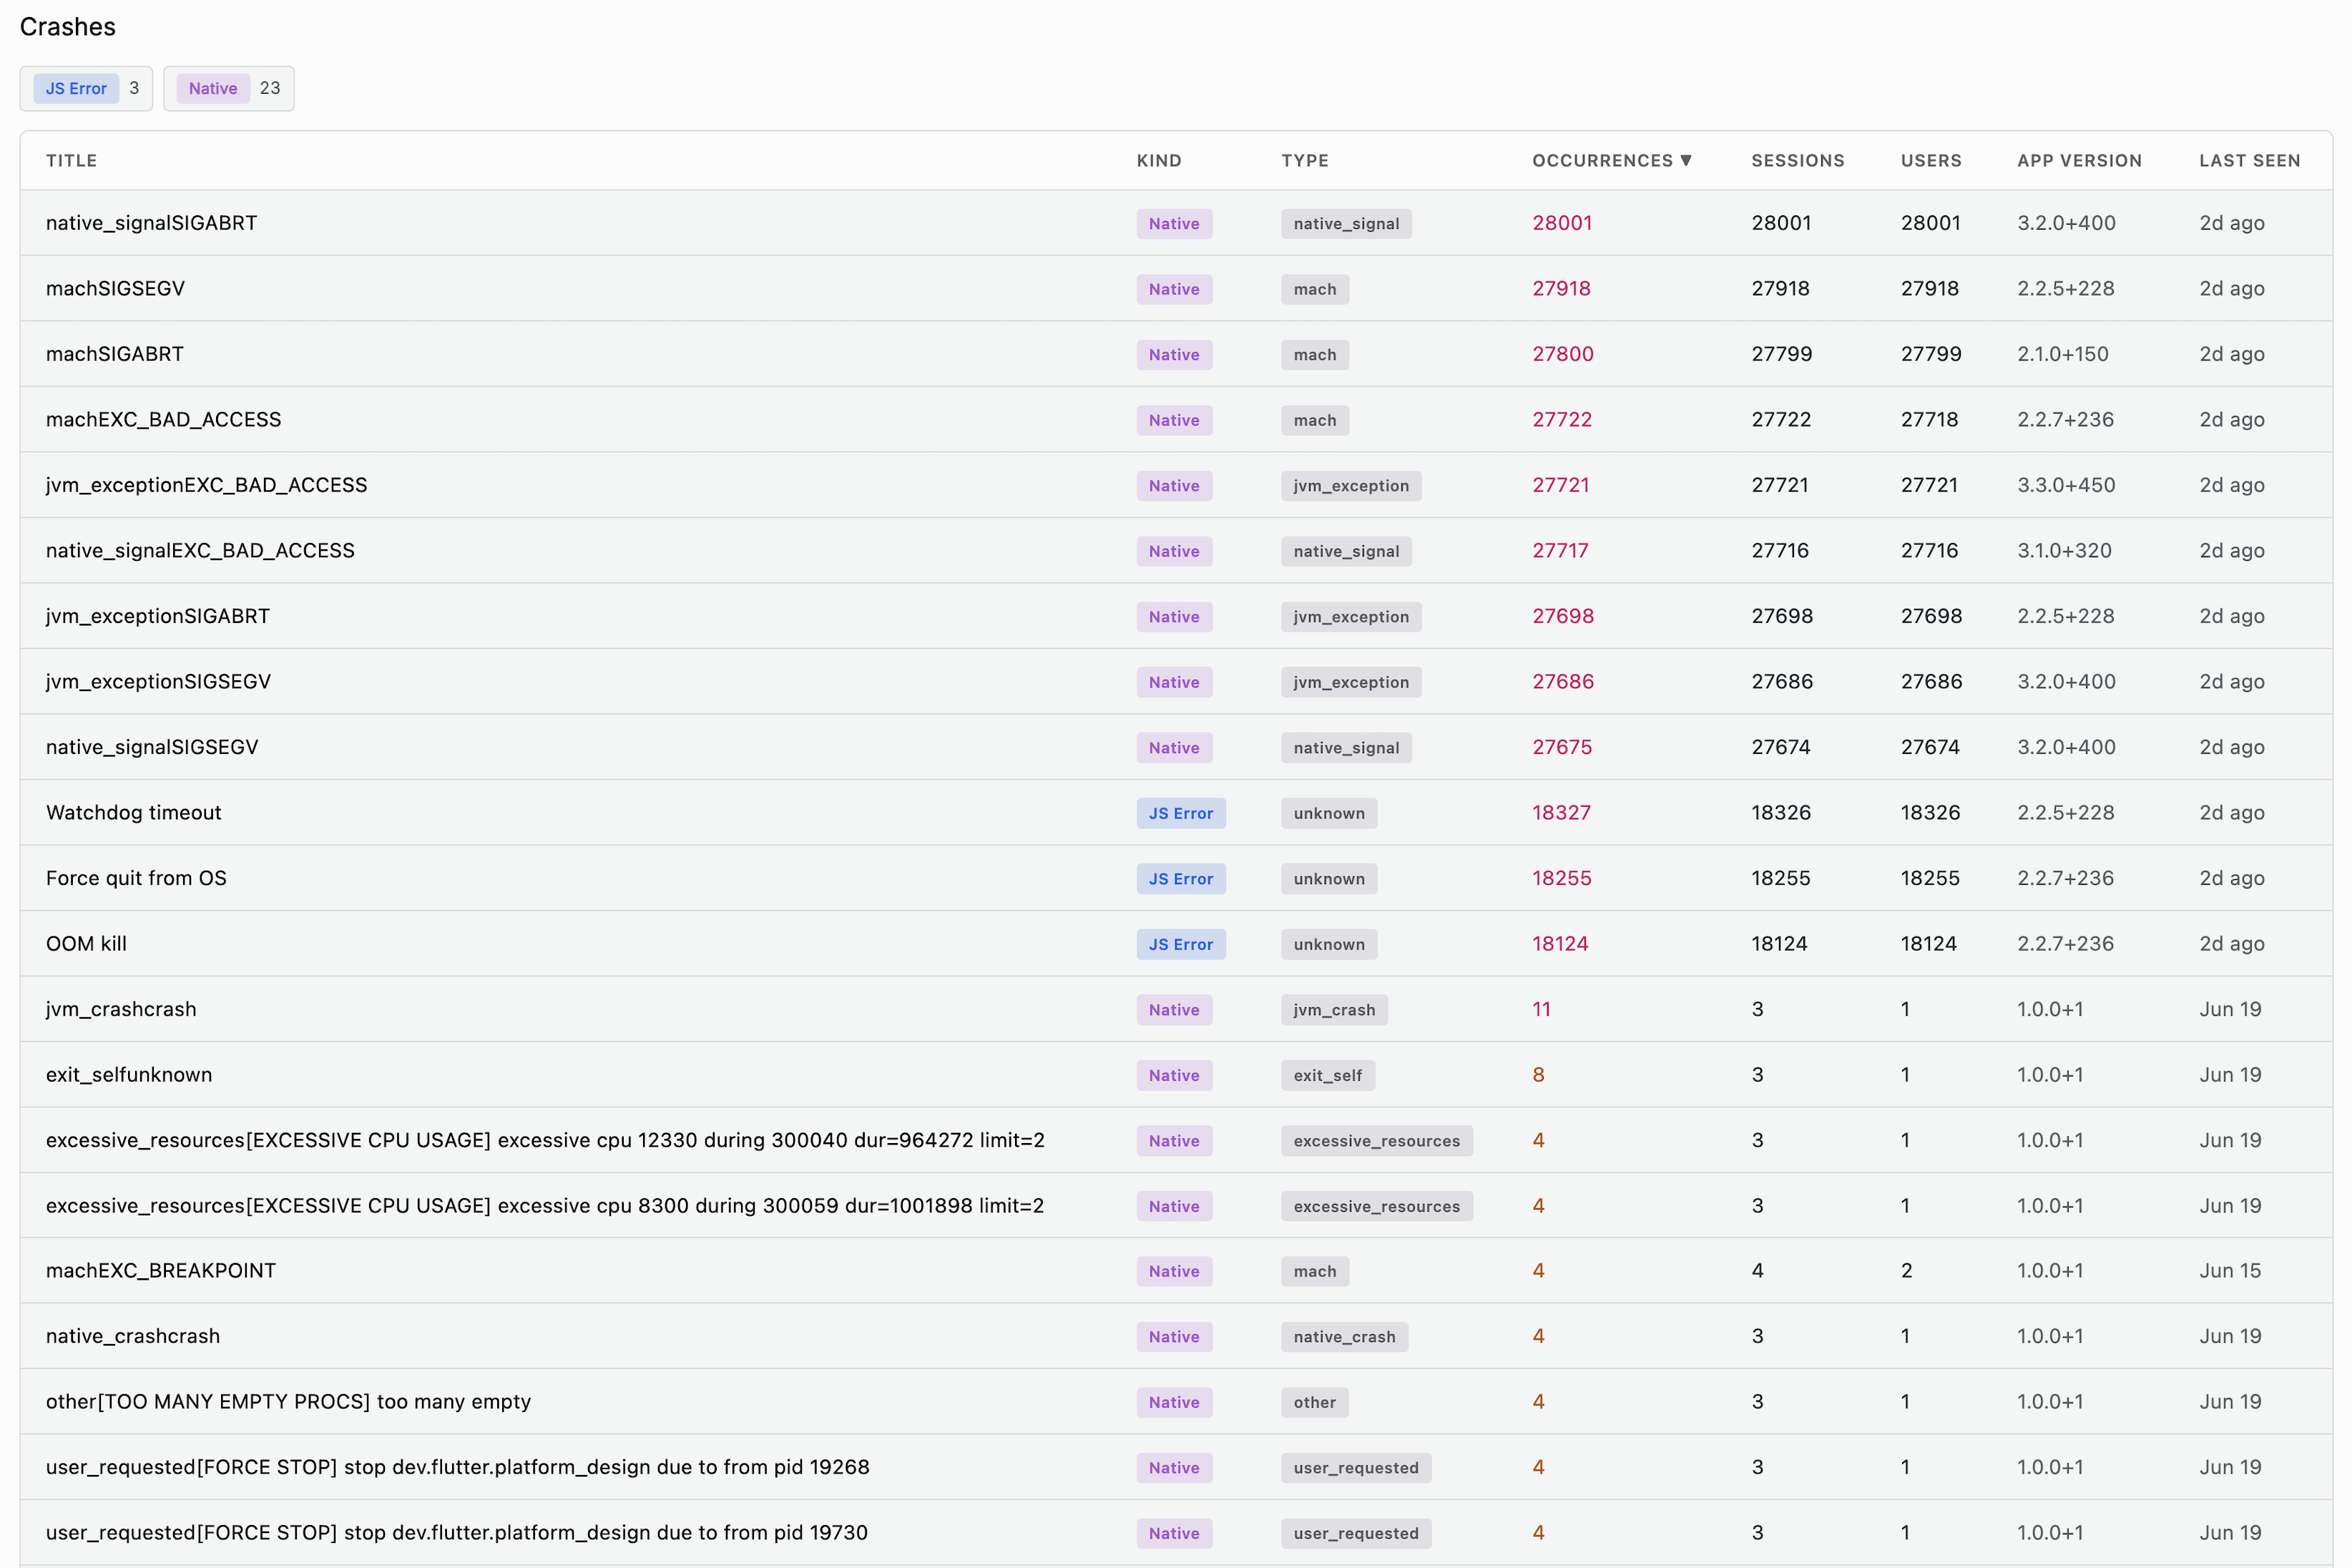
Crash List
Filter chips at the top let you toggle between crash Kind values; the table below lists every crash group ranked by occurrence.
Table Columns
| Column | Description |
|---|---|
| Title | The crash's grouping title (exception name or synthetic label) |
| Kind | High-level classification badge, either Native or JS Error |
| Type | More specific classification, for example native_signal, mach, jvm_exception, jvm_crash, exit_self, excessive_resources, user_requested, unknown |
| Occurrences | Total times this crash group has been seen |
| Sessions | Number of distinct sessions affected |
| Users | Number of distinct users affected |
| App Version | Version most recently associated with the group |
| Last Seen | When the crash group was last observed |
Sort by Occurrences to prioritize the crashes affecting the most sessions first.
Native is a crash the platform reported; JS Error is anything above the
platform layer, which on Flutter means Dart and app-level crashes. The badge
name is shared across RUM platforms - no JavaScript is involved.
Crash Details
Click a crash group to open the detail view, scoped to a specific occurrence (pick a different occurrence from the dropdown at the top).
Summary Stats
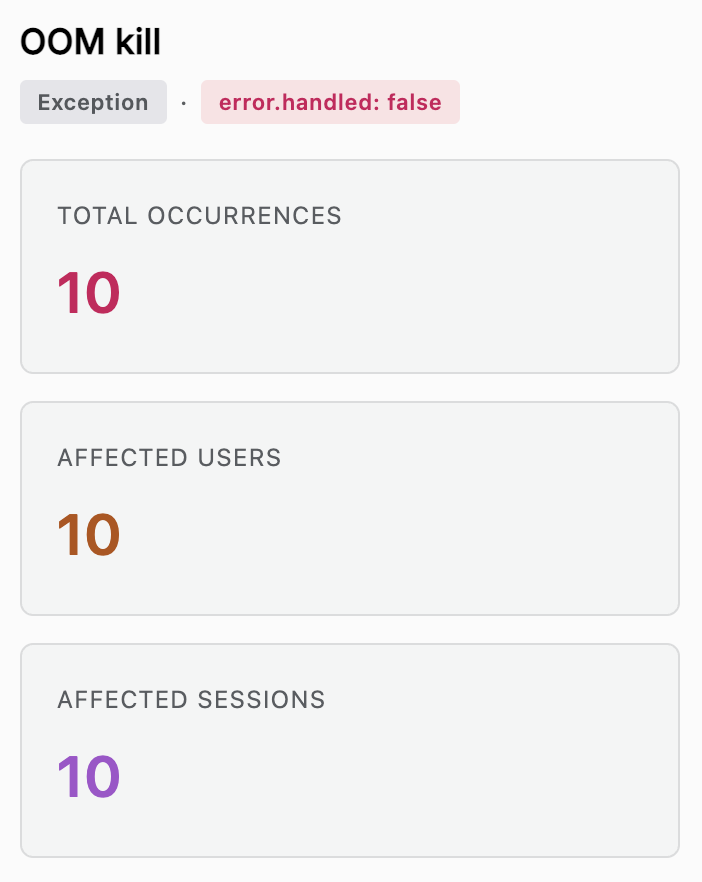
Total Occurrences, Affected Users, and Affected Sessions for the selected crash group and time range.
Occurrence Breakdown
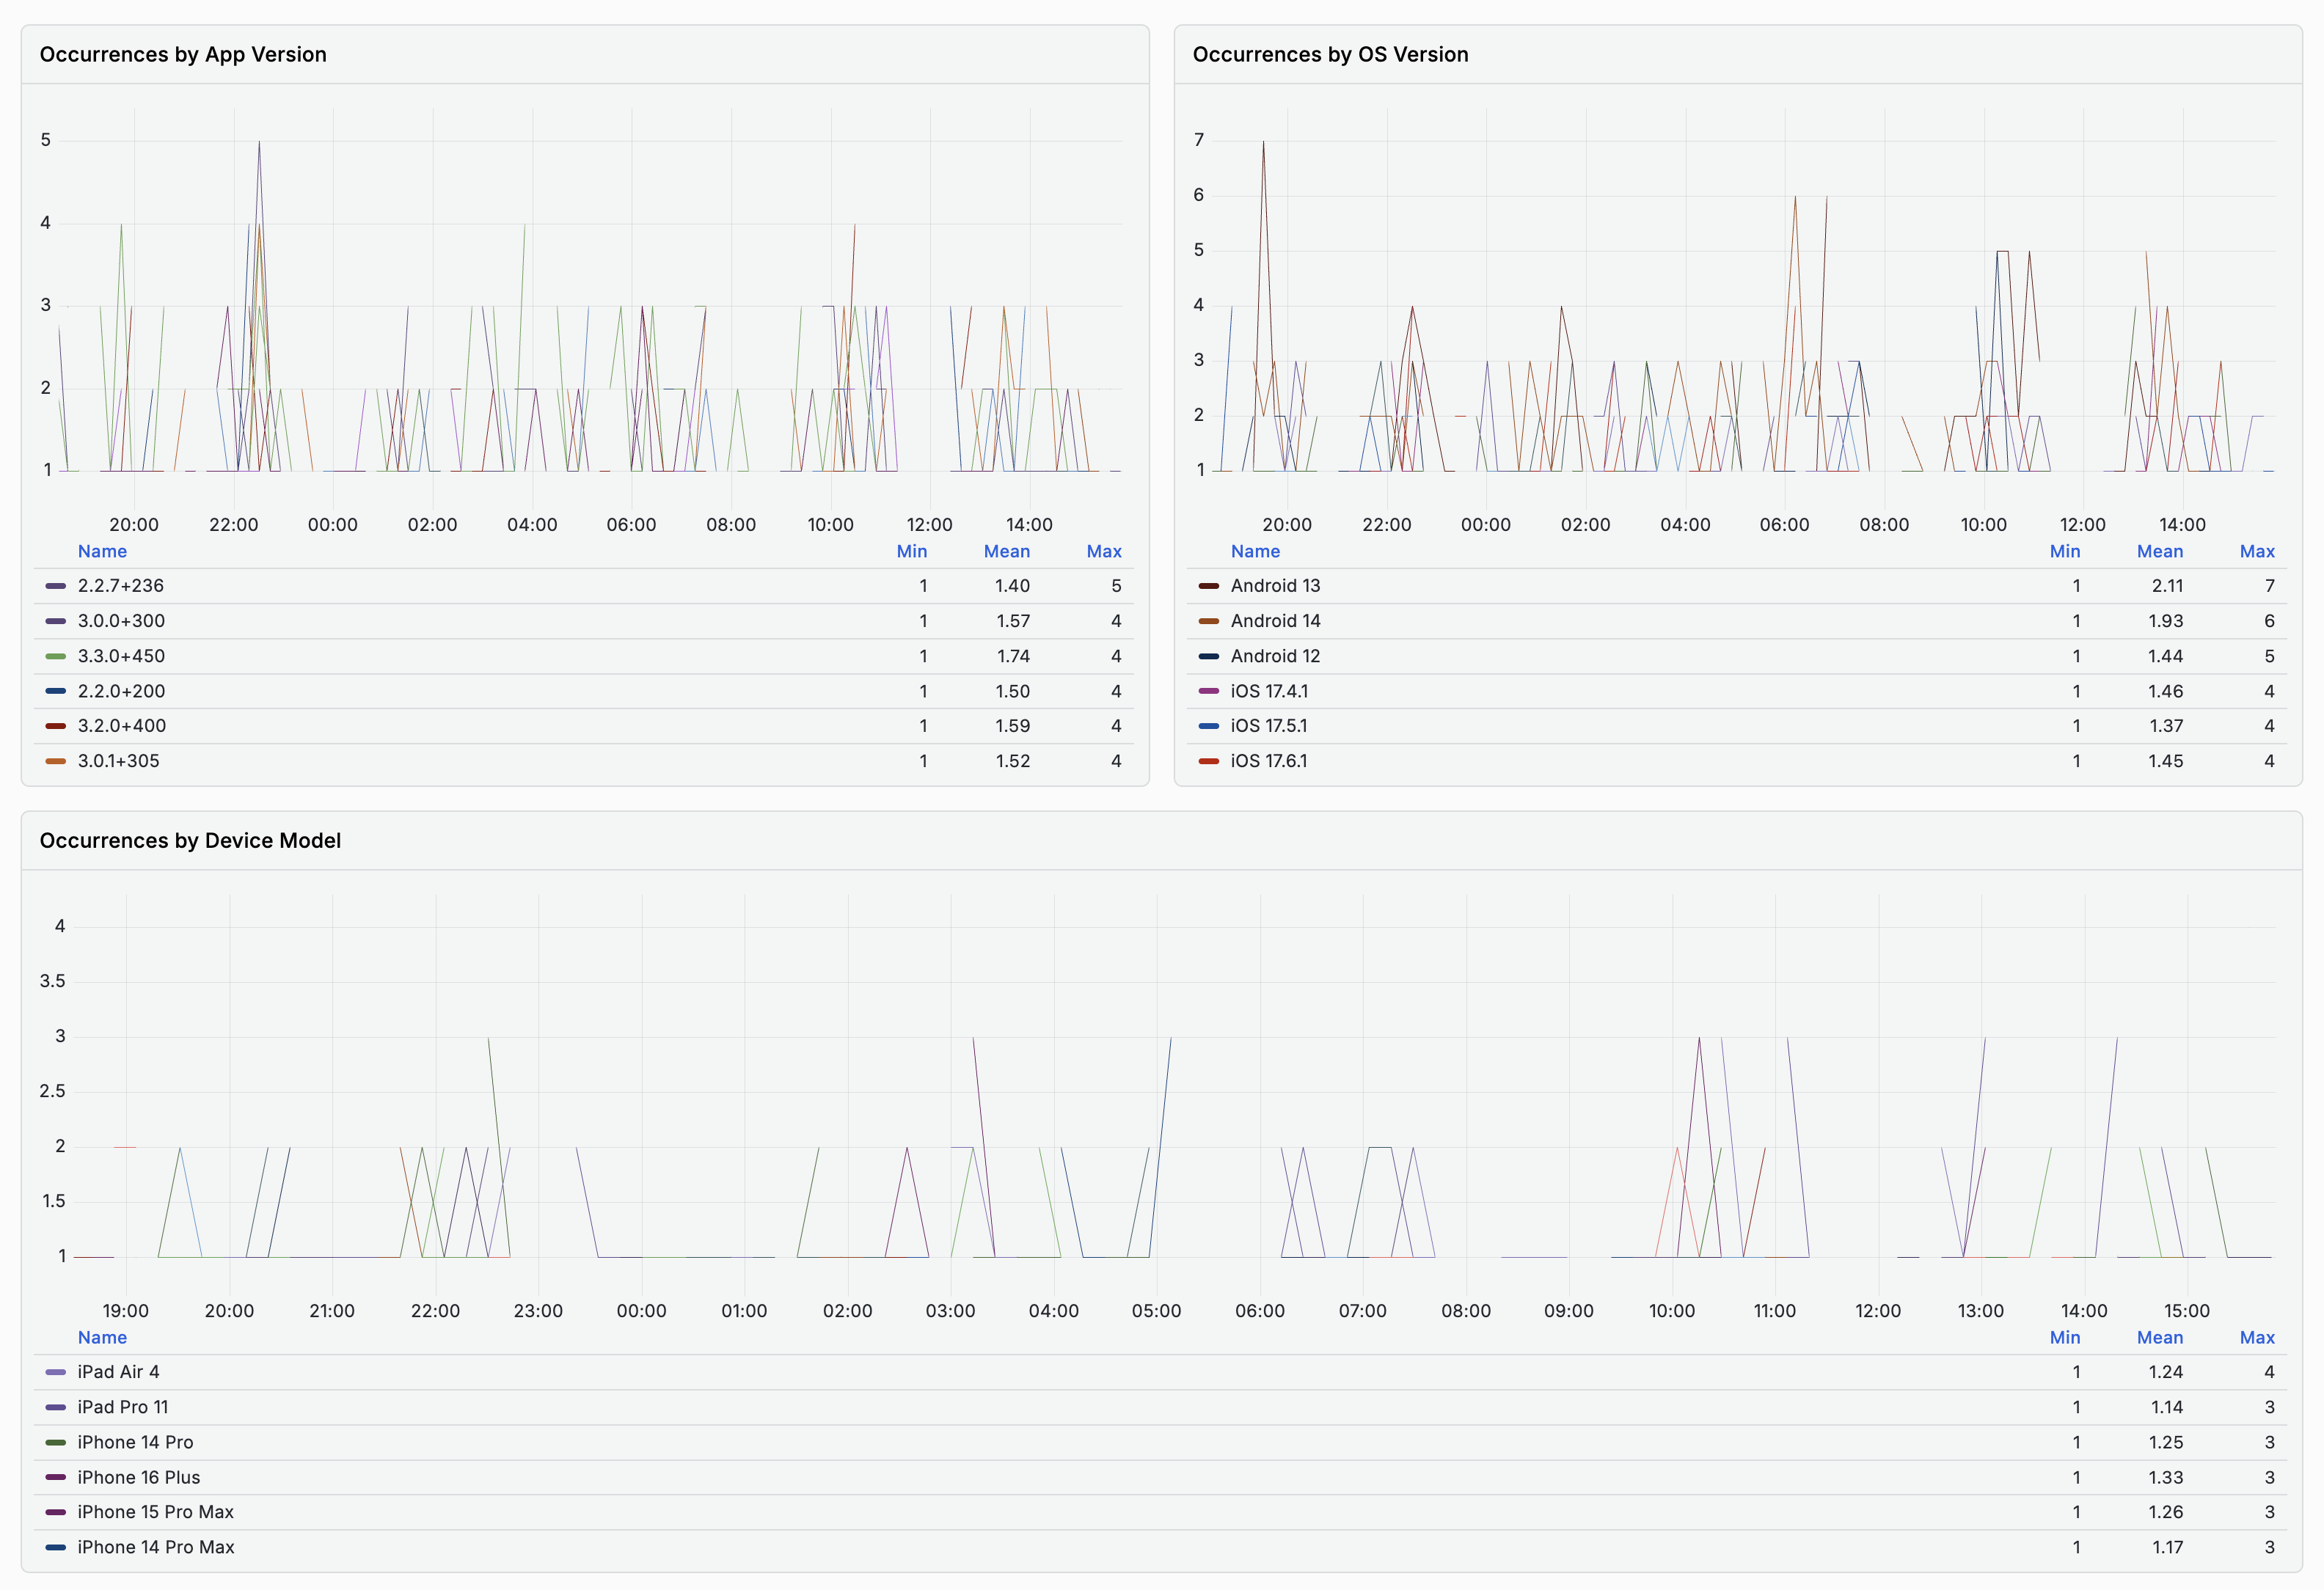
Three charts pair a multi-line time series with a Name / Min / Mean / Max table, showing how many occurrences hit each App Version, OS Version, and Device Model:
- Occurrences by App Version
- Occurrences by OS Version
- Occurrences by Device Model
Attributes
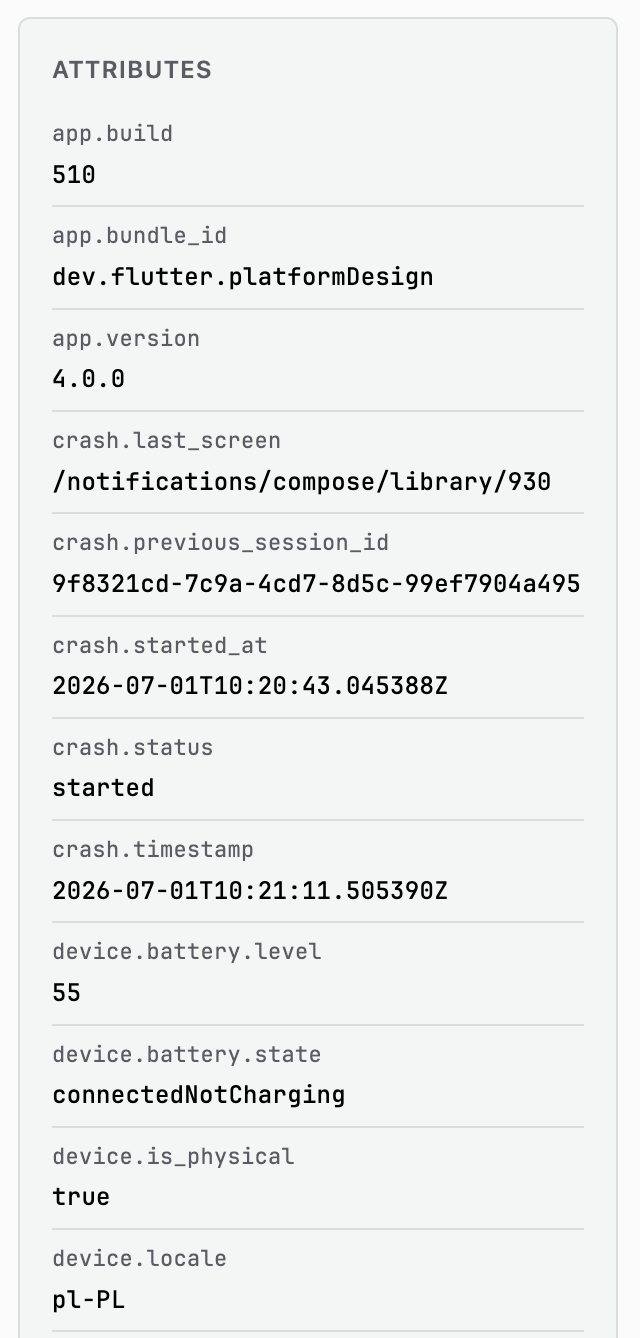
A scrollable panel with the full attribute set captured at crash time. A
small app.* group sits above a single large crash.* block - the raw
crash report, flattened - followed by the same resource attributes you see
on other detail pages:
| Group | Example attributes |
|---|---|
app.* | app.build, app.bundle_id, app.launch_id, app.version |
crash.* (app state) | crash.app_id, crash.app_version, crash.app_in_foreground, crash.app_start_time, crash.app_sessions_since_launch |
crash.* (binary/build) | crash.binary_cpu_type, crash.build_configuration, crash.build_type |
crash.* (process/report) | crash.pid, crash.parent_pid, crash.process_name, crash.report_id, crash.report_type |
crash.* (signal/memory/threads) | crash.signal, crash.signal_code, crash.memory_usable_bytes, crash.thread_count |
crash.* (type/timing) | crash.type, crash.timestamp, crash.time_zone, crash.translated |
device.* | device.model.name, device.locale, device.timezone, device.is_physical |
host.* | host.arch, host.name, host.os.name, host.processors |
os.* | os.name, os.version, os.build, os.type |
process.* | process.executable.name, process.num_threads, process.runtime.name, process.runtime.version |
service.* / session.* | service.name, service.version, session.id, session.start_time |
Use Search attributes in the sidebar to jump straight to a specific key instead of scrolling.
Stack Trace and Translated Report
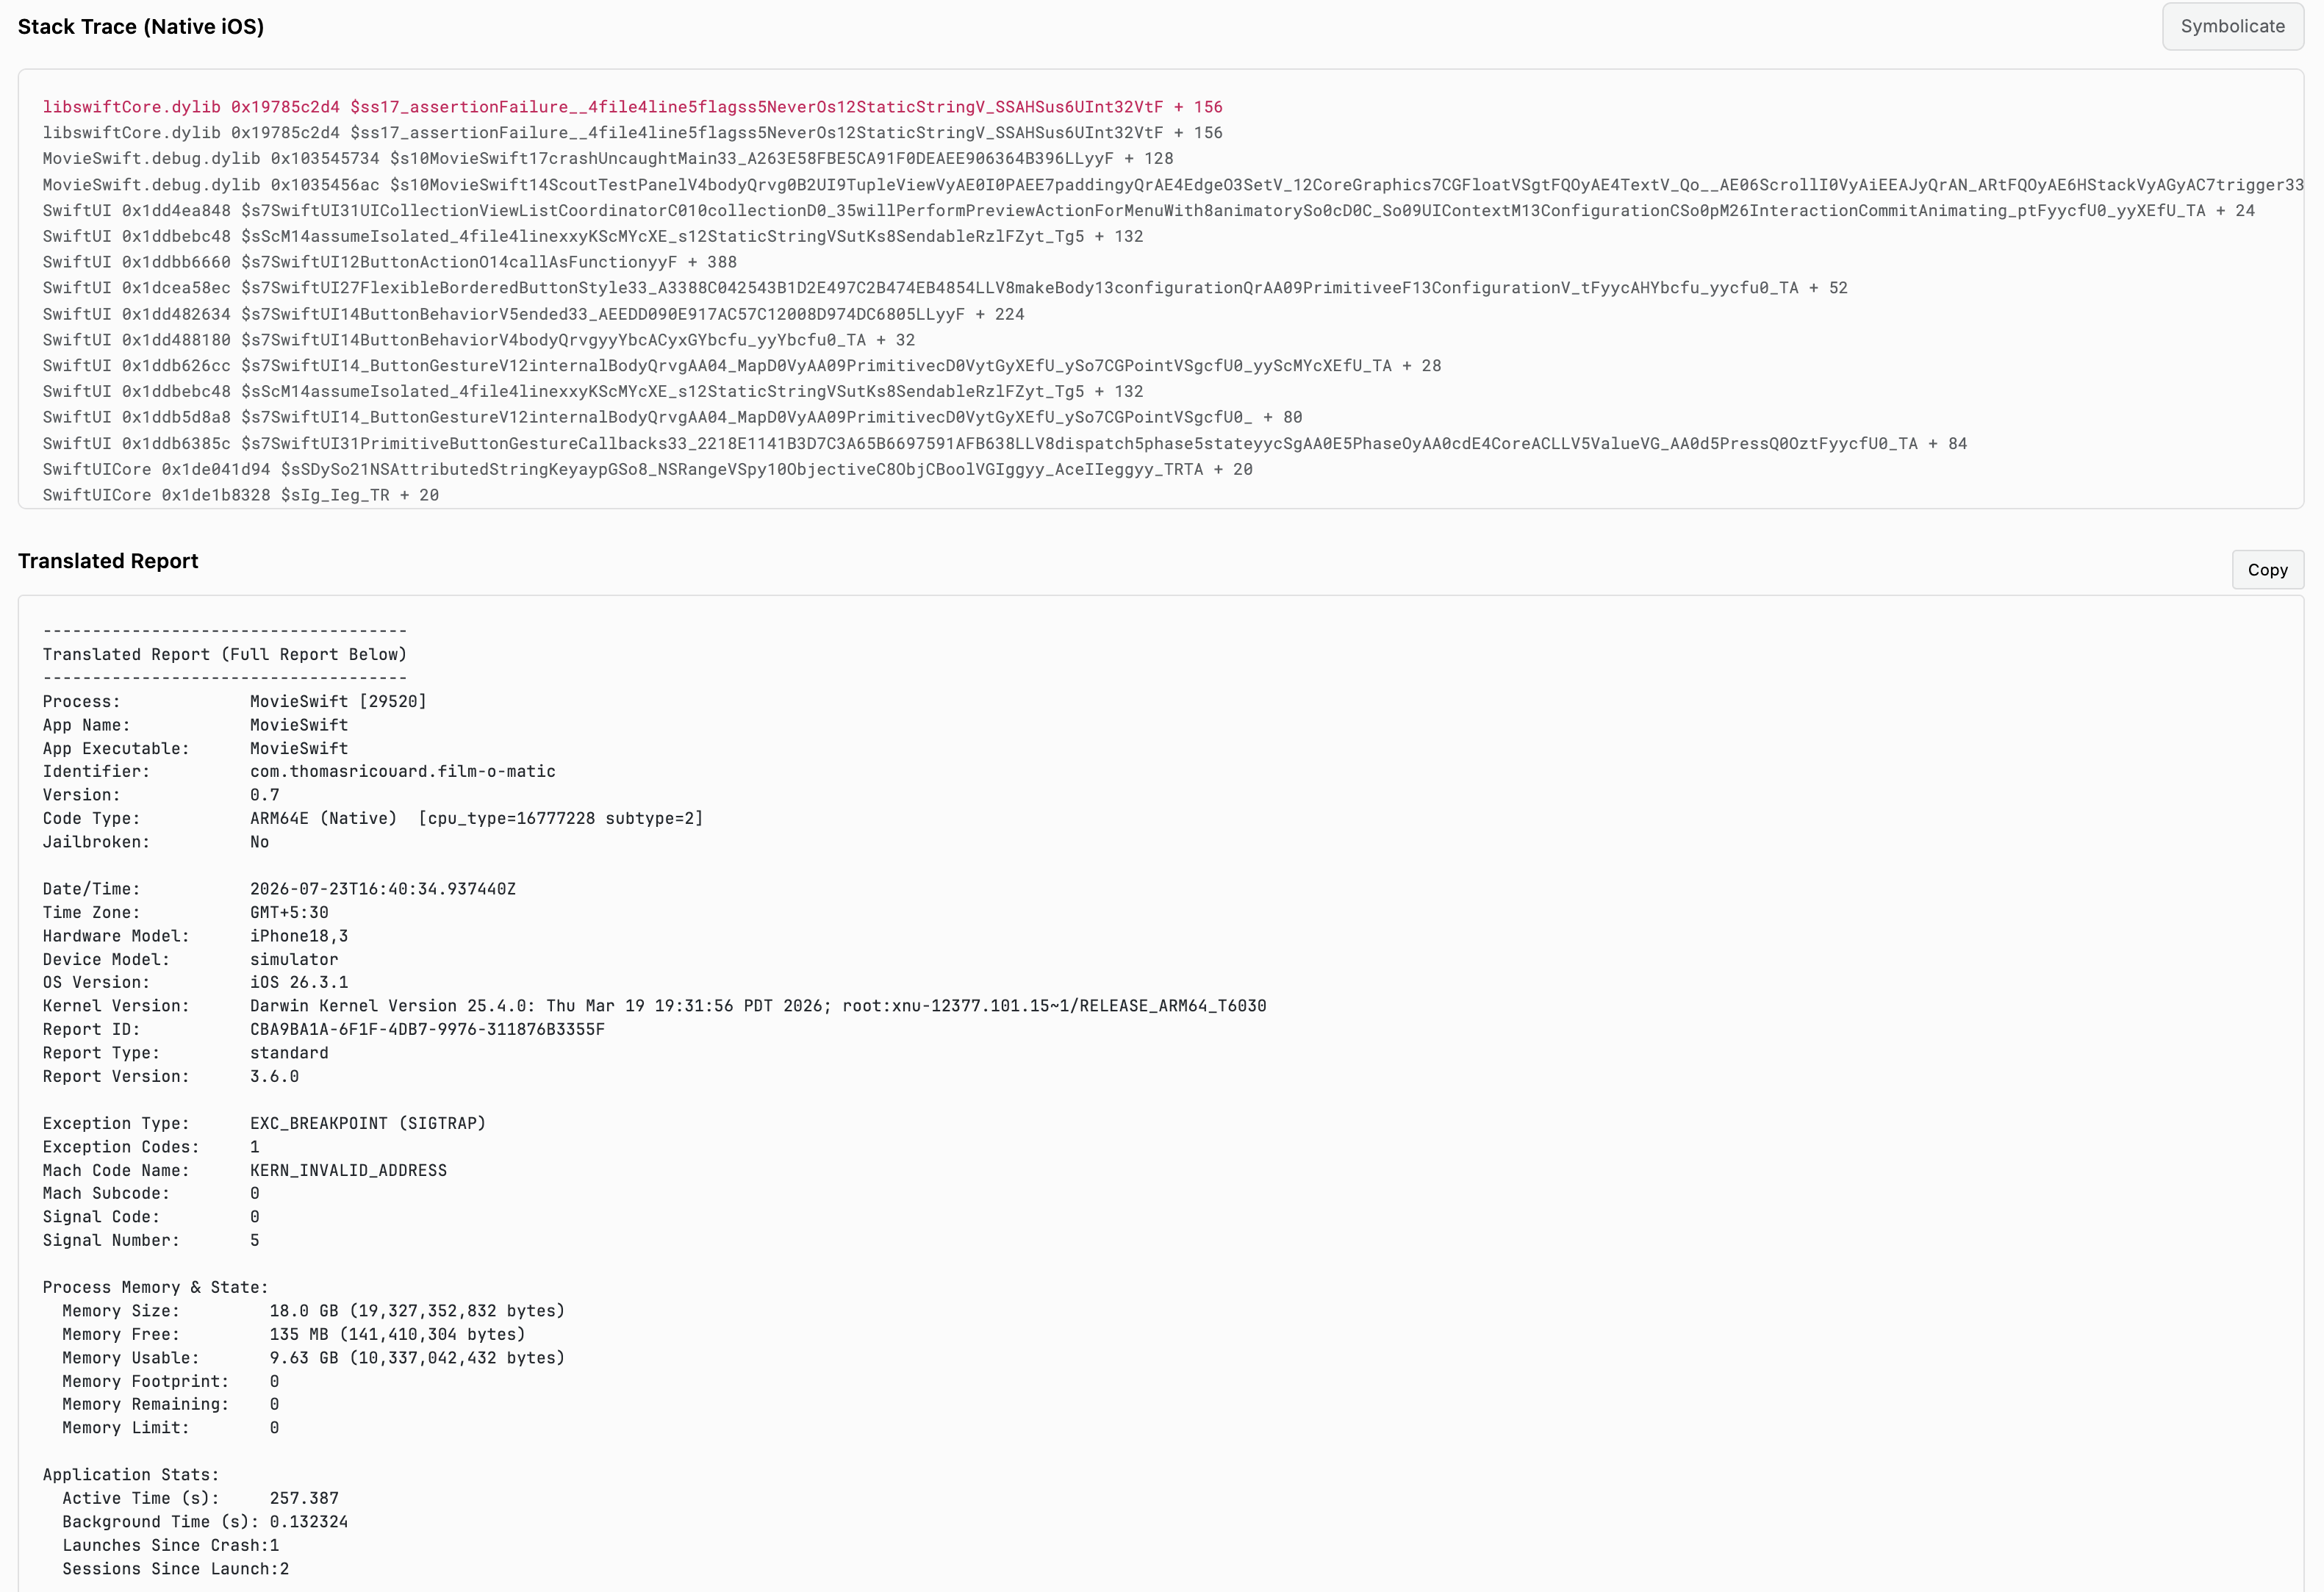
The Stack Trace (Native) panel shows the raw symbolicated frames. Below it, Translated Report renders the full platform crash report (process info, exception type and codes, thread and register state, binary images) as plain text, with a Copy button so you can paste it straight into an issue tracker or share it with a native engineer.
Frames only resolve to readable file, line, and symbol names once you've uploaded the matching debug artifacts for that build (dSYM, Dart symbols, NDK symbols, ProGuard mappings) - see scout artifacts upload. Without an uploaded artifact, frames show raw addresses or obfuscated names instead.
Breadcrumbs

A chronological table (Time, Type, Message) of what the user was doing right before the crash: session start, screen navigation, taps, long tasks, and UI hangs. Use it to reproduce the exact sequence that triggered the crash.
Affected Devices and Affected Users
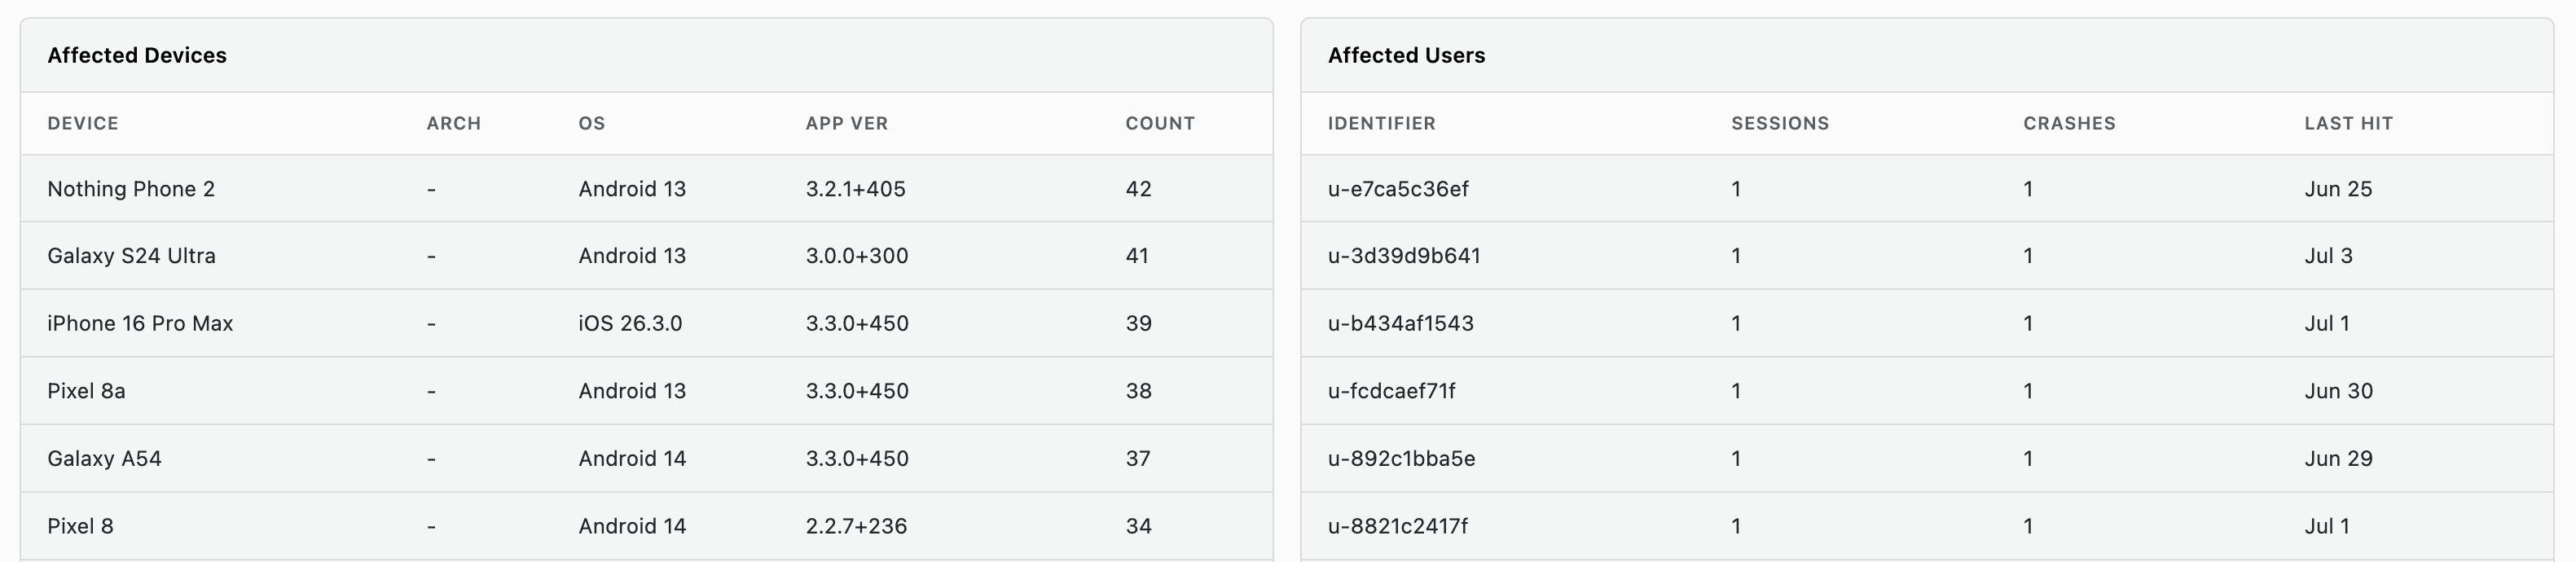
- Affected Devices - device model, architecture, OS, app version, and occurrence count
- Affected Users - user identifier, session count, crash count, and last hit
Use View Session Timeline to jump from a specific occurrence into the full session where it happened.
Use Cases
Triaging After a Release
- Filter by the new App Version
- Sort the Crash List by Occurrences
- Open the top crash group and check Occurrences by App Version to confirm it's new (or worse) in this release
- Use the Translated Report and Breadcrumbs to hand a native engineer a reproducible sequence
Verifying a Fix
- Open the crash group you fixed
- Filter to the version containing the fix
- Confirm Occurrences by App Version shows zero (or near-zero) for that version
Scoping a Device-Specific Crash
- Sort the Crash List by Occurrences
- Open a crash group and check Occurrences by Device Model - a spike concentrated on one model points at a device-specific bug (memory limits, OS fork behavior)
FAQ
Why do crash frames show raw addresses instead of file names?
Frames resolve to readable file, line, and symbol names only when the matching debug artifacts for that exact build have been uploaded: dSYMs, Dart symbols, NDK symbols, or ProGuard mappings. Upload them with scout artifacts upload. Without them the frames stay as addresses or obfuscated names.
What is the difference between Kind and Type on a crash?
Kind is the high-level badge: Native for a crash the platform reported,
and JS Error for everything above the platform layer, such as Dart and
app-level crashes on Flutter. Type is the specific classification
underneath it, which is what to read when you want to know what actually
failed.
What are breadcrumbs for?
Breadcrumbs are the chronological trail of what the user did just before the crash: session start, screen navigation, taps, long tasks, and UI hangs. They are the fastest way to reproduce the sequence that triggered it.
Related Guides
- Getting Started - Interface layout and shared filters
- Overview - Crash trends alongside sessions and ANR
- Errors - Non-fatal errors, for issues that don't crash the app
- Sessions - Full session timeline for a specific occurrence
- traceX - Distributed tracing explorer
- logX - Log explorer with trace correlation