RUM ANR
The ANR (Application Not Responding) tab tracks frozen-UI events - periods where the app's main thread was blocked and unresponsive to user input - grouped by the screen where they occurred.
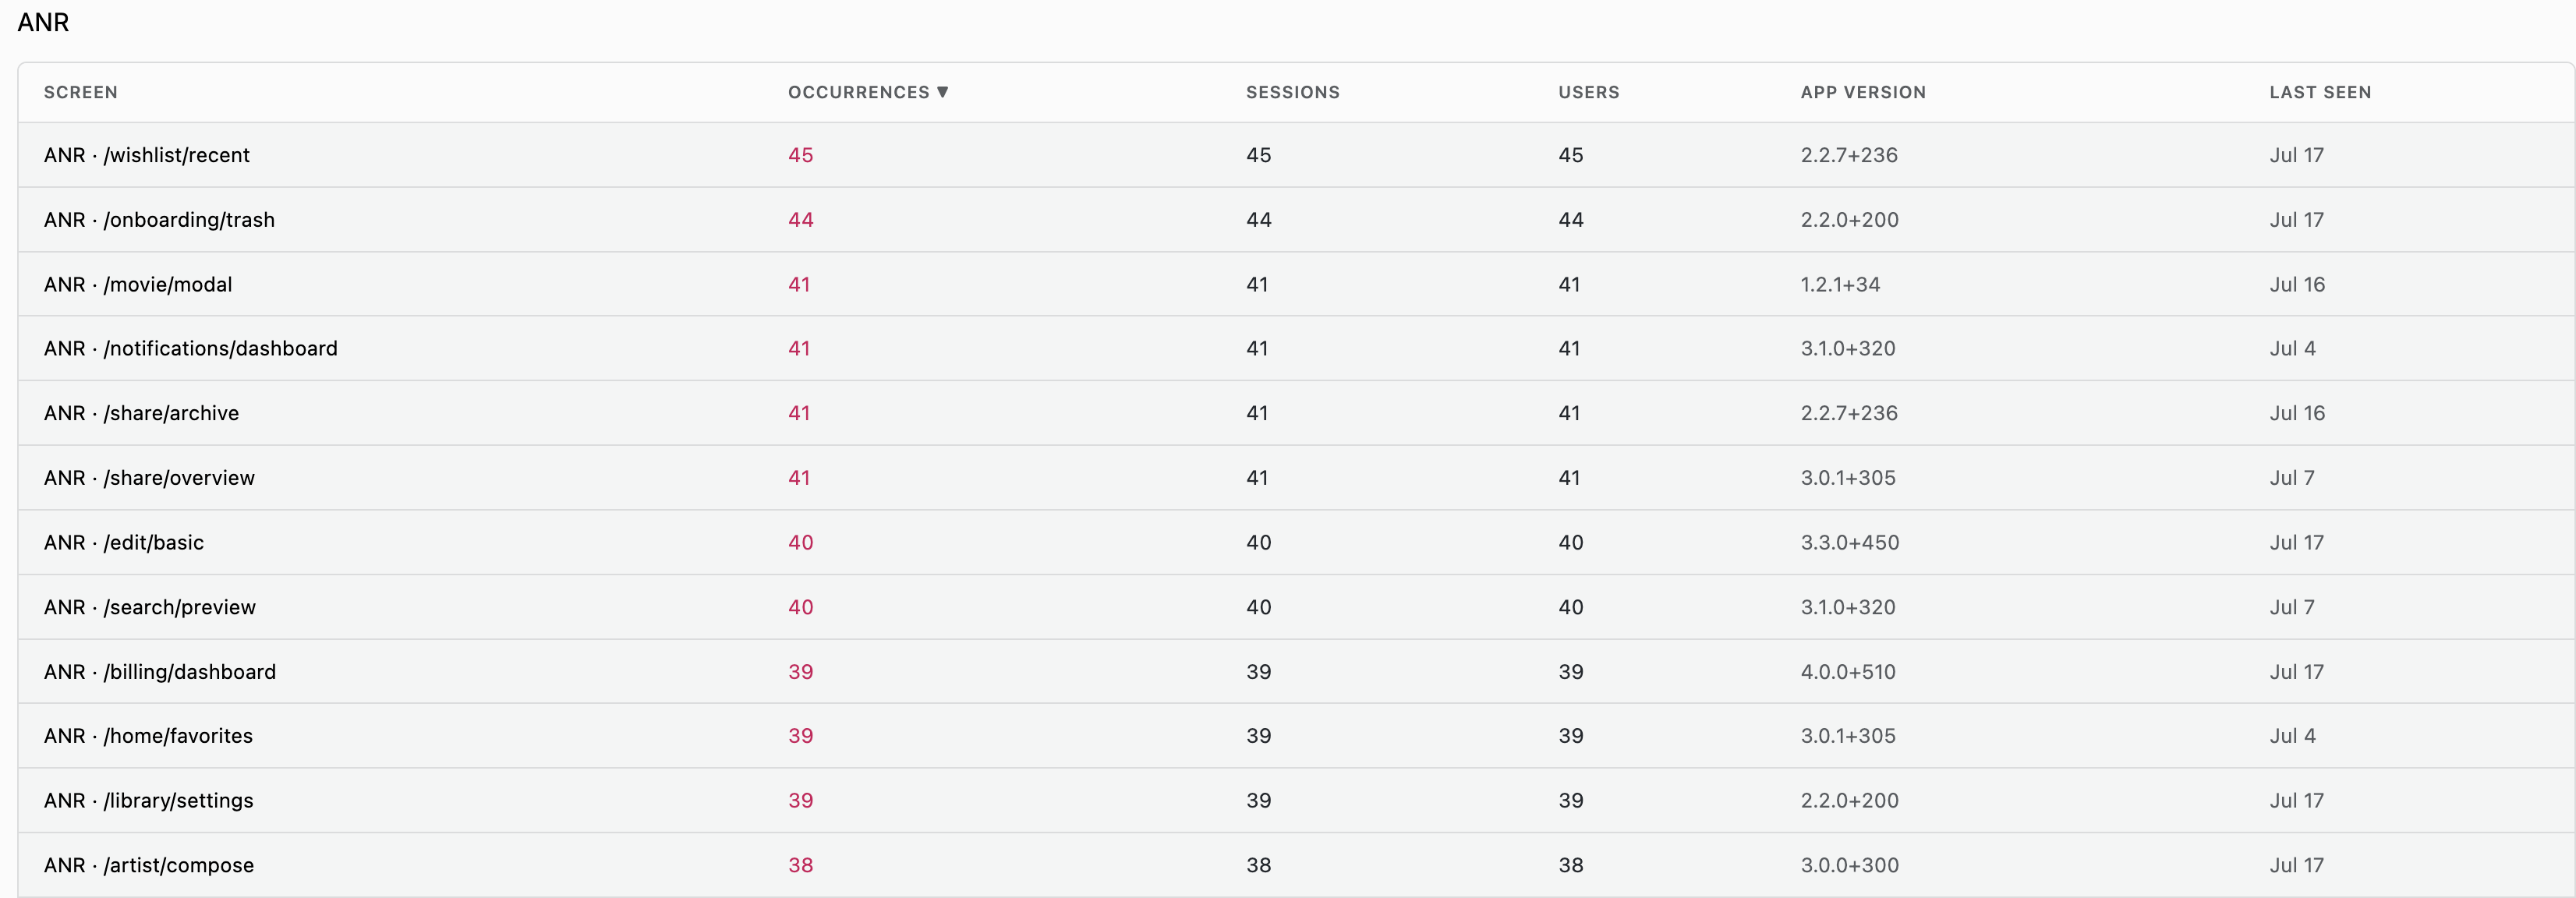
ANR List
Table Columns
| Column | Description |
|---|---|
| Screen | The screen the ANR occurred on (or unknown if it couldn't be attributed to a screen) |
| Occurrences | Total times an ANR was recorded for this screen |
| Sessions | Number of distinct sessions affected |
| Users | Number of distinct users affected |
| App Version | Version most recently associated with this screen's ANRs |
| Last Seen | When an ANR was last observed on this screen |
The Errors filter category (error.message, crash.kind, crash.type,
crash.last_screen) is available here too, alongside the shared
Filters sidebar.
ANR Details
Click a screen's ANR group to open the detail view, scoped to a specific occurrence.
Summary Stats
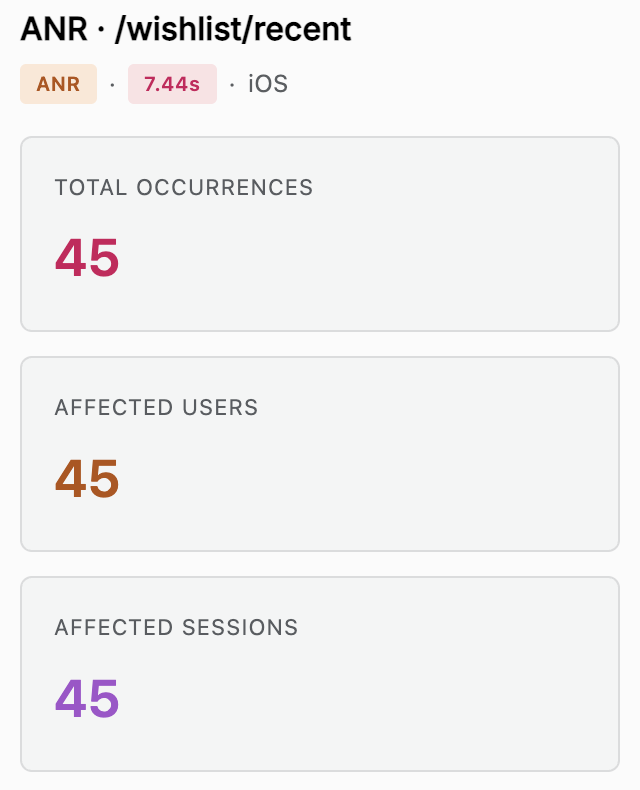
Total Occurrences, Affected Users, and Affected Sessions for the selected screen and time range.
Occurrence Breakdown
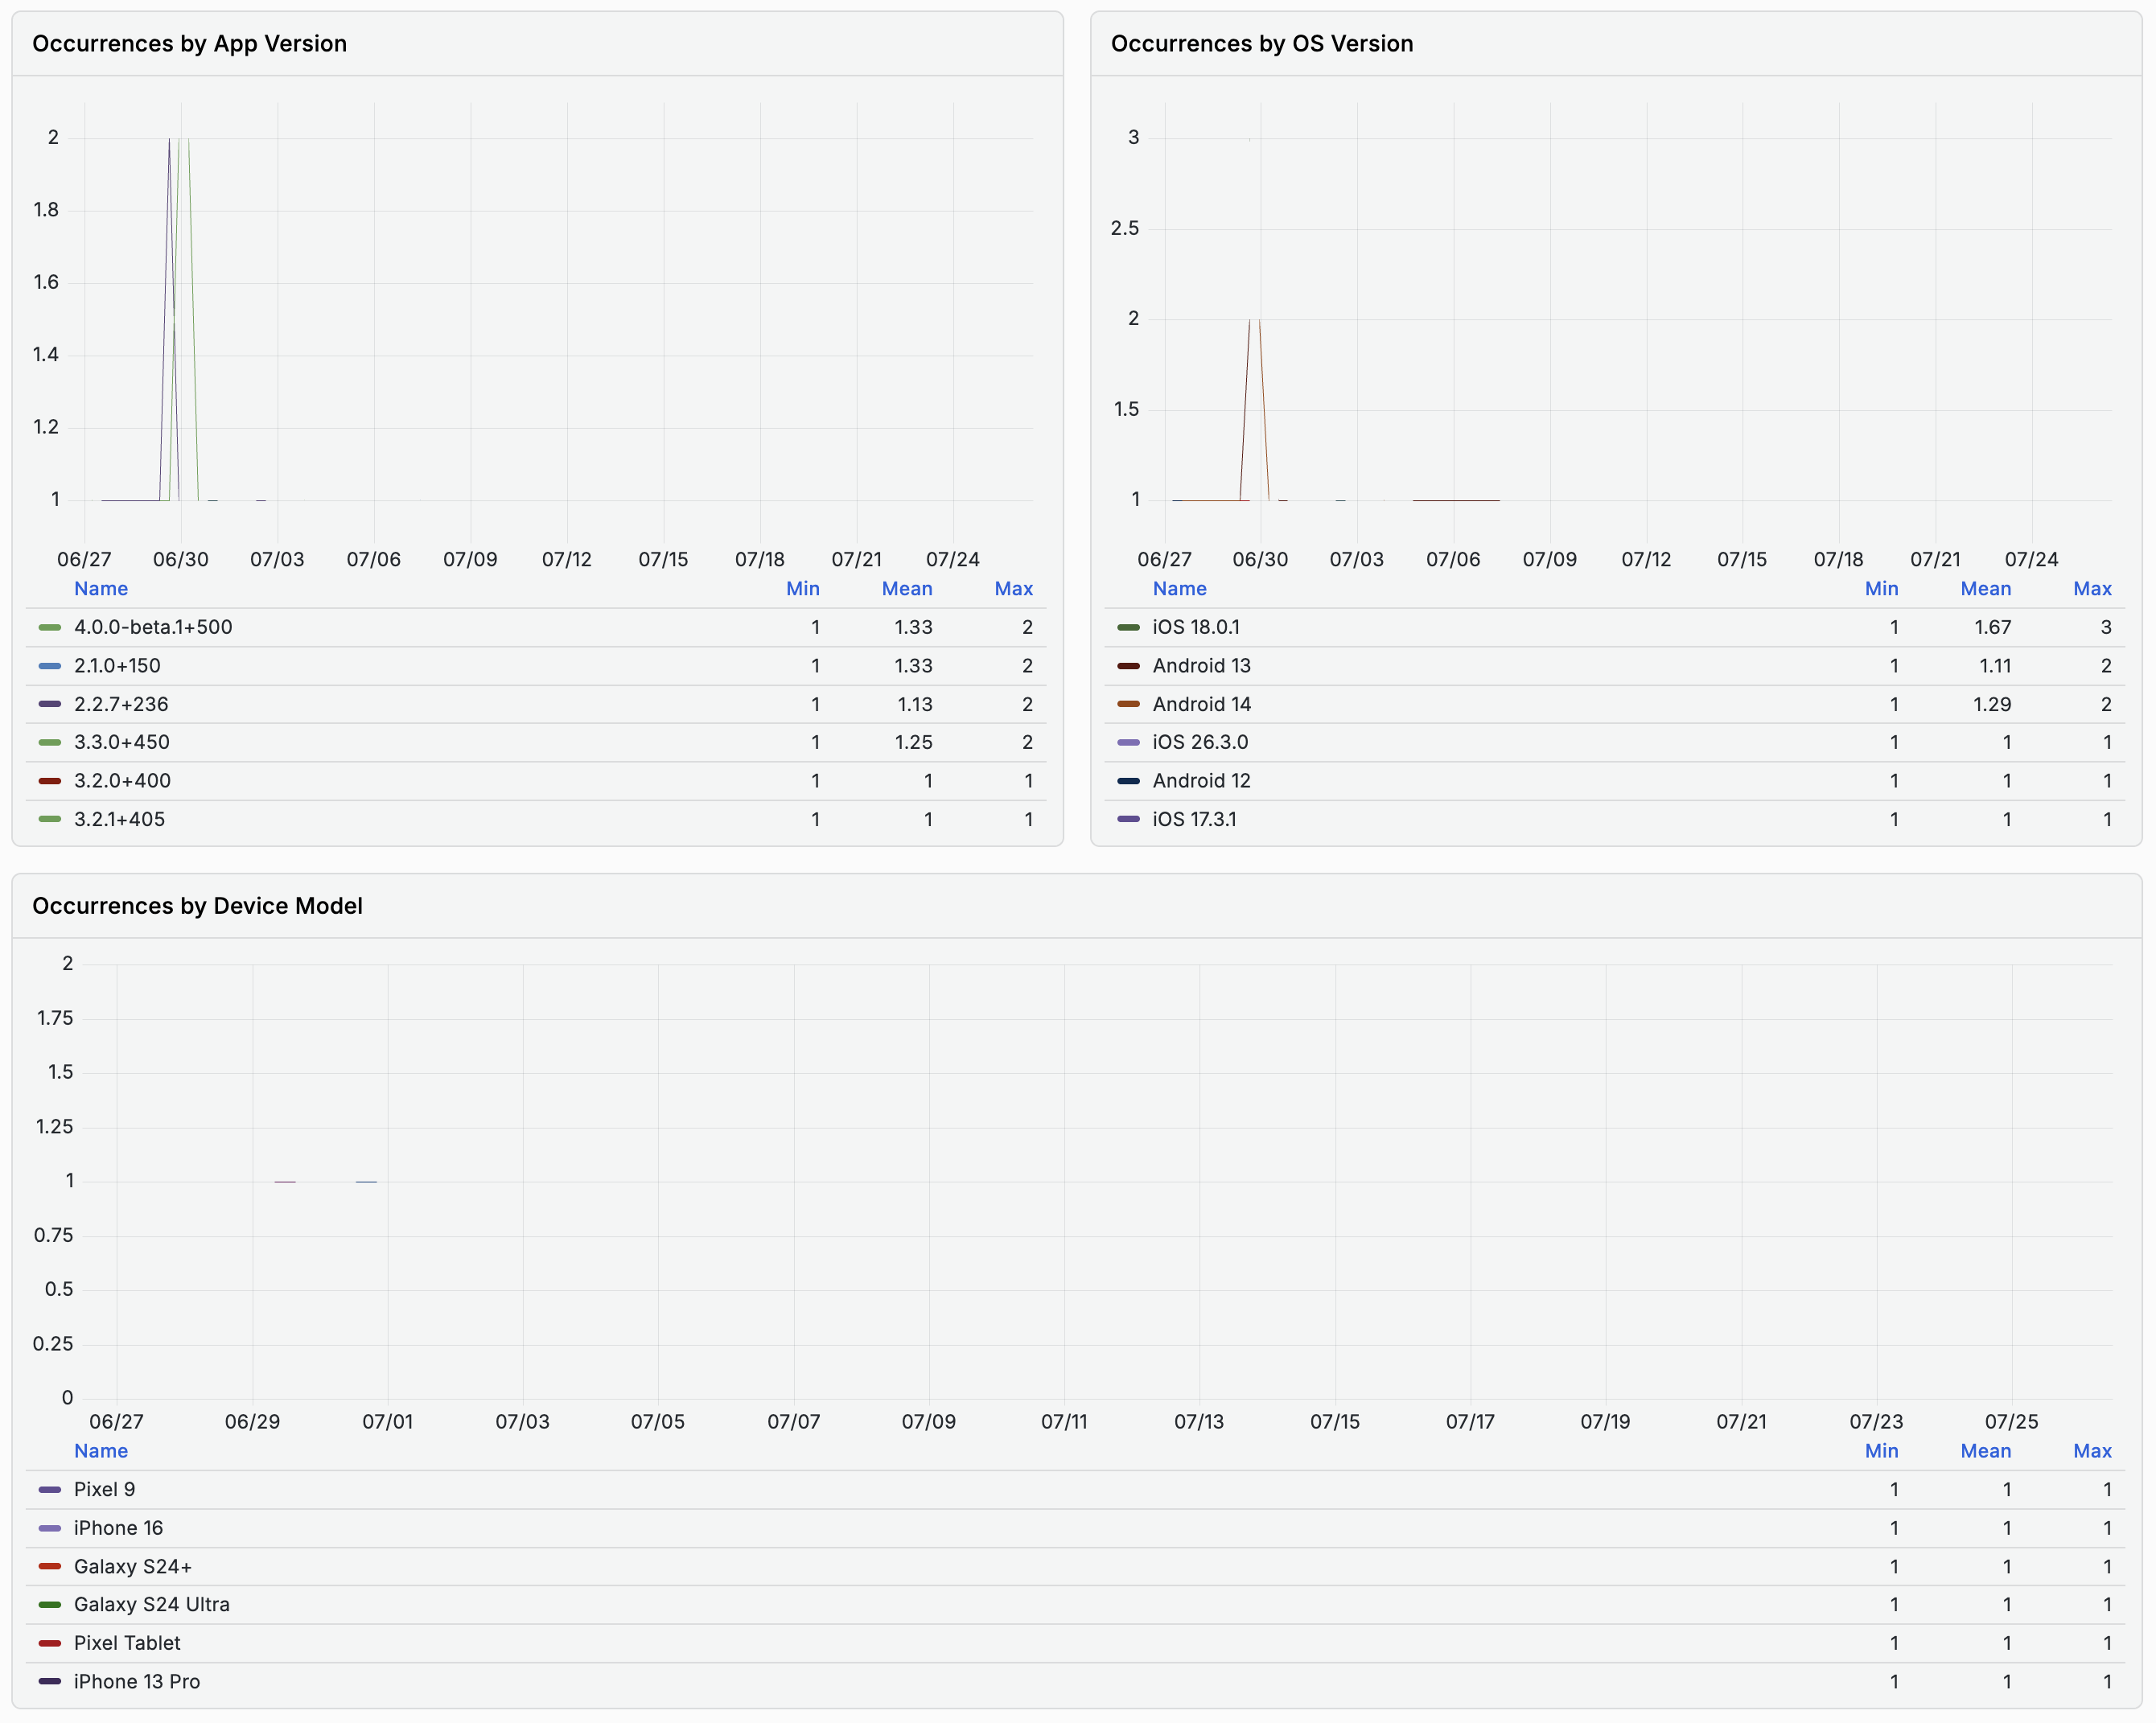
Here - unlike the list page - occurrences are broken down by App Version, by OS Version, and by Device Model, each with the usual multi-line-chart-plus-table pattern. This is where you find out which builds and devices freeze most often for this screen.
Attributes
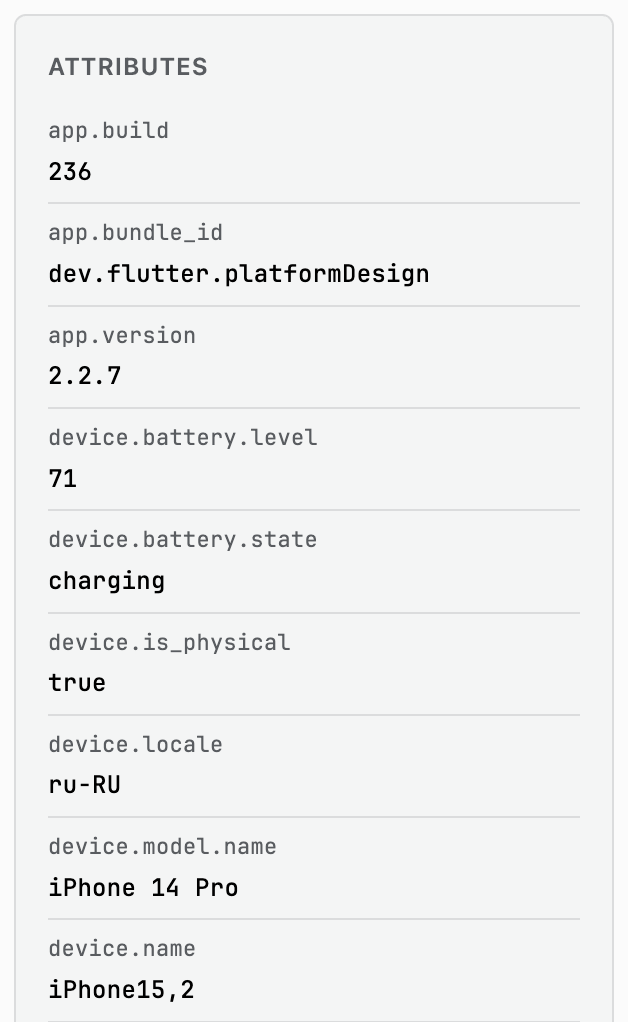
A grouped attribute panel:
| Group | Example attributes |
|---|---|
app.* | app.build, app.bundle_id, app.version |
crash.* | crash.type (anr) |
device.* | device.brand, device.manufacturer, device.model.name, device.locale, device.orientation, device.type |
error.* | error.message (for example "Application Not Responding") |
os.* | os.name, os.version, os.build |
screen.* | screen.name |
service.* | service.name, service.version |
session.* | session.id, session.sample_rate, session.start_time, session.type |
telemetry.sdk.* | telemetry.sdk.name, telemetry.sdk.language, telemetry.sdk.version |
user.* | user.anonymous_id |
Stack Trace (Main Thread) and All Threads
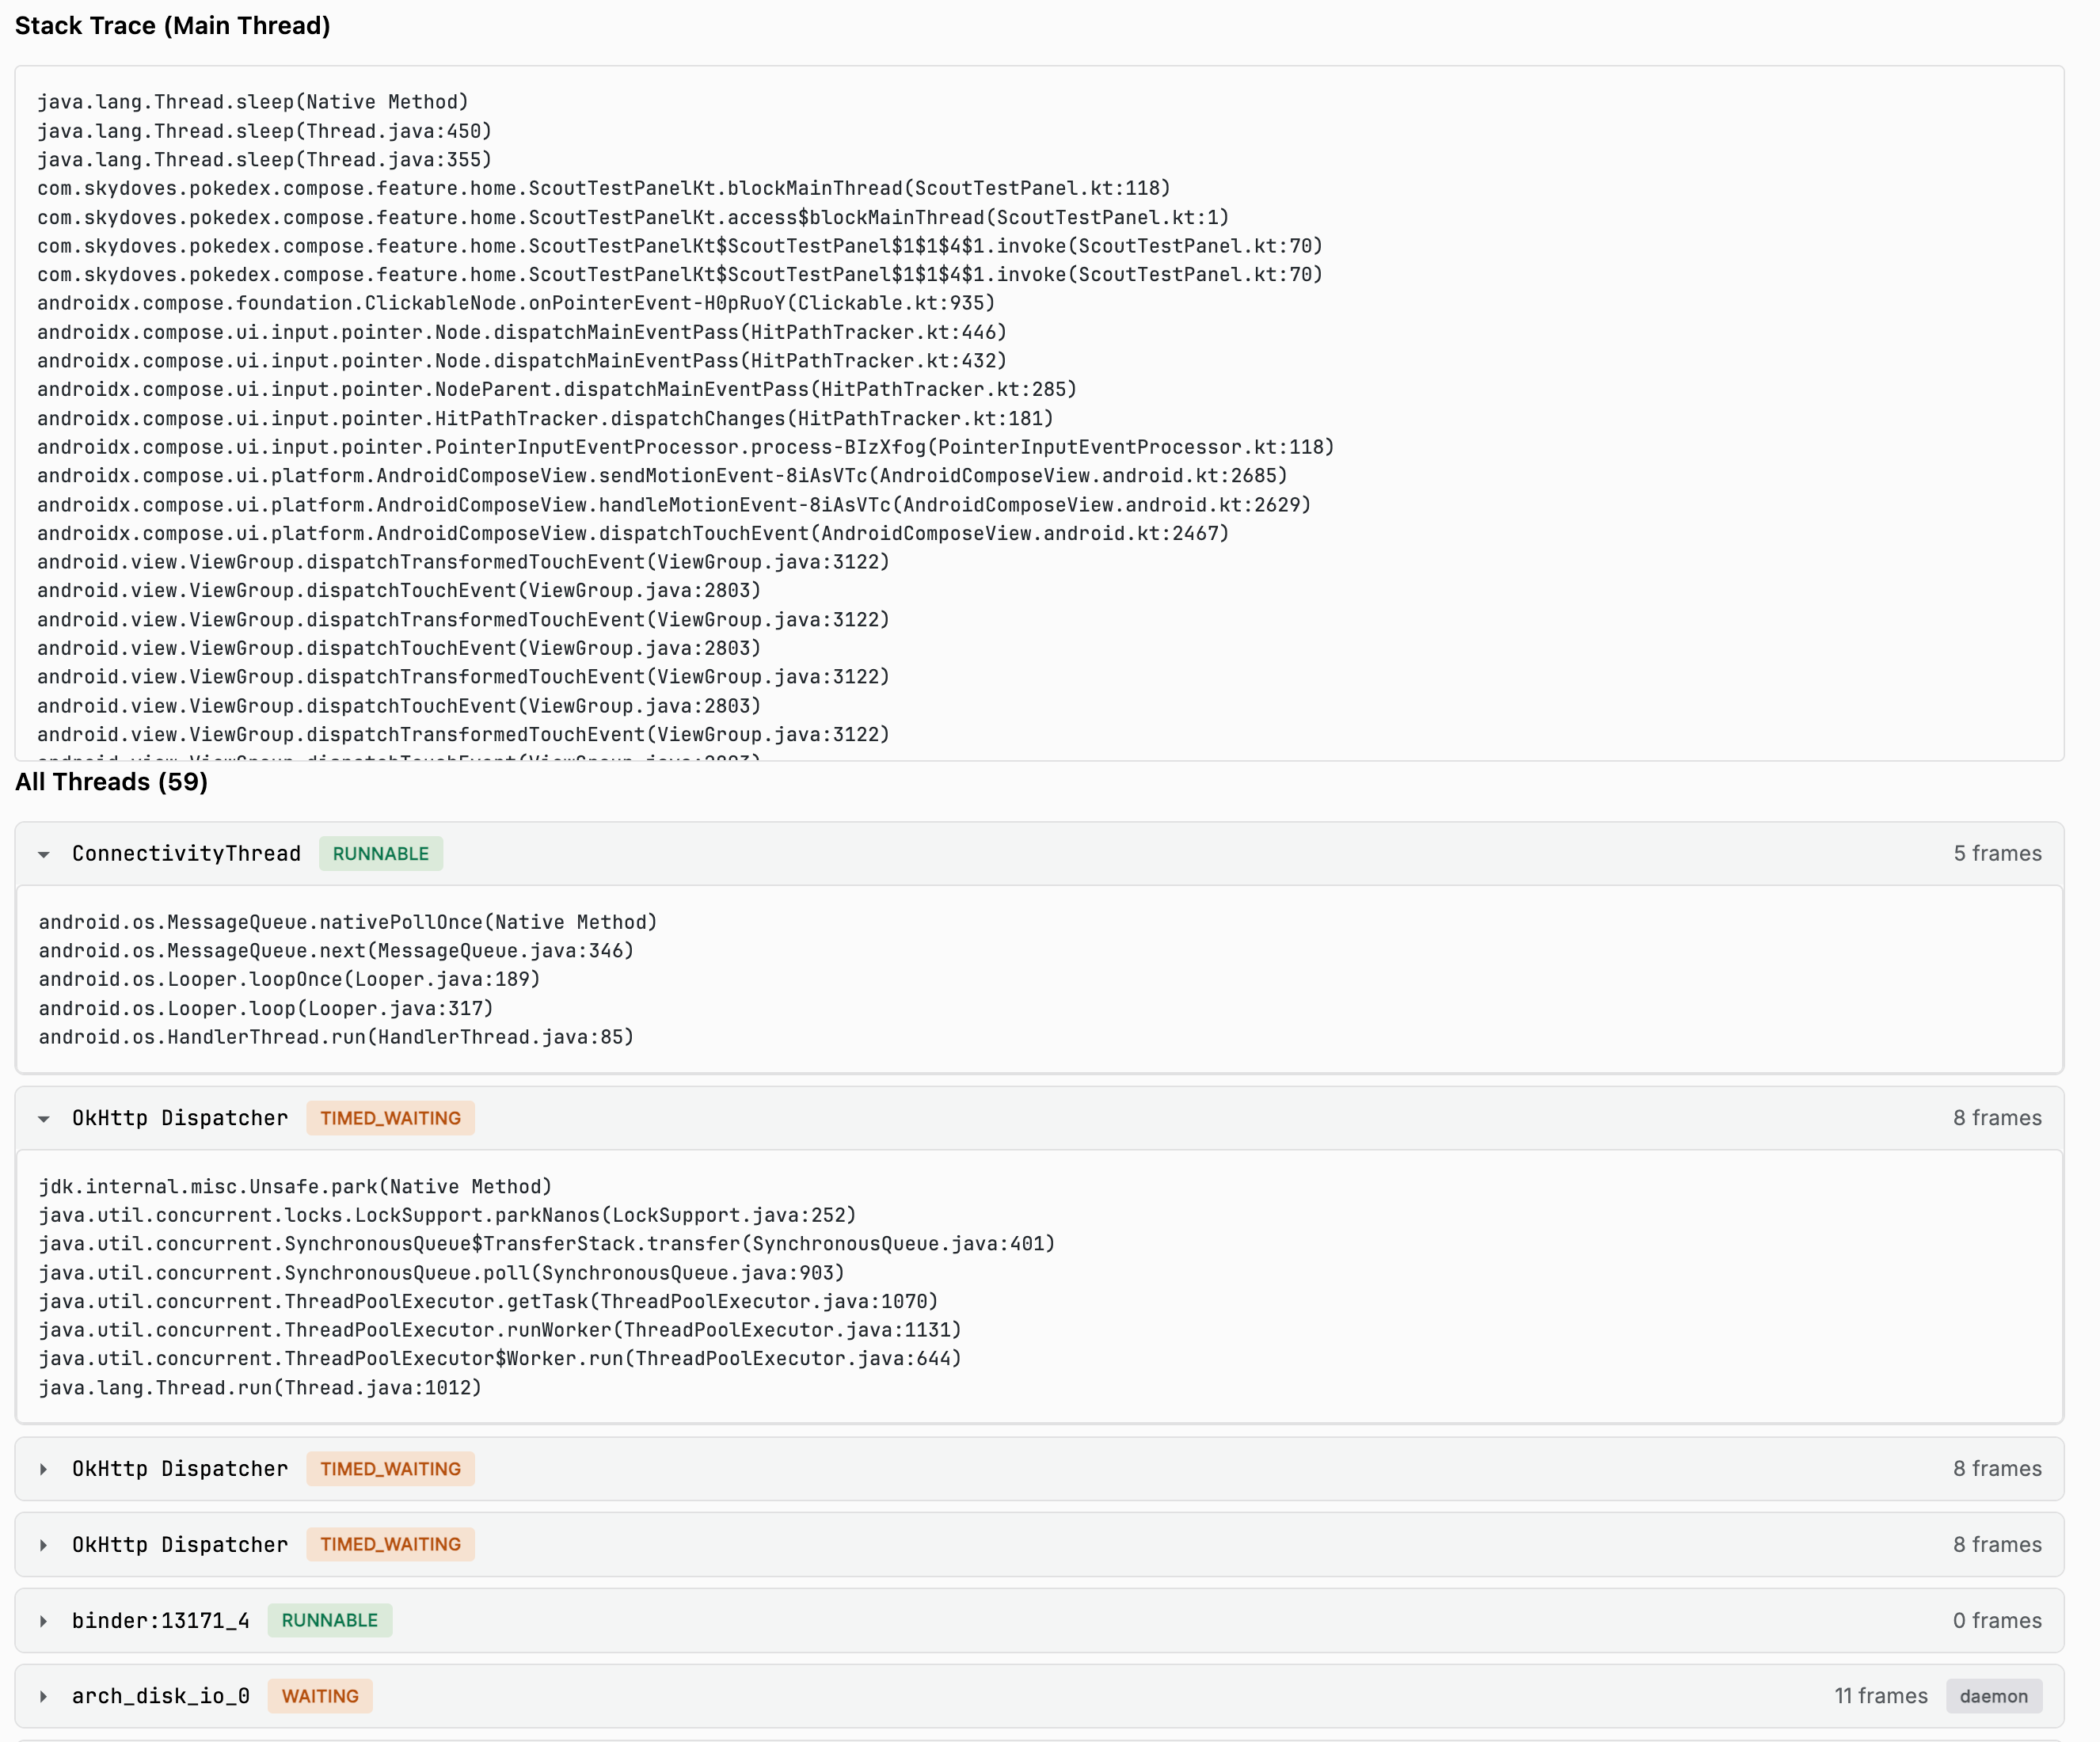
The Stack Trace (Main Thread) panel shows where the main thread was
blocked. Below it, All Threads lists every thread with its state
(RUNNABLE, TIMED_WAITING, WAITING) and frame count - expand a thread to
see its own stack. This is how you find which thread was holding the lock
the main thread was waiting on.
As with crash stack traces, frames resolve to readable file, line, and symbol names once the matching debug artifacts for that build have been uploaded.
Breadcrumbs
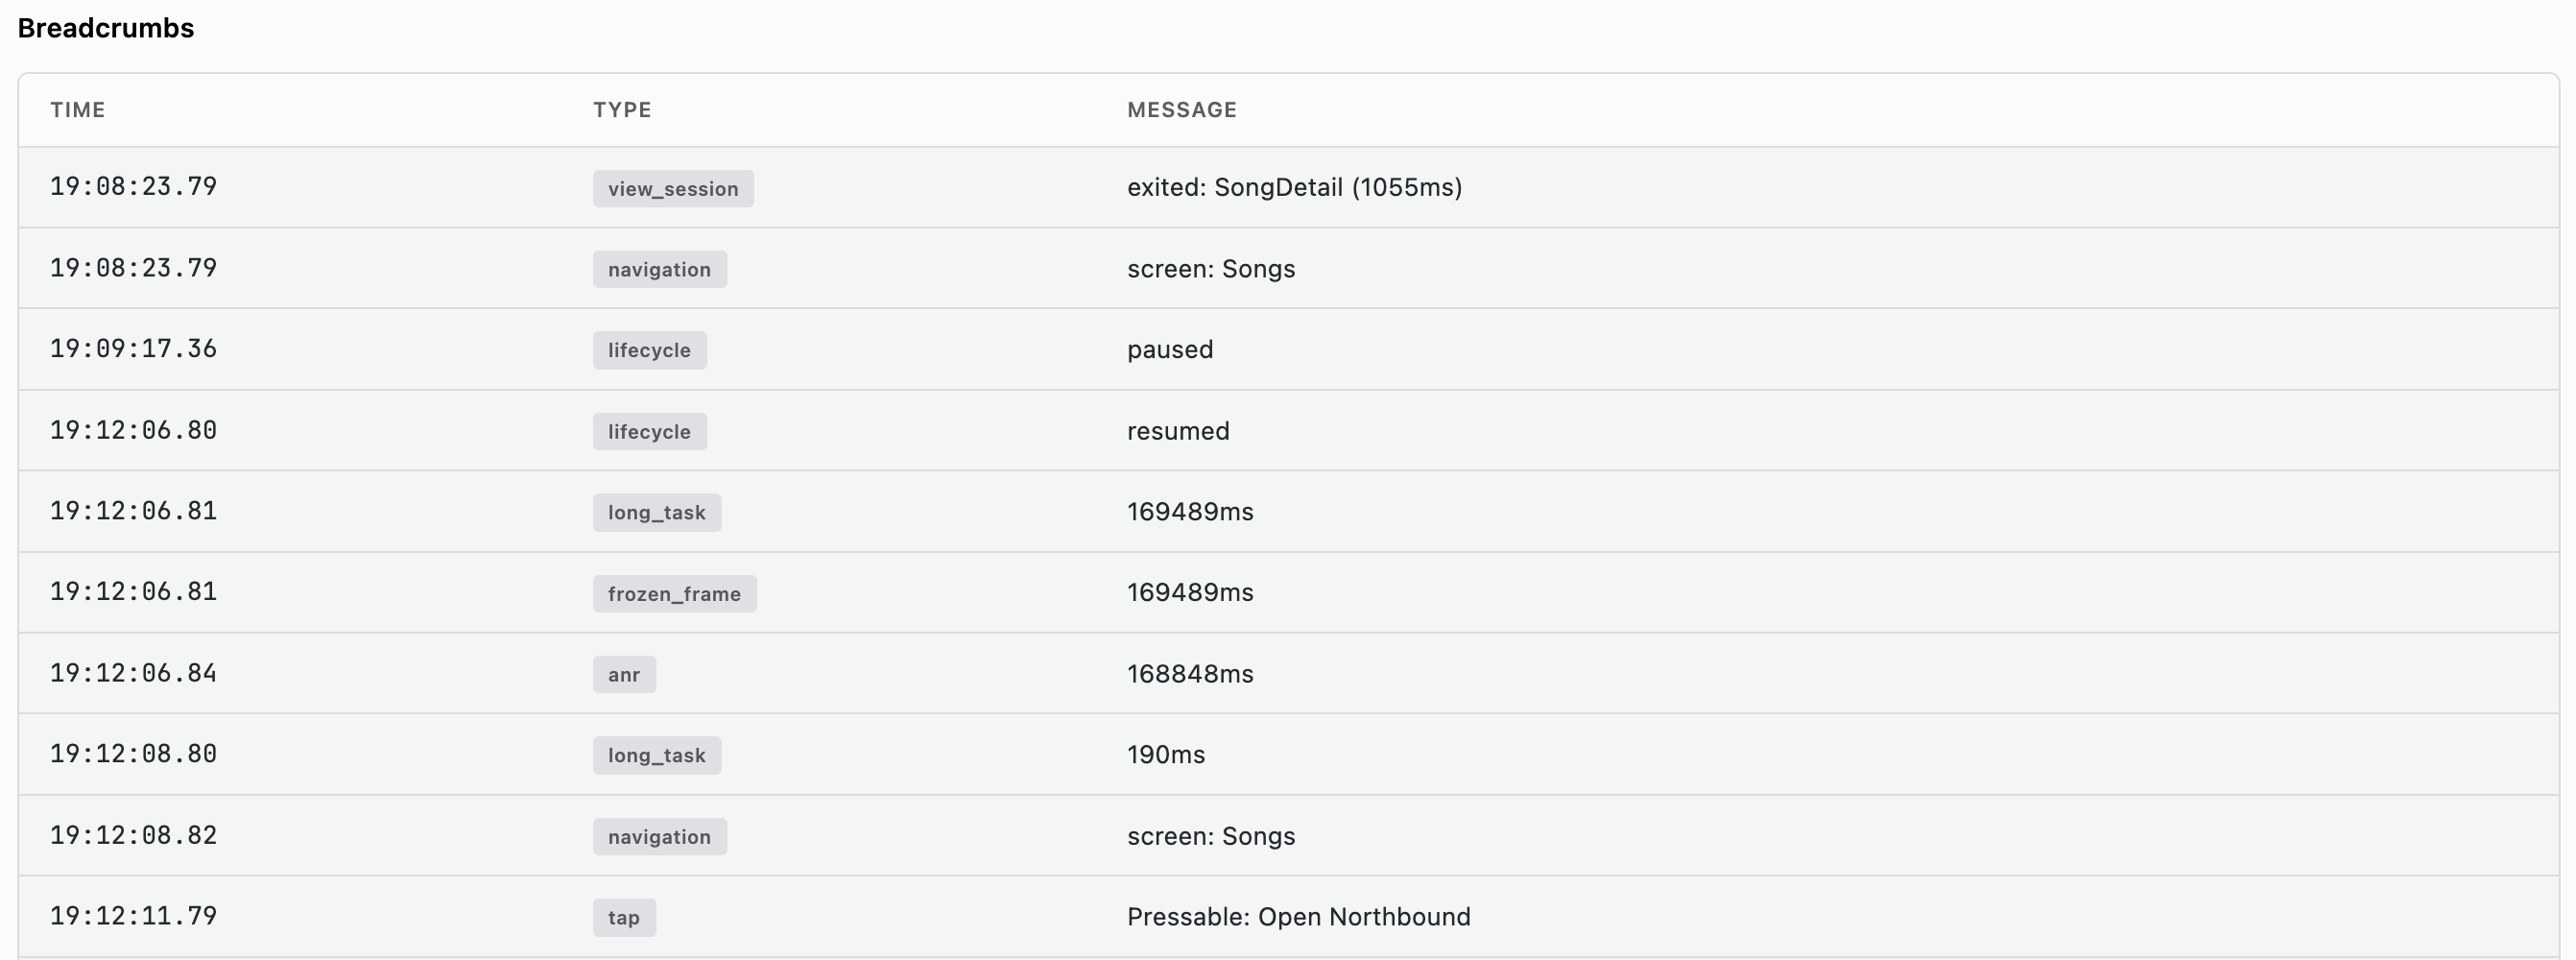
A chronological table (Time, Type, Message) of lifecycle, navigation, and tap events leading up to the freeze.
Affected Devices and Affected Users

Same structure as Crashes.
Use View Session Timeline to jump into the full session where the ANR occurred.
Use Cases
Finding the Worst Frozen Screen
- Sort the ANR List by Occurrences
- Open the top screen and check Occurrences by App Version to see if it's a regression in a specific release
- Use All Threads to identify what was blocking the main thread (a
RUNNABLEthread holding a lock the main thread isWAITINGon is a common culprit)
Confirming a Fix Reduced Freezes
- Open the screen's ANR group
- Filter to the version containing the fix
- Confirm Occurrences by App Version drops for that version
FAQ
What counts as an ANR?
An ANR is a period where the app's main thread was blocked and could not respond to user input, which the user experiences as a frozen screen. RUM records these and groups them by the screen they happened on.
Does session sampling hide ANRs?
No, not by default. ANR telemetry bypasses the session sample rate along with
crashes and errors, so ANR counts are complete even when only a small
percentage of sessions is sampled. Setting alwaysCaptureErrors to false in
the SDK puts them behind the same sampling gate.
Related Guides
- Getting Started - Interface layout and shared filters
- Overview - ANR duration trend alongside crashes and sessions
- Screens - Per-screen performance, including jank and load time
- Sessions - Full session timeline for a specific occurrence
- traceX - Distributed tracing explorer
- logX - Log explorer with trace correlation