RUM Overview
The Overview tab is your health-at-a-glance dashboard for the selected mobile application, combining top-line stats, trend charts, breakdowns by app version/OS/device, and the screens most worth investigating.
Key Metrics

| Metric | Description |
|---|---|
| Crash-Free Sessions | Percentage of sessions with no crashes |
| Total Sessions | Number of user sessions in the range |
| Active Users | Distinct users in the range |
| Avg Cold Start | Average cold app-startup time, with a trend sparkline (mobile apps only) |
| Avg Warm Start | Average warm app-startup time, with a trend sparkline (mobile apps only) |
| Total Errors | Count of reported non-fatal errors |
Core Web Vitals
Web apps, and mobile apps that embed WebViews, get a second row: LCP (Largest Contentful Paint), INP (Interaction to Next Paint), and CLS (Cumulative Layout Shift). Each shows the p75 across the app, colored against the standard good / needs-improvement / poor thresholds. A bar shows how the individual measurements split across those ratings. See Screens for the thresholds and the per-screen breakdown.
On web apps, LCP is the page-load metric (or FCP, if an admin chose it). Browsers have no cold or warm start, so those two tiles are not shown.
Use the shared Filters sidebar (Device, App, Session, Network) to scope every metric below to a specific slice of traffic.
Total Sessions reflects the app's configured session sample rate (the SDK defaults to sampling 1% of sessions). Crash-Free Sessions and Total Errors aren't affected by that sampling - crash, error, and ANR telemetry bypasses the session sample rate by default, so those counts stay accurate even at a low sample rate. See Sessions in the instrumentation guide for how sampling is configured.
Trends Over Time
Three daily time-series charts sit right under the Key Metrics row:

Sessions Over Time
Session volume per day. Use it to spot release-day spikes or a sudden drop in traffic that might indicate an app outage or a broken build.
Crashes Over Time
Crash volume per day. A spike here that lines up with a Sessions spike usually means a release just went out; check Crashes for which crash groups are driving it.
ANR Duration Over Time
Frozen-UI (ANR) duration per day. Sustained increases point at a regression in a specific screen or build; cross-check against ANR for the affected screens.
Detailed Breakdown
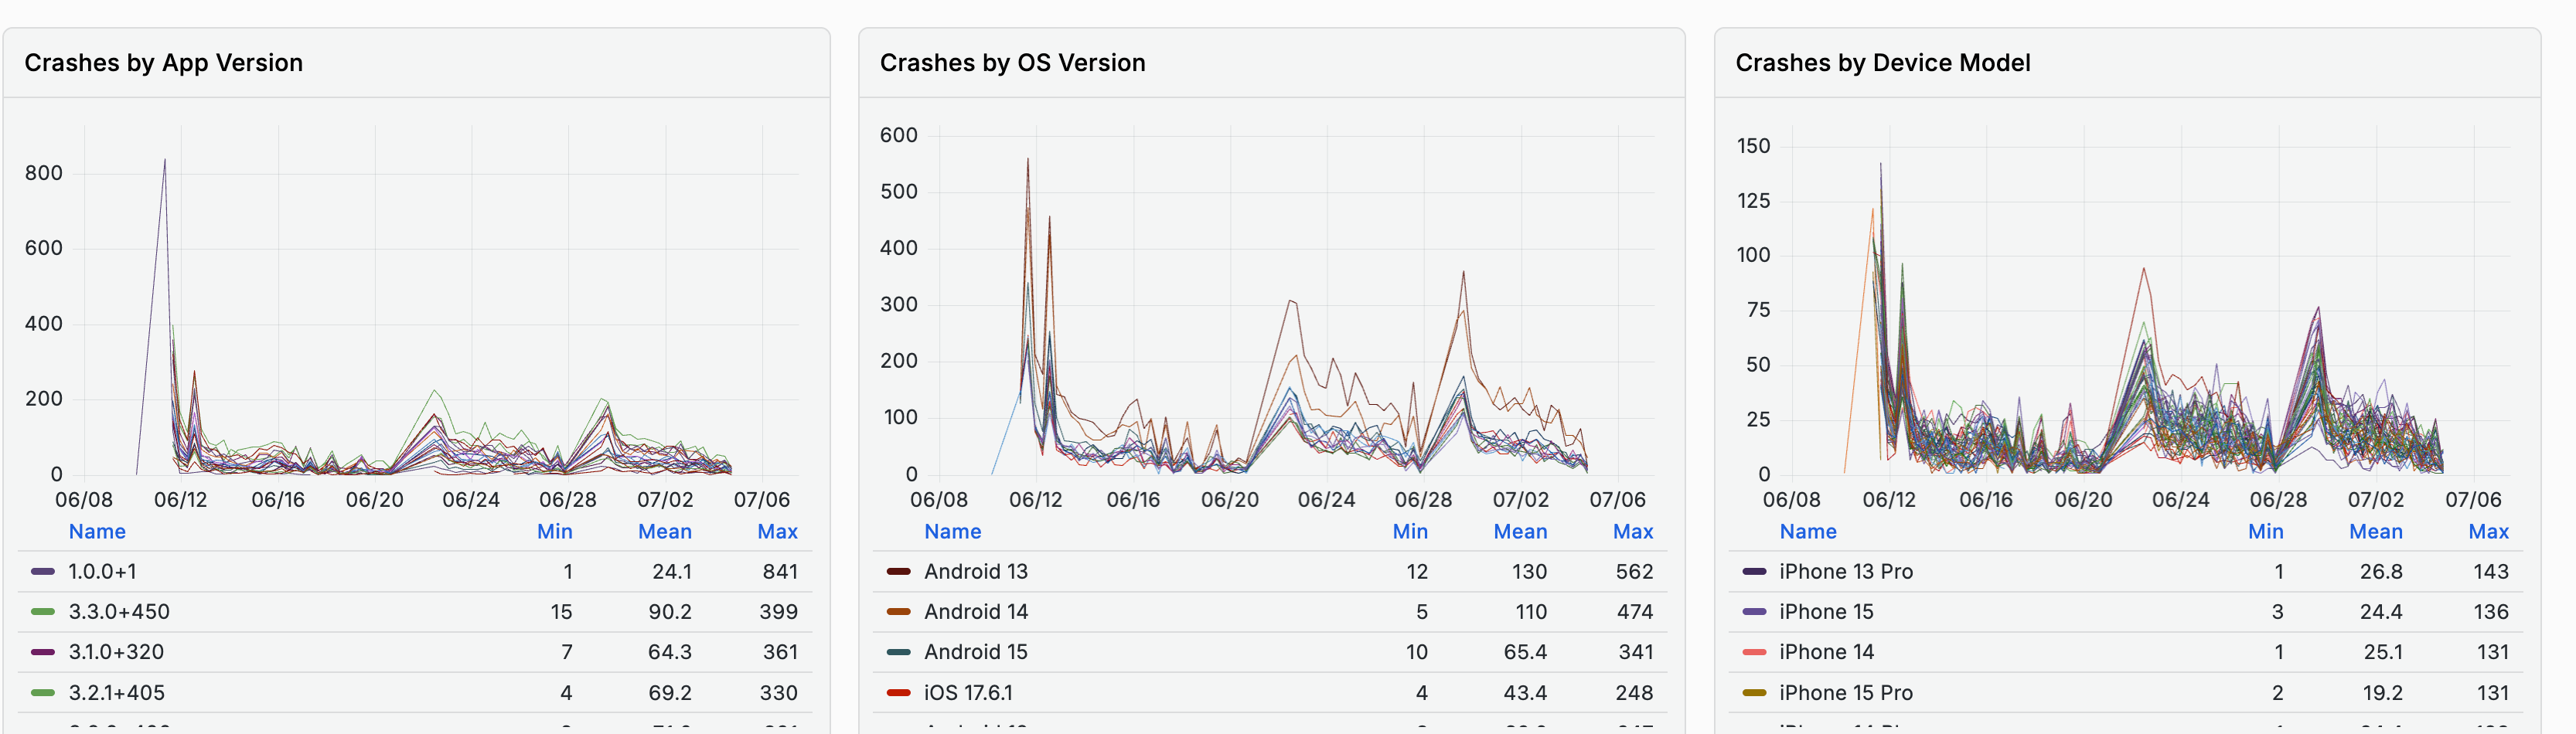
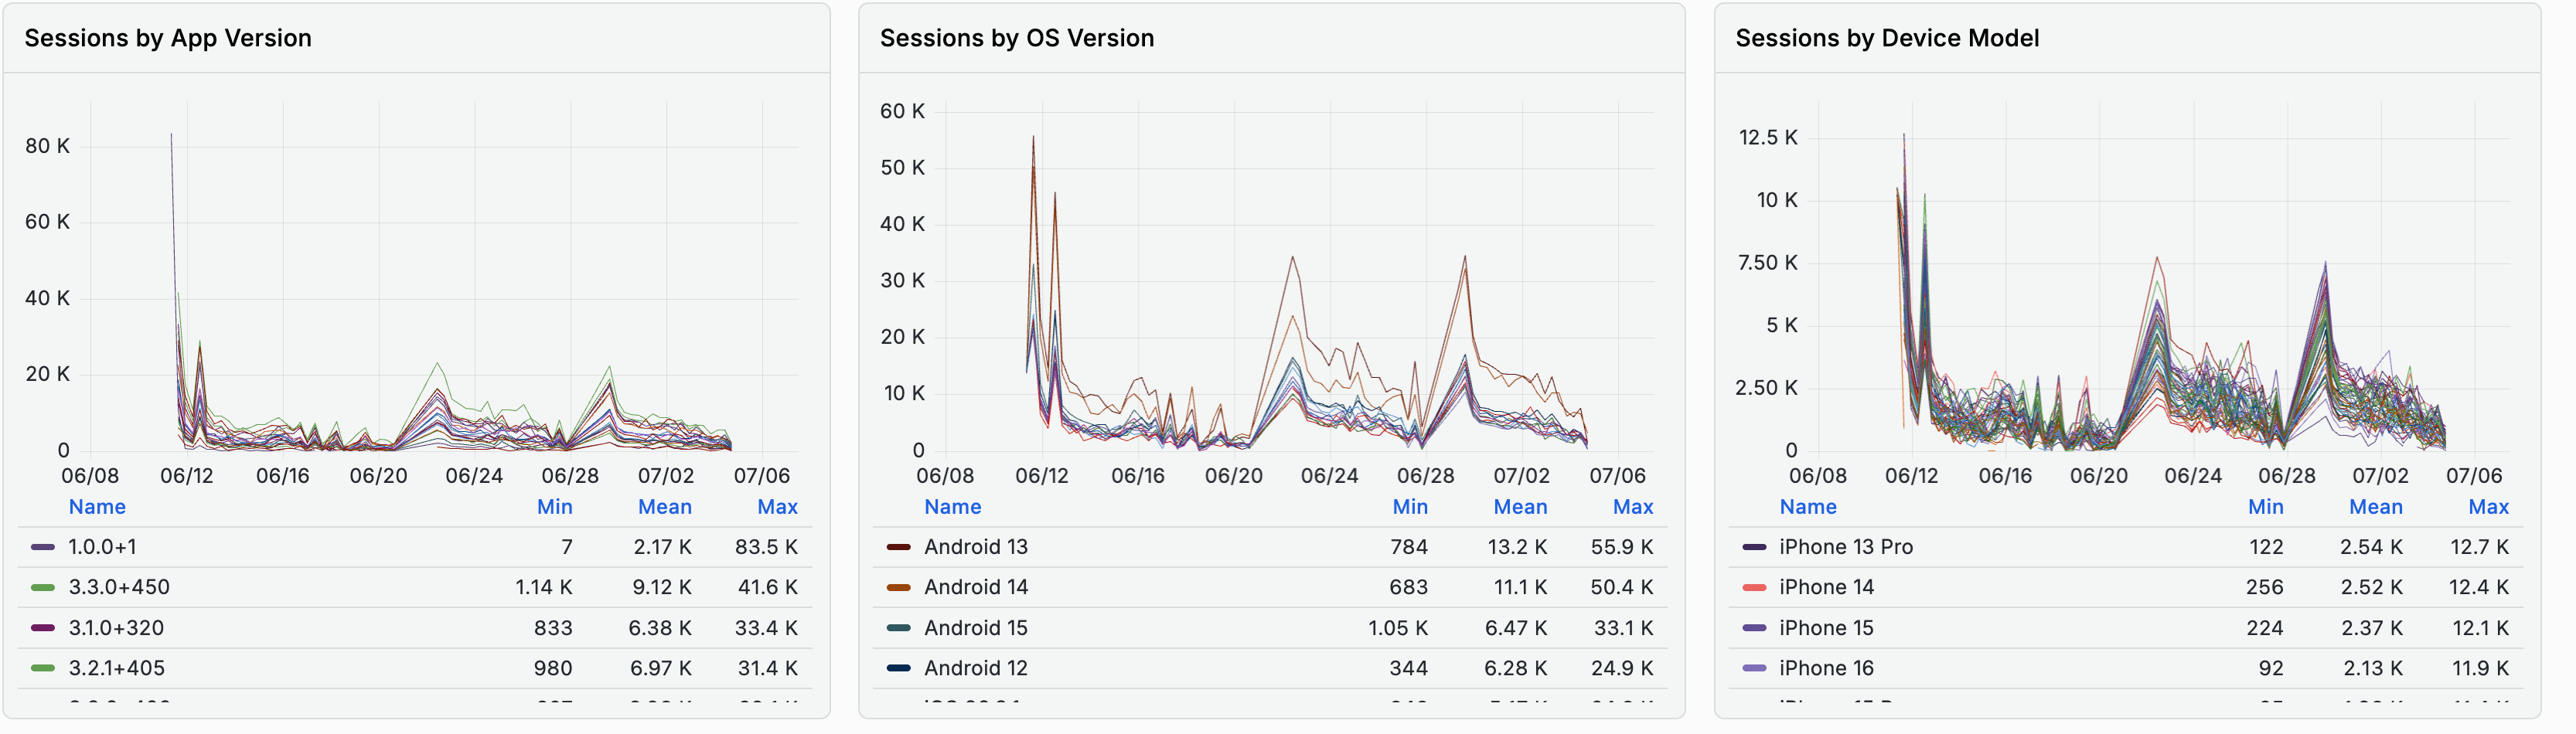
Expand Detailed Breakdown to slice Crashes, Sessions, and ANR Duration each three ways: by App Version, by OS Version, and by Device Model. Every chart pairs a multi-line time series with a table of Name / Min / Mean / Max, so you can see both the trend and the worst-case value per version, OS, or device at a glance:
-
Crashes by App Version / by OS Version / by Device Model
-
Sessions by App Version / by OS Version / by Device Model
-
ANR Duration by App Version / by OS Version / by Device Model
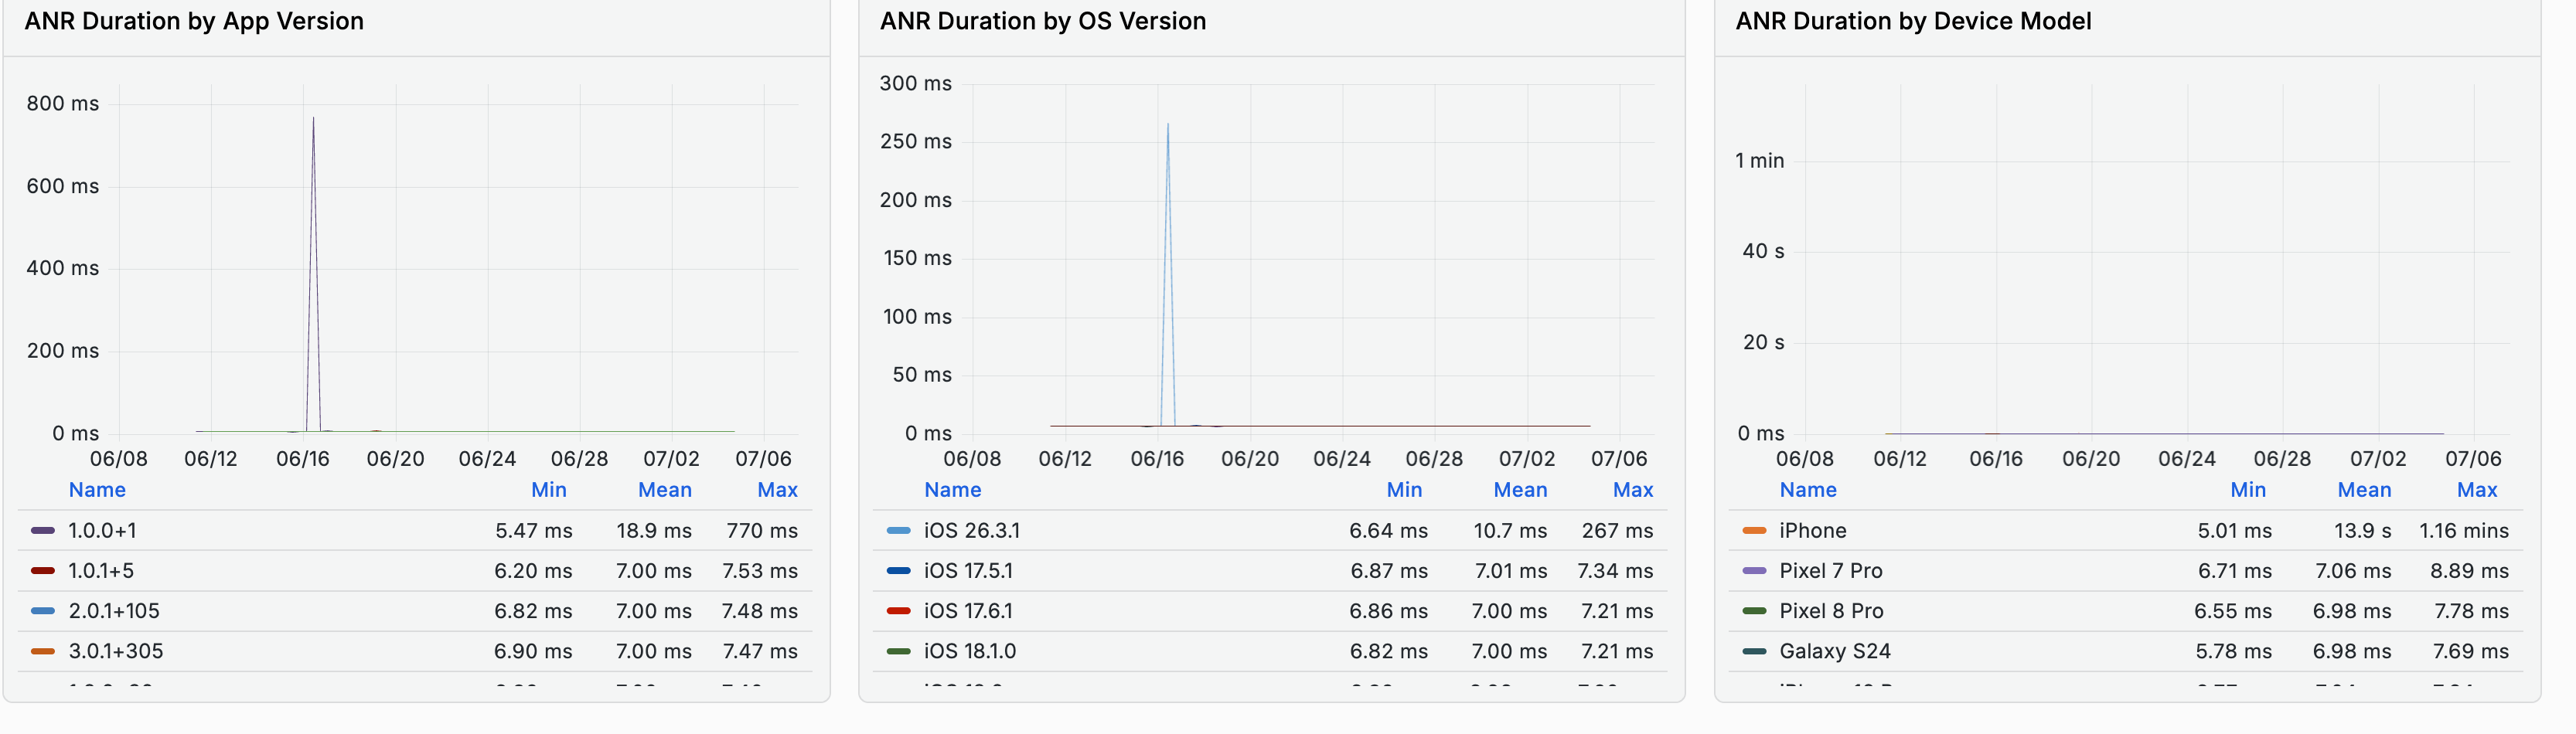
This is the fastest way to answer "did the new release make things worse?" - compare the latest app version's line against previous versions in the same chart.
Top Screens
Two tables at the bottom of the Overview surface the screens most worth attention:

Top Crashing Screens
Columns: Screen, Crashes, Last Seen. Ranked by crash count over the selected range.
Slowest Screens
Mobile apps: Screen, Load Time p95, Views, ranked by p95 load time. Web apps: Screen, LCP p75, Page Loads, ranked by p75 LCP (FCP p75 when the app is configured for FCP).
Click through to Screens for the full per-screen breakdown, including frame timing and jank.
Use Cases
Morning Health Check
- Check Crash-Free Sessions and Total Errors against their usual range
- Scan Sessions Over Time and Crashes Over Time for overnight anomalies
- Glance at Top Crashing Screens for anything new
Post-Release Monitoring
- Filter by the new App Version in the Filters sidebar
- Compare its line in the Crashes by App Version and ANR Duration by App Version breakdowns against the previous version
- If crashes or ANR duration are elevated, jump to Crashes or ANR to find the specific cause
Investigating a Spike
- Find the spike in Crashes Over Time or ANR Duration Over Time
- Narrow the time picker to that window
- Check Top Crashing Screens for the screen driving it, then open Crashes or Screens for details
FAQ
Does session sampling distort the crash-free rate?
No. Crash, error, and ANR telemetry bypasses the session sample rate by default, so Crash-Free Sessions and Total Errors stay accurate even at a 1% rate. Only the timeline detail around an unsampled session is missing.
How do I tell whether a new release made things worse?
Expand Detailed Breakdown and compare the new version's line against previous versions in Crashes by App Version and ANR Duration by App Version. Both pair a time series with a Name / Min / Mean / Max table, so you see the trend and the worst case together.
Related Guides
- Getting Started - Interface layout and shared filters
- Crashes - Crash groups and symbolicated stack traces
- Sessions - Session list and event timelines
- Users - Per-user activity and history
- OpenTelemetry RUM - Web and mobile RUM as OTLP, queried beside backend traces