Traces
The Traces tab embeds traceX inside APM. It preserves the context from the APM view you drilled from, avoiding a second round of filtering before you inspect a request.
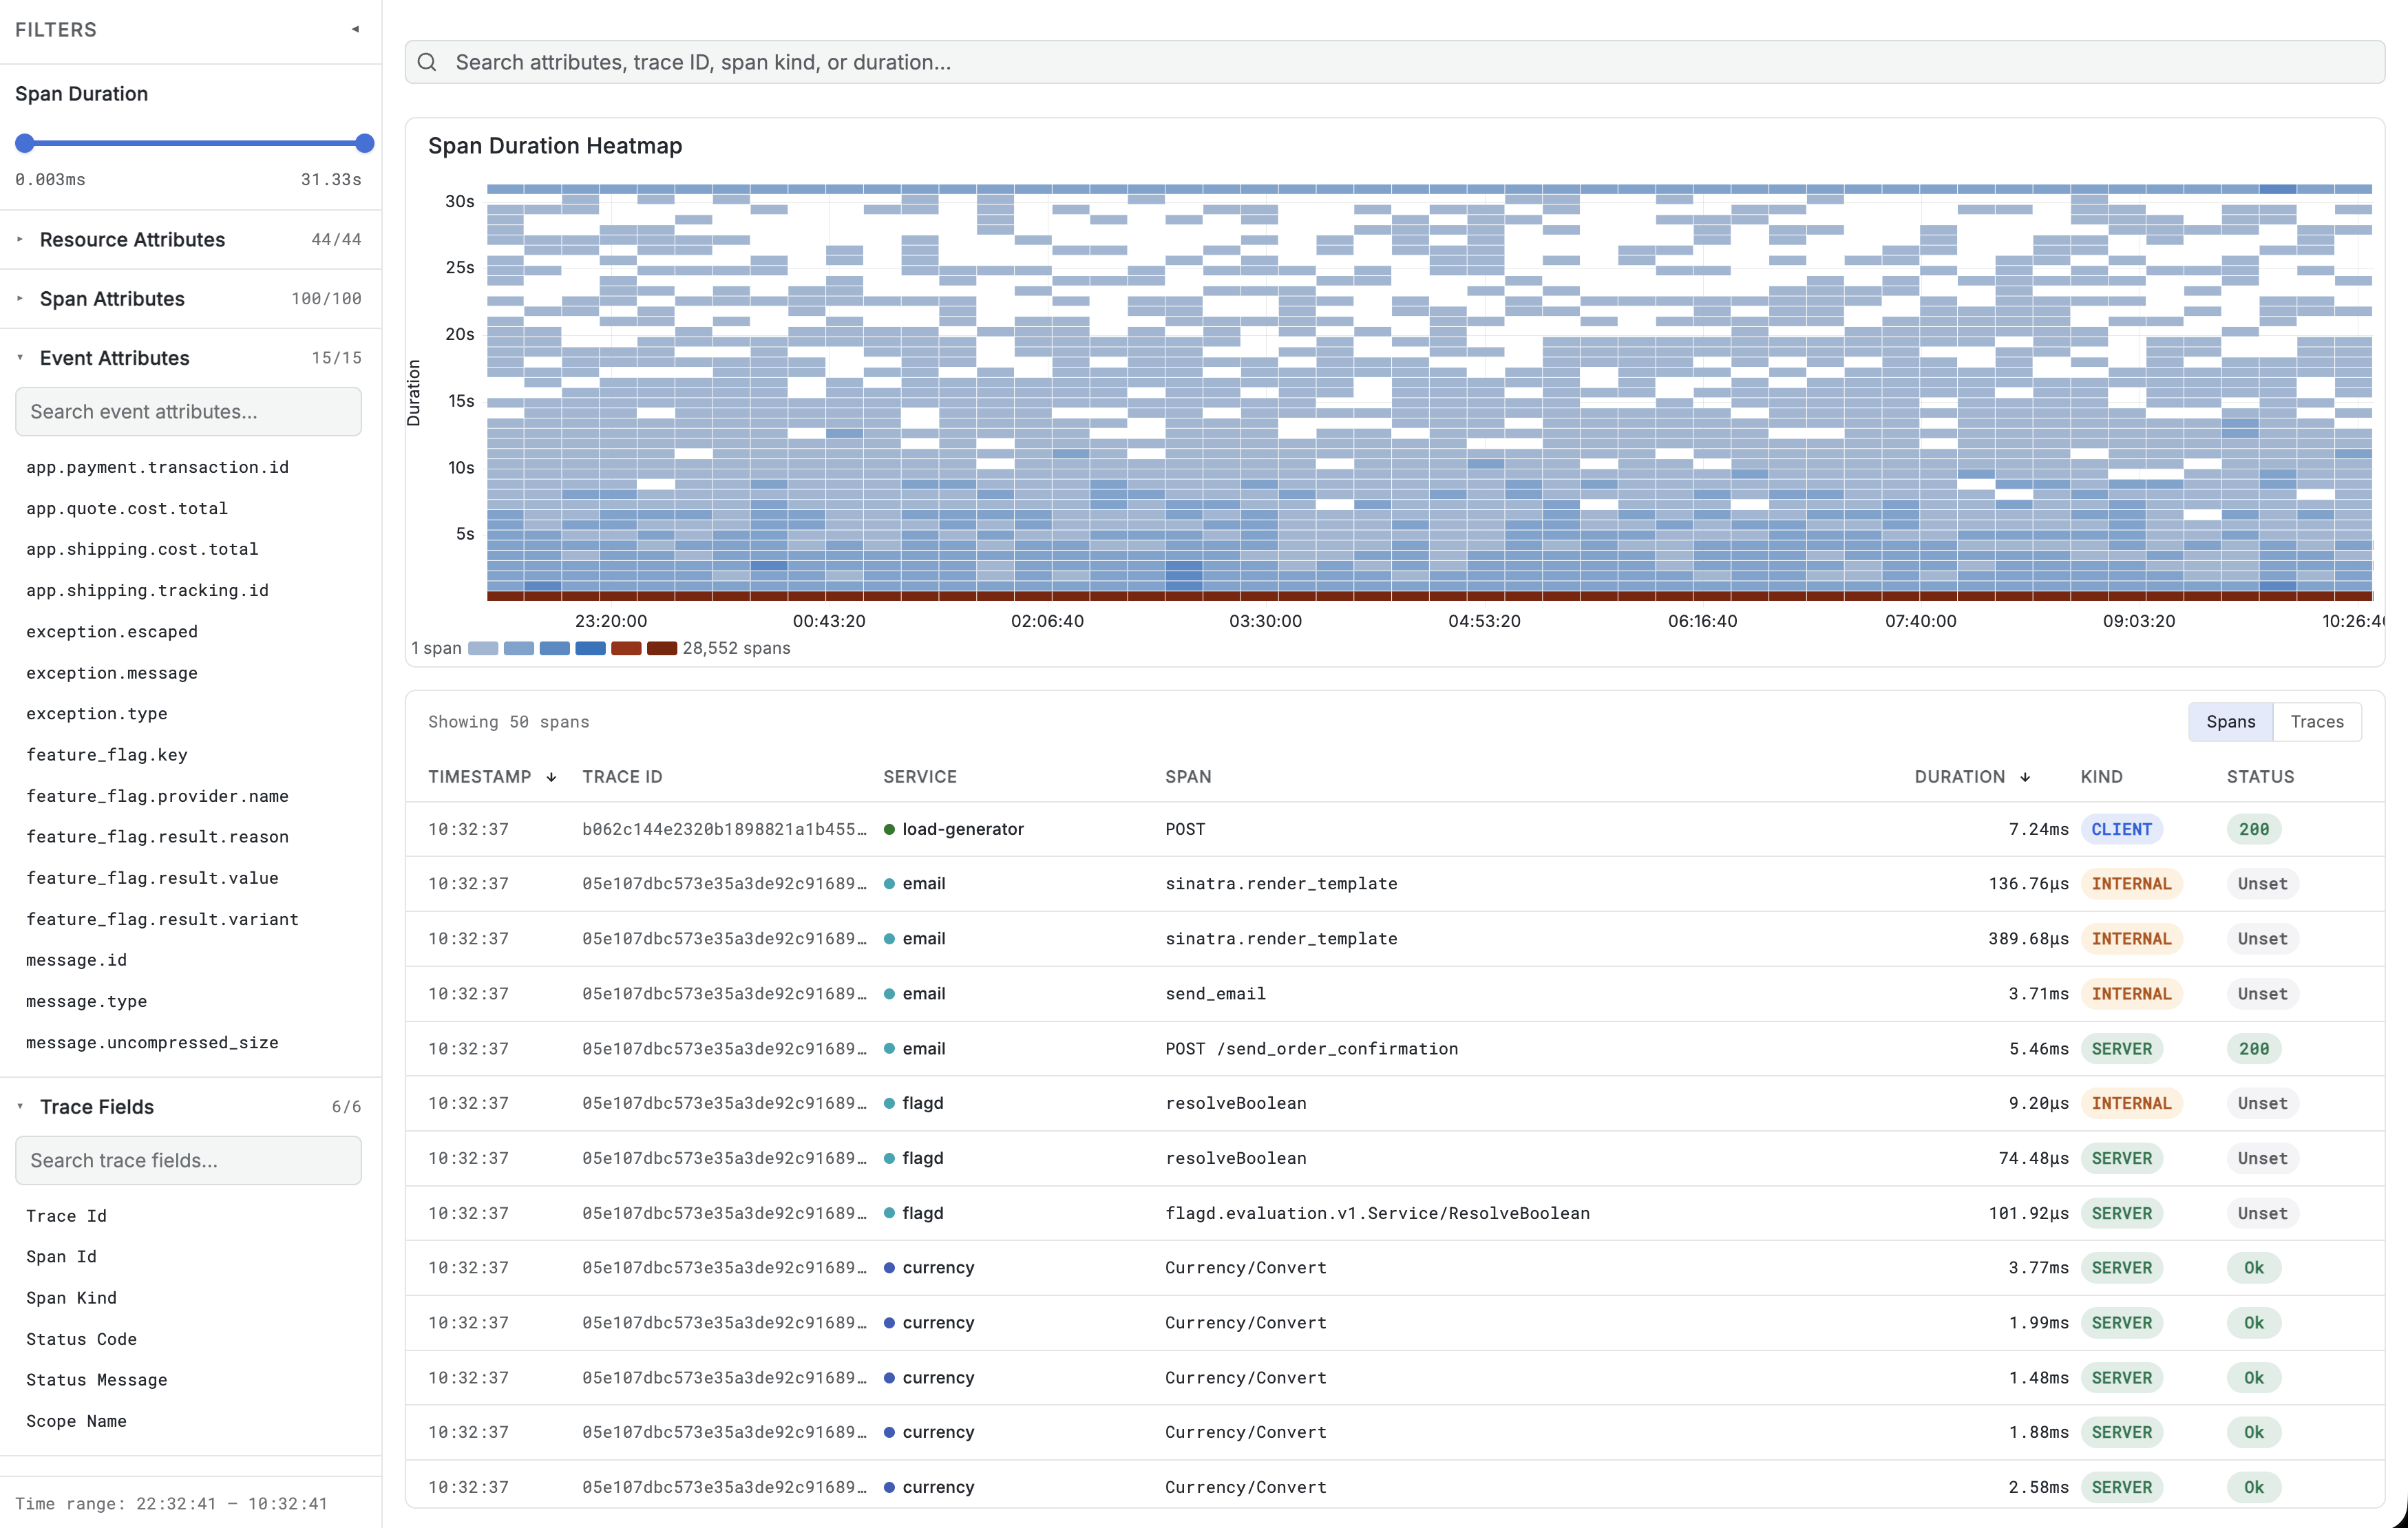
How Context Carries Over
Depending on the origin, APM passes some or all of these values to traceX:
- Time range.
- Environment.
- Service name.
- Span or operation name.
- Trace ID and span ID for an exact occurrence.
- Error status when the drill-down requires failed traces.
Inside the tab you have the complete traceX experience: trace search, duration visualizations, attribute filtering, and the trace waterfall with span details, events, and links.
See the traceX documentation for the complete guide.
Aggregate Search versus Exact Trace
APM offers two kinds of trace navigation:
- An aggregate link opens traceX with filters. Examples include a Service Map node or View traces for last 15 minutes from an operation detail.
- An occurrence link passes the trace ID and span ID. It opens the exact trace behind an operation, error, database execution, or message.
Drill-Through Origins
| Origin | Result in traceX |
|---|---|
| Operation detail occurrence | Exact trace and selected span |
| Operation detail 15-minute action | Traces for that service and operation during the last 15 minutes |
| Error occurrence | Exact trace and failing span |
| Database execution | Exact trace and database span |
| Messaging occurrence | Exact trace and messaging span |
| Service Map node | Traces scoped to the selected service |
| Service Map connection | Traces from the caller service |
Was this page helpful?