Getting Started with k8X
k8X is a Kubernetes fleet observability app built into base14 Scout. It gives you a single view across every cluster you run: cluster and node health, namespace resource commitment, workload rollouts, pod restarts, and the Kubernetes events that explain them.
One pass through every tab, ending on the pod detail panel that explains a crash loop:
k8X is read-only. It reports what your clusters are doing and never changes them: there is no path from k8X to the Kubernetes API.
k8X reads two planes of telemetry from the Scout Telemetry Data Lake. The
first is metrics, from the k8s_cluster and kubeletstats receivers: node
capacity, pod phases, workload replica counts, CPU and memory usage. The
second is Kubernetes object snapshots, from the k8sobjects receiver, which
ships each watched object as a log record carrying the object's own JSON.
Everything the metrics do not model comes from that second plane - labels,
owner references, ages, deployment strategy, node taints, kubelet versions,
PVC phases, and resource quotas. Both planes have to be configured for k8X to
fill in completely.
Before You Start
k8X needs a collector already shipping Kubernetes telemetry to Scout. Start with the base setup:
- Kubernetes Helm setup to deploy the collector
- K8s Cluster for the cluster-scoped metrics and events
- Kubelet Stats for the per-node pod and container metrics
On top of that base, k8X needs a few specific settings. Each one below backs a part of the interface that is otherwise blank.
receivers:
  k8s_cluster:
    auth_type: serviceAccount
    collection_interval: 60s
    node_conditions_to_report:
      [Ready, MemoryPressure, DiskPressure, PIDPressure, NetworkUnavailable]
    # `pods` is the denominator for the Nodes tab's pod-capacity column.
    allocatable_types_to_report:
      [cpu, memory, ephemeral-storage, storage, pods]
    resource_attributes:
      k8s.container.status.last_terminated_reason:
        enabled: true
    metrics:
      k8s.pod.status_reason:
        enabled: true
      k8s.node.condition:
        enabled: true
      k8s.container.cpu_request:
        enabled: true
      k8s.container.memory_request:
        enabled: true
      k8s.container.cpu_limit:
        enabled: true
      k8s.container.memory_limit:
        enabled: true

  k8sobjects:
    auth_type: serviceAccount
    objects:
      - name: events
        mode: watch
        exclude_watch_type: [DELETED]
        group: events.k8s.io
      - name: pods
        mode: pull
        interval: 60s
      - name: nodes
        mode: pull
        interval: 60s
      - name: resourcequotas
        mode: pull
        interval: 60s
      - name: persistentvolumeclaims
        mode: pull
        interval: 60s
      - name: deployments
        mode: pull
        interval: 60s
        group: apps
      - name: replicasets
        mode: pull
        interval: 60s
        group: apps
      - name: daemonsets
        mode: pull
        interval: 60s
        group: apps
      - name: statefulsets
        mode: pull
        interval: 60s
        group: apps
| Setting | What it backs |
|---|---|
allocatable_types_to_report including pods | The Nodes tab's Pods column. Without it there is no capacity denominator, so the column shows a bare count instead of 31/58 |
k8s.container.cpu_request and k8s.container.memory_request | The Namespaces tab's used-versus-requested columns, and the node detail panel's Committed section |
k8s.pod.status_reason | Pod statuses beyond the phase, such as Evicted |
k8s.node.condition | The Nodes tab's pressure statuses and the node detail panel's Conditions section |
k8s.container.status.last_terminated_reason | The pod panel's Last state: OOMKilled (exit 137) line |
k8sobjects object snapshots | Ages, owner references, taints, kubelet versions, deployment strategy, image digests, PVC phases, and quotas - everywhere these appear |
Pull objects, watch events
The two kinds of record need opposite modes, and each mode is wrong for the other kind.
Object snapshots must use mode: pull. k8X reads the latest snapshot per
object within a trailing window, and a watch only fires when an object
changes. A Deployment that has been stable for a week would emit once when the
collector started and then never again, so it would vanish from k8X entirely.
The repeated pull is what keeps a stable object visible.
Events must use mode: watch. k8X dedupes events by UID and orders them
by the event's own timestamp, so re-shipping the same event every interval
adds rows without adding information. Under mode: pull every event the API
server still holds is collected again at each interval, so one event can be
stored dozens of times over its lifetime. A watch emits each event once, when
it happens, which is what the app expects.
mode: watch wraps each record in an envelope,
{"type": "ADDED", "object": {...}}, rather than writing the object directly.
k8X unwraps it, so events collected this way read normally. Add
exclude_watch_type: [DELETED] so deletions do not arrive as events in their
own right.
Drop Normal events at the collector
Kubernetes emits a Normal event for routine activity - every image pull,
every successful schedule, every probe that starts passing. These outnumber
Warning events heavily and nothing in k8X reads them, so the recommended
pipeline drops them before they leave the cluster:
processors:
  filter/k8s-events-warning:
    error_mode: ignore
    logs:
      log_record:
        # `mode: watch` writes the envelope; `mode: pull` writes the object.
        - 'IsMap(body) and body["object"]["kind"] == "Event"
           and body["object"]["type"] != "Warning"'
        - 'IsMap(body) and body["kind"] == "Event"
           and body["type"] != "Warning"'
Place it before batch in the pipeline carrying k8sobjects. Both conditions
are needed only if you run a mix of modes; each is harmless when it matches
nothing. Object snapshots are untouched - the conditions test for Event
records specifically, so Deployments, quotas and the rest pass through.
With this filter in place the Events tab shows Warning events
only: its Type facet carries a single value and Event volume draws one
series. Everything else in k8X is unaffected, including the Overview tab's
Warning events card, which never counted Normal events.
Get the API groups right
Deployments, ReplicaSets, DaemonSets and StatefulSets live in the apps API
group. ResourceQuotas and PersistentVolumeClaims are core resources and take
no group: at all. Spellings like deployments.k8s.io or
resourcequotas.k8s.io are not real API groups, and the objects they name are
never collected.
Keep the owner attributes on your metrics
The k8sattributes processor is what puts ownership onto pod metrics. Its
extract list must include the owner UIDs and names:
processors:
  k8sattributes:
    auth_type: serviceAccount
    extract:
      metadata:
        - k8s.namespace.name
        - k8s.pod.name
        - k8s.pod.uid
        - k8s.node.name
        - k8s.replicaset.uid
        - k8s.replicaset.name
        - k8s.deployment.uid
        - k8s.deployment.name
        - k8s.daemonset.uid
        - k8s.daemonset.name
        - k8s.statefulset.uid
        - k8s.statefulset.name
        - container.image.name
        - container.image.tag
Without these there is no join key between a pod and the workload that owns it, and the Workloads tab cannot attribute pods to their owners.
The object-snapshot pipeline is deliberately not enriched by
k8sattributes - the record body is the whole object, and the metadata is
already inside it.
Run one agent replica
Run exactly one replica of the collector carrying k8s_cluster and
k8sobjects. Both receivers watch the entire cluster, so a second replica
double-counts every node, workload and event.
Interface Overview
Every k8X tab shares the same chrome:


| Section | Description |
|---|---|
| Cluster Selector | Scope every panel to one or more clusters. Reads All Clusters, the cluster's name, or N selected |
| Namespace Selector | Scope to one or more namespaces. Reads All, the namespace name, or N selected |
| Search | Free-text search across resource names and labels on the current tab. Press / anywhere to focus it |
| Navigation Tabs | Switch between Overview, Clusters, Events, Nodes, Namespaces, and Workloads |
| Time Picker | Set the time range for every panel on the page |
| Refresh | Re-run the current tab's queries |
| Filters Sidebar | Narrow by cluster, status, role, owner, and other facets. On every tab except Overview and Clusters |
Two behaviors are worth knowing up front:
- Tables gain a Cluster column only when more than one cluster is configured. It reflects your configuration, not your current selection, so the column stays put when you narrow to a single cluster.
- If you pick a range longer than your deployment allows, k8X clamps it and
says so:
Selected range exceeds the maximum allowed (24h). Showing Jan 5, 09:00 → Jan 6, 09:00.The default maximum is 24 hours.
Every chart supports brush-select: drag across a spike to narrow the whole page's time range to it.
Select Your Clusters
k8X addresses each cluster by the service.name its collector writes, which
becomes the ServiceName in the telemetry tables. Every query is pinned to
that list.
The name k8X wants is the one set on the Kubernetes pipelines, not one of
the per-workload names elsewhere in the same file. A collector configuration
typically sets service.name many times over - once for each application
whose logs or metrics it ships - and those are logX and APM service names. The
cluster's name is the one applied to the pipelines carrying k8s_cluster and
k8sobjects, by convention the cluster's own name:
processors:
  resource/k8s:
    attributes:
      # This value is what k8X lists as a cluster. `upsert` so it wins over
      # any service.name an earlier processor set.
      - key: service.name
        value: my-cluster-name
        action: upsert

service:
  pipelines:
    metrics/k8s:
      receivers: [k8s_cluster, kubeletstats]
      processors: [memory_limiter, resource/k8s, k8sattributes, batch]
      exporters: [otlphttp/b14]
    logs/k8s-objects:
      receivers: [k8sobjects]
      processors: [memory_limiter, filter/k8s-events-warning, resource/k8s, batch]
      exporters: [otlphttp/b14]
This is the setting to check first when something looks wrong, because a list that does not match what your collectors write produces an empty screen rather than an error. If k8X shows no clusters while your collector is running, compare the Kubernetes service names field on the k8X configuration page against the value above.
Leaving the field blank inherits the list set when your Scout instance was
deployed, which falls back to k8s if nobody set one. That works only if your
collectors write exactly that name, so fill the field in whenever they write
anything else - and they must, as soon as you have more than one cluster.
One case is easy to miss. Some collector configurations set a different
service.name on the events pipeline than on the metrics pipeline, so a
cluster arrives under two names and the Events tab is empty while every other
tab has data. Either align the two pipelines on one name, as above, or list
both names in the field.
Set the Time Range
Use the time picker to scope every panel to a window. All charts, tables and breakdowns update to the selected range.
Two things are measured against the window rather than against all time:
- Restart severity. The restart count shown in a table cell is the pod's lifetime counter, but the color reflects restarts within the selected window. Widening the range lights up more rows without the numbers changing.
- Event coverage. A cluster that shipped no events in the window is reported as missing, even if it has shipped events before.
Health Thresholds
k8X colors a value when it crosses these thresholds. Hovering a colored value names the state.
| Measure | Elevated (orange) | Critical (red) |
|---|---|---|
| CPU utilization | 80% of allocatable | 95% of allocatable |
| Memory utilization | 75% of allocatable | 90% of allocatable |
| Restarts in window | 1 restart | 3 restarts |
Filters
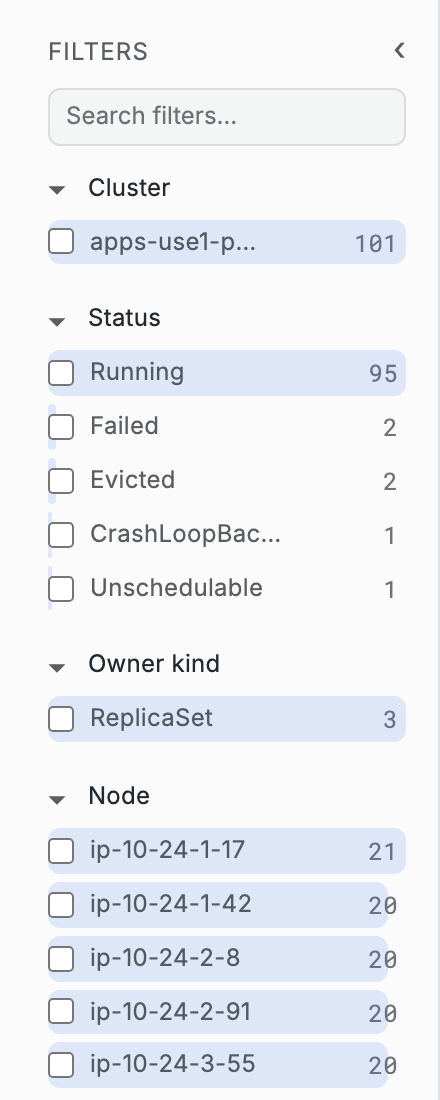
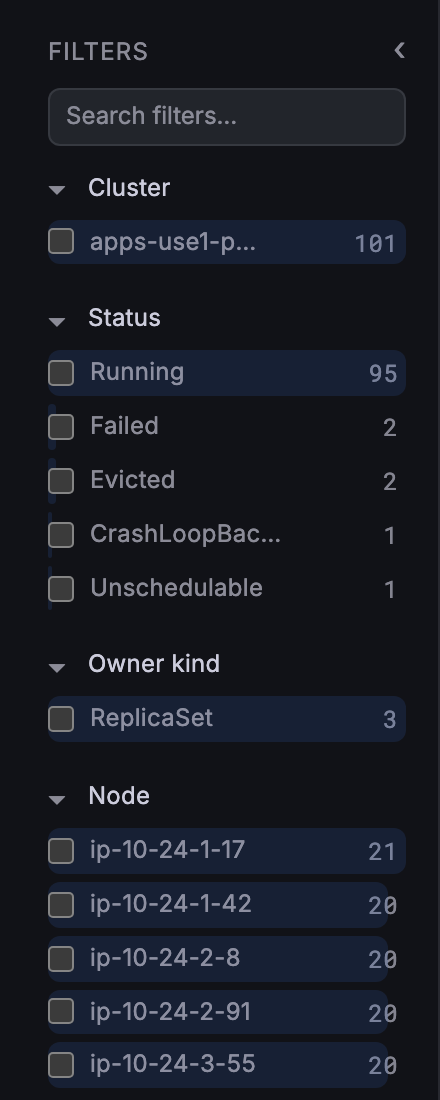
Every tab except Overview and Clusters has a Filters sidebar. The available facets depend on the tab - Nodes offers node attributes, Workloads offers pod and owner attributes - and each tab's guide lists its own.
Shared behavior across every facet sidebar:
- Clear all removes every active selection; individual selections also appear as removable chips at the top
- Hovering a value reveals an only button that selects just that value
- Each value carries a count of matching rows
- Long lists page with Load 50 more
- A facet with nothing to show reads
No values in this window. - The sidebar collapses to a rail, and its width is remembered
Configuration
Open Configuration from the k8X app menu to change these settings.
| Setting | Default | Description |
|---|---|---|
| Database | default | The database holding the OpenTelemetry metric and log tables |
| Kubernetes service names | inherited | Comma-separated ServiceName values, one per cluster. Leave blank to inherit the value set when your Scout instance was deployed |
| Table view | Scrolling | Whether tables scroll continuously or use page controls |
| Rows per page | 10 | Rows per page in pagination mode, from 1 to 100 |
The page also shows a read-only Limits section - maximum time range, query timeout, and default data source. These are managed by whoever deployed your Scout instance; contact base14 support to change them.
FAQ
Why is k8X empty when my collector is running?
The most common cause is a cluster list that does not match your collectors.
k8X addresses each cluster by the service.name its collector writes, and a
list that does not match returns no rows rather than an error. Check the
Kubernetes service names field on the configuration page against the
service.name your collector sets, or clear the field to inherit the deployed
value. If the cluster list is right, check that the time range covers a period
when the collector was running.
Why do my Deployments not appear when pods do?
Pods appear from metrics alone, but Deployments, DaemonSets, StatefulSets and
ReplicaSets come from k8sobjects snapshots. Two settings usually explain the
gap. First, the objects must be collected in mode: pull, because a watch
only fires when an object changes and a stable Deployment would never re-emit.
Second, the workload objects live in the apps API group - a config naming
deployments.k8s.io collects nothing.
Does k8X need a separate collector from the one collecting my metrics?
No. k8X reads the same collector deployment you already run for Kubernetes
metrics; it needs extra receivers and metrics enabled on it, not a second
pipeline. The one constraint is that the collector carrying k8s_cluster and
k8sobjects must run as a single replica, because both receivers watch the
whole cluster and a second replica would double-count everything.
Related Guides
- Overview - Fleet health at a glance
- Clusters - Per-cluster capacity and node readiness
- Nodes - Node conditions, capacity, and scheduled pods
- Namespaces - Resource commitment and quotas
- Workloads - Pods, Deployments, DaemonSets, StatefulSets, and ReplicaSets
- Events - Kubernetes events across the fleet
- Kubernetes Helm setup — Deploy the collector
- K8s Cluster - Cluster-scoped metrics and events
- Kubelet Stats - Per-node pod and container metrics