k8X Events
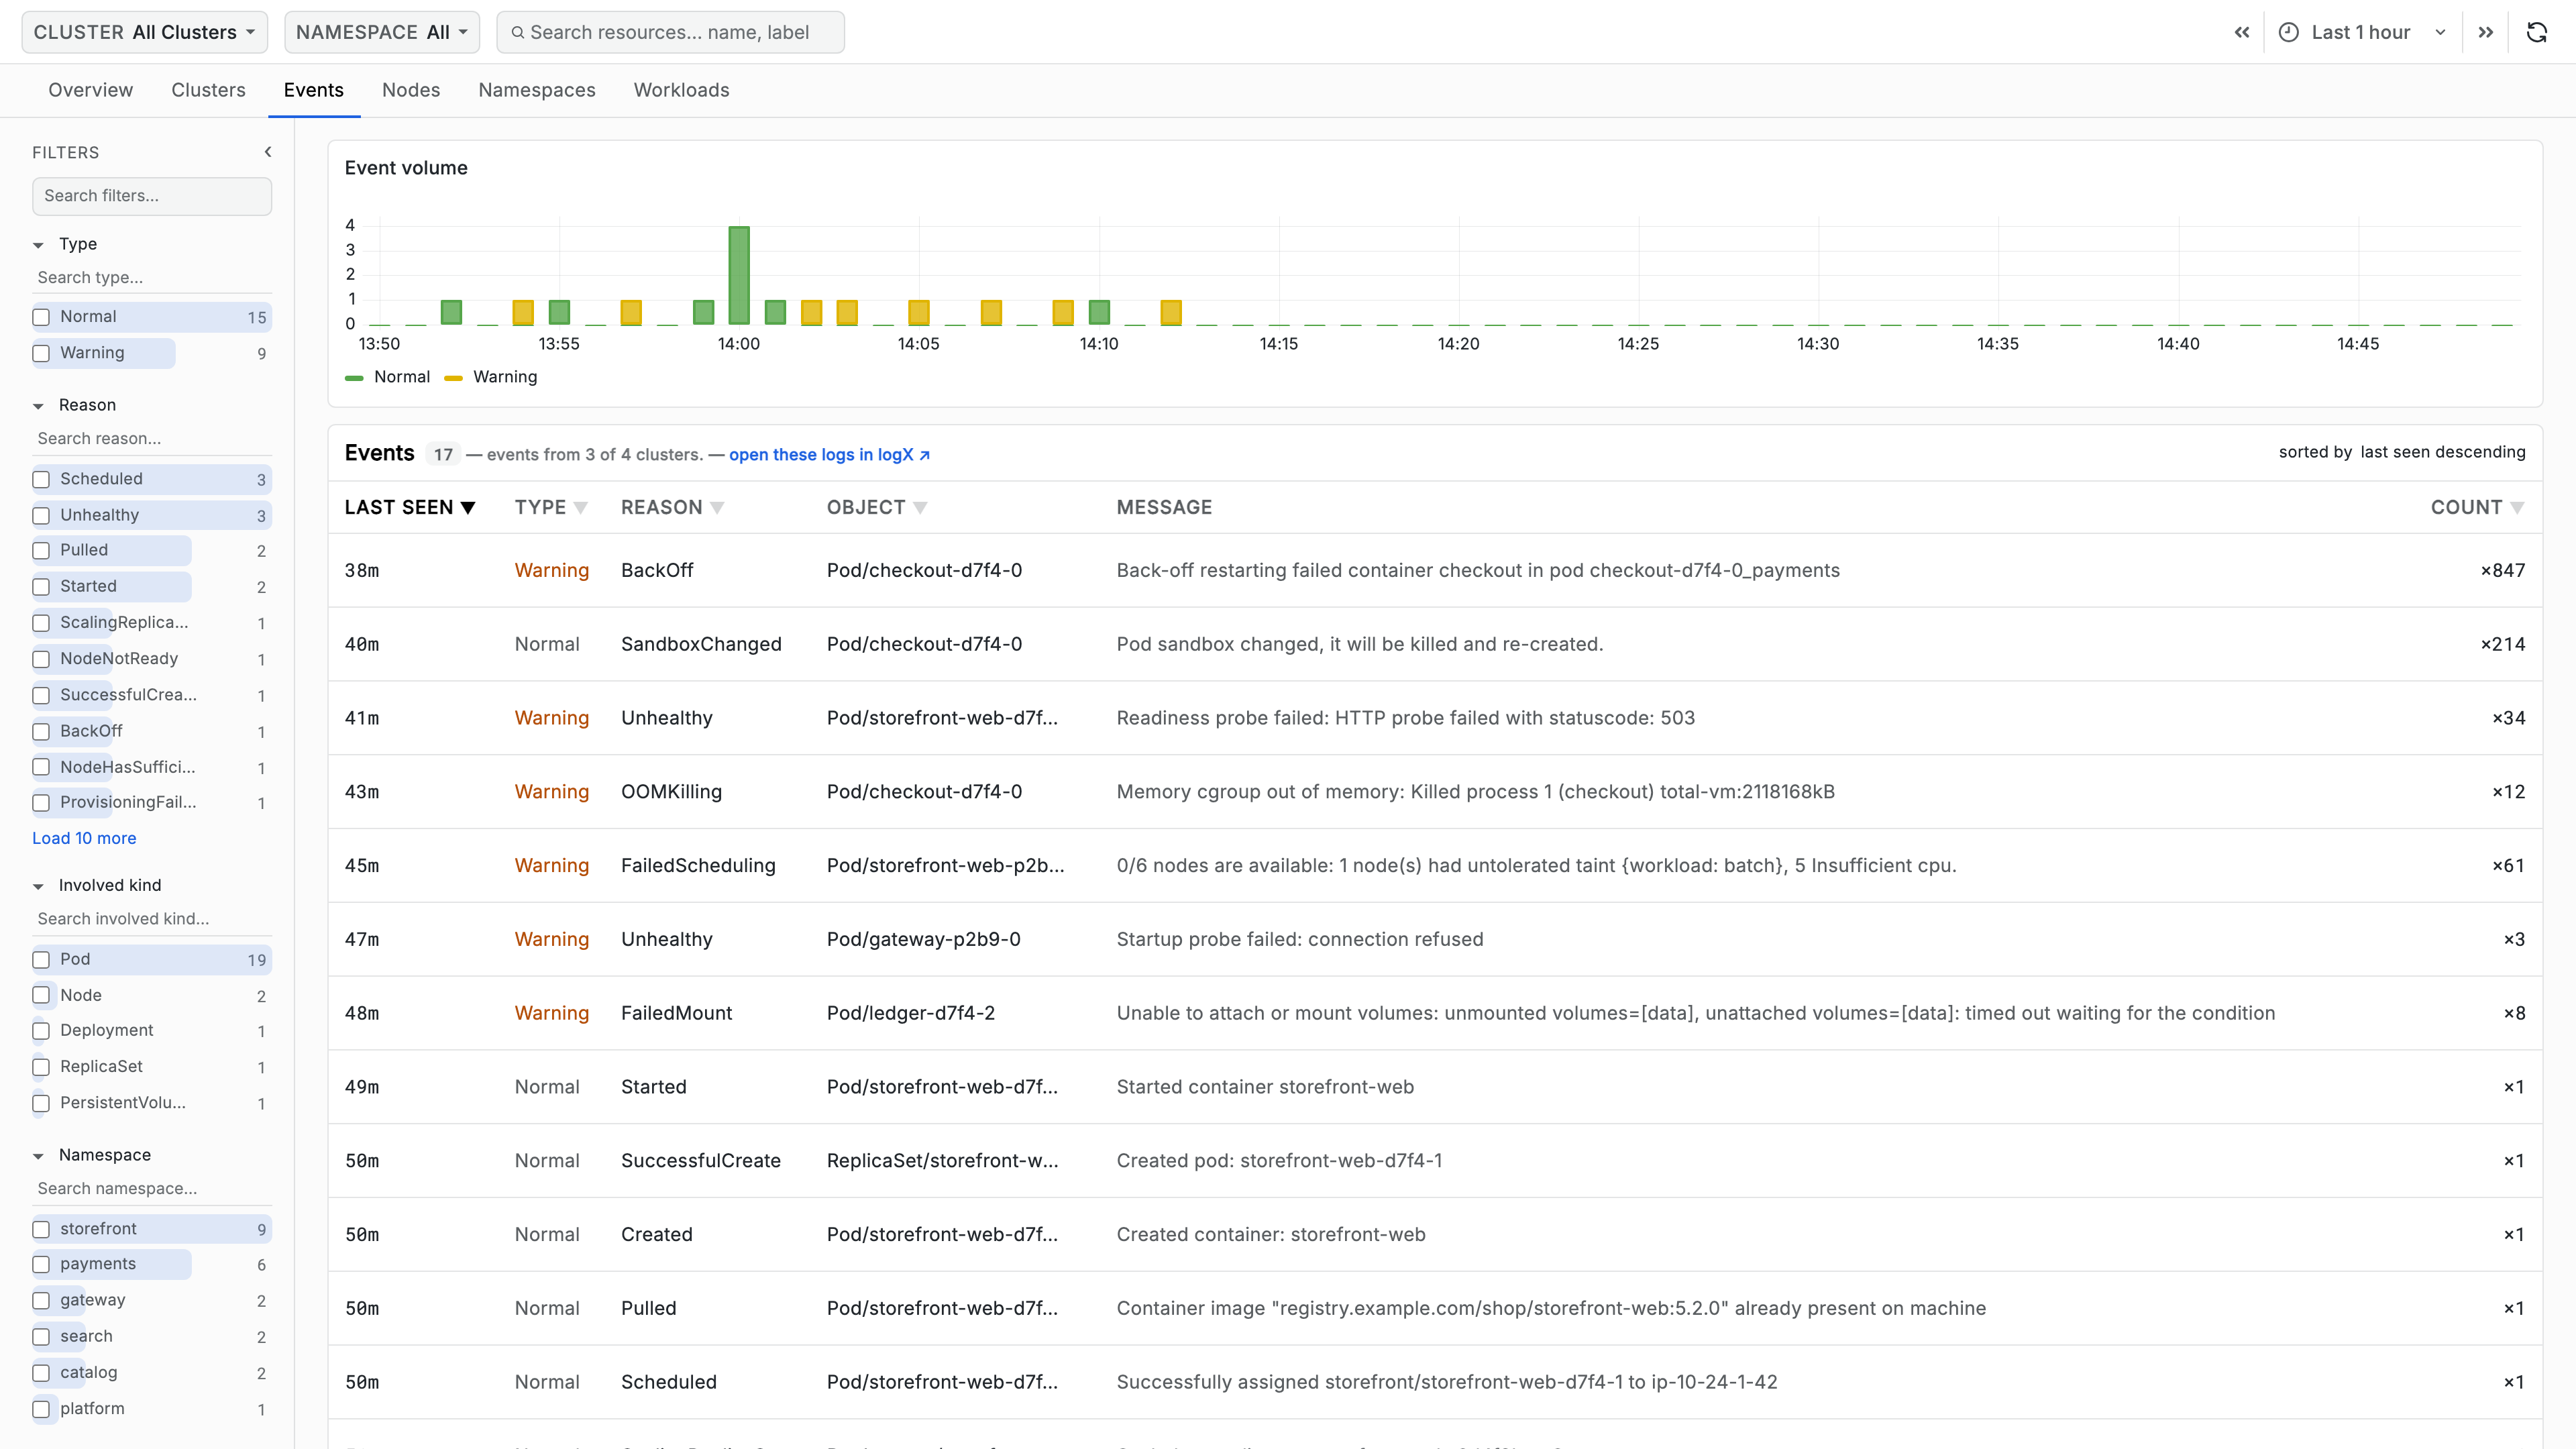
The Events tab is the Kubernetes event stream across every cluster in
scope. Where the other tabs show that something is wrong, events usually say
why: FailedScheduling names the constraint that could not be met,
OOMKilling names the container that exceeded its limit, Unhealthy names
the probe that failed.
Events are the one part of k8X that depends entirely on the k8sobjects
receiver. If this tab is empty while the other tabs have data, that receiver
is the thing to check.
Where the collector drops Normal events before export - the recommended
configuration - this tab shows Warning events only.
Filters
| Facet | Use it to... |
|---|---|
| Type | Separate Warning from Normal. Usually a single value, because the recommended pipeline ships Warning events only |
| Reason | Narrow to one kind of problem, such as FailedScheduling, OOMKilling, or BackOff |
| Involved kind | Narrow to events about Pod, Node, Deployment, and so on |
| Namespace | Narrow to one namespace |
This is the only tab whose facets can be searched and paged on the server, so a cluster with hundreds of distinct reasons stays navigable. Each facet has its own search box, and long lists page with Load 50 more.
Arriving here from the Overview tab's Warning events card pre-selects
Warning under Type.
Event Volume
A stacked bar chart of event counts over the window, one series per type.
Where the collector ships Warning events only, as recommended, that is a
single series and every bar is signal. Drag across a spike to narrow the
page's time range.
Event List
| Column | Description |
|---|---|
| Last seen | How long ago the event last fired: 12s, 4m, 3h, 2d |
| Type | Warning in orange, or Normal |
| Reason | The Kubernetes event reason |
| Object | The object it concerns, as Pod/checkout-7d9f |
| Message | The full message, clamped to two lines - hover for the rest |
| Count | How many times it fired, as ×12 |
Newest first by default.
Count carries more than it looks: Kubernetes aggregates repeated events,
so one row reading ×340 is a tight failure loop, while forty rows at ×1
are forty separate problems.
The list is capped at the 500 most recent events, and says so when the cap is reached. Narrow the window or add filters to see beyond it.
Beside the panel title, a link reading open these logs in logX can appear. It opens logX on the same time range, scoped to the service and environment the events resolve to. It appears only when logX is installed in your Scout instance and the events in view resolve to a service.
Event Details
Select a row to open the raw Kubernetes object exactly as the receiver wrote it, as a collapsible JSON tree. The panel title is the event's reason, and its subtitle names the object and namespace.
This is where to look when the Message column has been truncated, or when you need a field the table does not show - the source component, the event's first-seen timestamp, or the full involved-object reference.
When Events Are Missing
k8X distinguishes two absences.
No events match the current filters. means the query worked and nothing
matched. Clear the filters or widen the window.
If k8X simply shows fewer events than kubectl get events does, the cause is
usually deliberate: the recommended pipeline drops Normal events at the
collector, so only Warning events ever reach Scout. See
Drop Normal events at the collector.
A message saying no Kubernetes events were found for the selected clusters -
none in this window and none outside it - means no events have ever arrived.
That is a collector problem, not an empty window. Check that k8sobjects is
collecting events from the events.k8s.io group, and that the service
account can list and watch events in both the core and events.k8s.io API
groups. See Before You Start.
Partial coverage appears as a note beside the panel title -
events from 4 of 10 clusters - with the silent clusters named on hover. The
usual cause is that k8sobjects is enabled on some clusters but not others.
Some events carry no cluster attribute. Those are shown against every cluster
rather than dropped, and the panel says all clusters when it is doing so.
Use Cases
Explaining a Pod That Will Not Schedule
- Filter Type to
Warningand Reason toFailedScheduling - Find the pod in Object
- Read Message - it names the constraint, whether that is insufficient CPU, a taint with no toleration, or no matching node selector
- Follow it to Nodes to confirm capacity or taints
Finding What Changed During an Incident
- Set the time picker to the incident window
- Filter Type to
Warning - Read the Event volume chart for when warnings started, then narrow the range to that moment by dragging across it
- Scan Reason for the first distinct failure - later events are usually consequences of it
Confirming a Memory Limit Is Too Low
- Filter Reason to
OOMKilling - Check Count - a high count on one object is a container that needs more memory, not a one-off
- Open the pod on Workloads and check Containers for the last terminated state, then Mem (GiB) against its limit
Related Guides
- Getting Started - Prerequisites, including the
k8sobjectsreceiver - Overview - Recent warning events at a glance
- Workloads - The pods and workloads these events concern
- Nodes - Node conditions behind scheduling failures
- logX - Application logs for the same services