k8X Workloads
The Workloads tab is where most k8X investigations end up. It covers pods and the four workload kinds that own them, with detail panels that tie a failing pod to its owner, its node, its images, and the events about it.
Sub-Tabs
| Sub-tab | Shows |
|---|---|
| All | Only the workloads that are not at their desired replica count |
| Pods | Every pod in scope |
| Deployments | Deployments, with rollout strategy and image |
| DaemonSets | DaemonSets, with node coverage |
| StatefulSets | StatefulSets, with storage |
| ReplicaSets | ReplicaSets, with their owning Deployment |
All is a shortlist, not a superset: it answers "what is broken right now" rather than "what is running". For everything running, use Pods or a kind sub-tab.
Filters
The available facets change with the sub-tab.
On All and Pods:
| Facet | Use it to... |
|---|---|
| Cluster | Narrow to one cluster |
| Status | Isolate a phase (Running, Pending, Succeeded, Failed, Unknown) or a container reason (CrashLoopBackOff, ImagePullBackOff, ContainerCreating, PodInitializing) |
| Owner kind | Separate Deployment-owned pods from Job or DaemonSet pods |
| Node | Narrow to pods on one node |
On the four kind sub-tabs, only Cluster and Namespace.
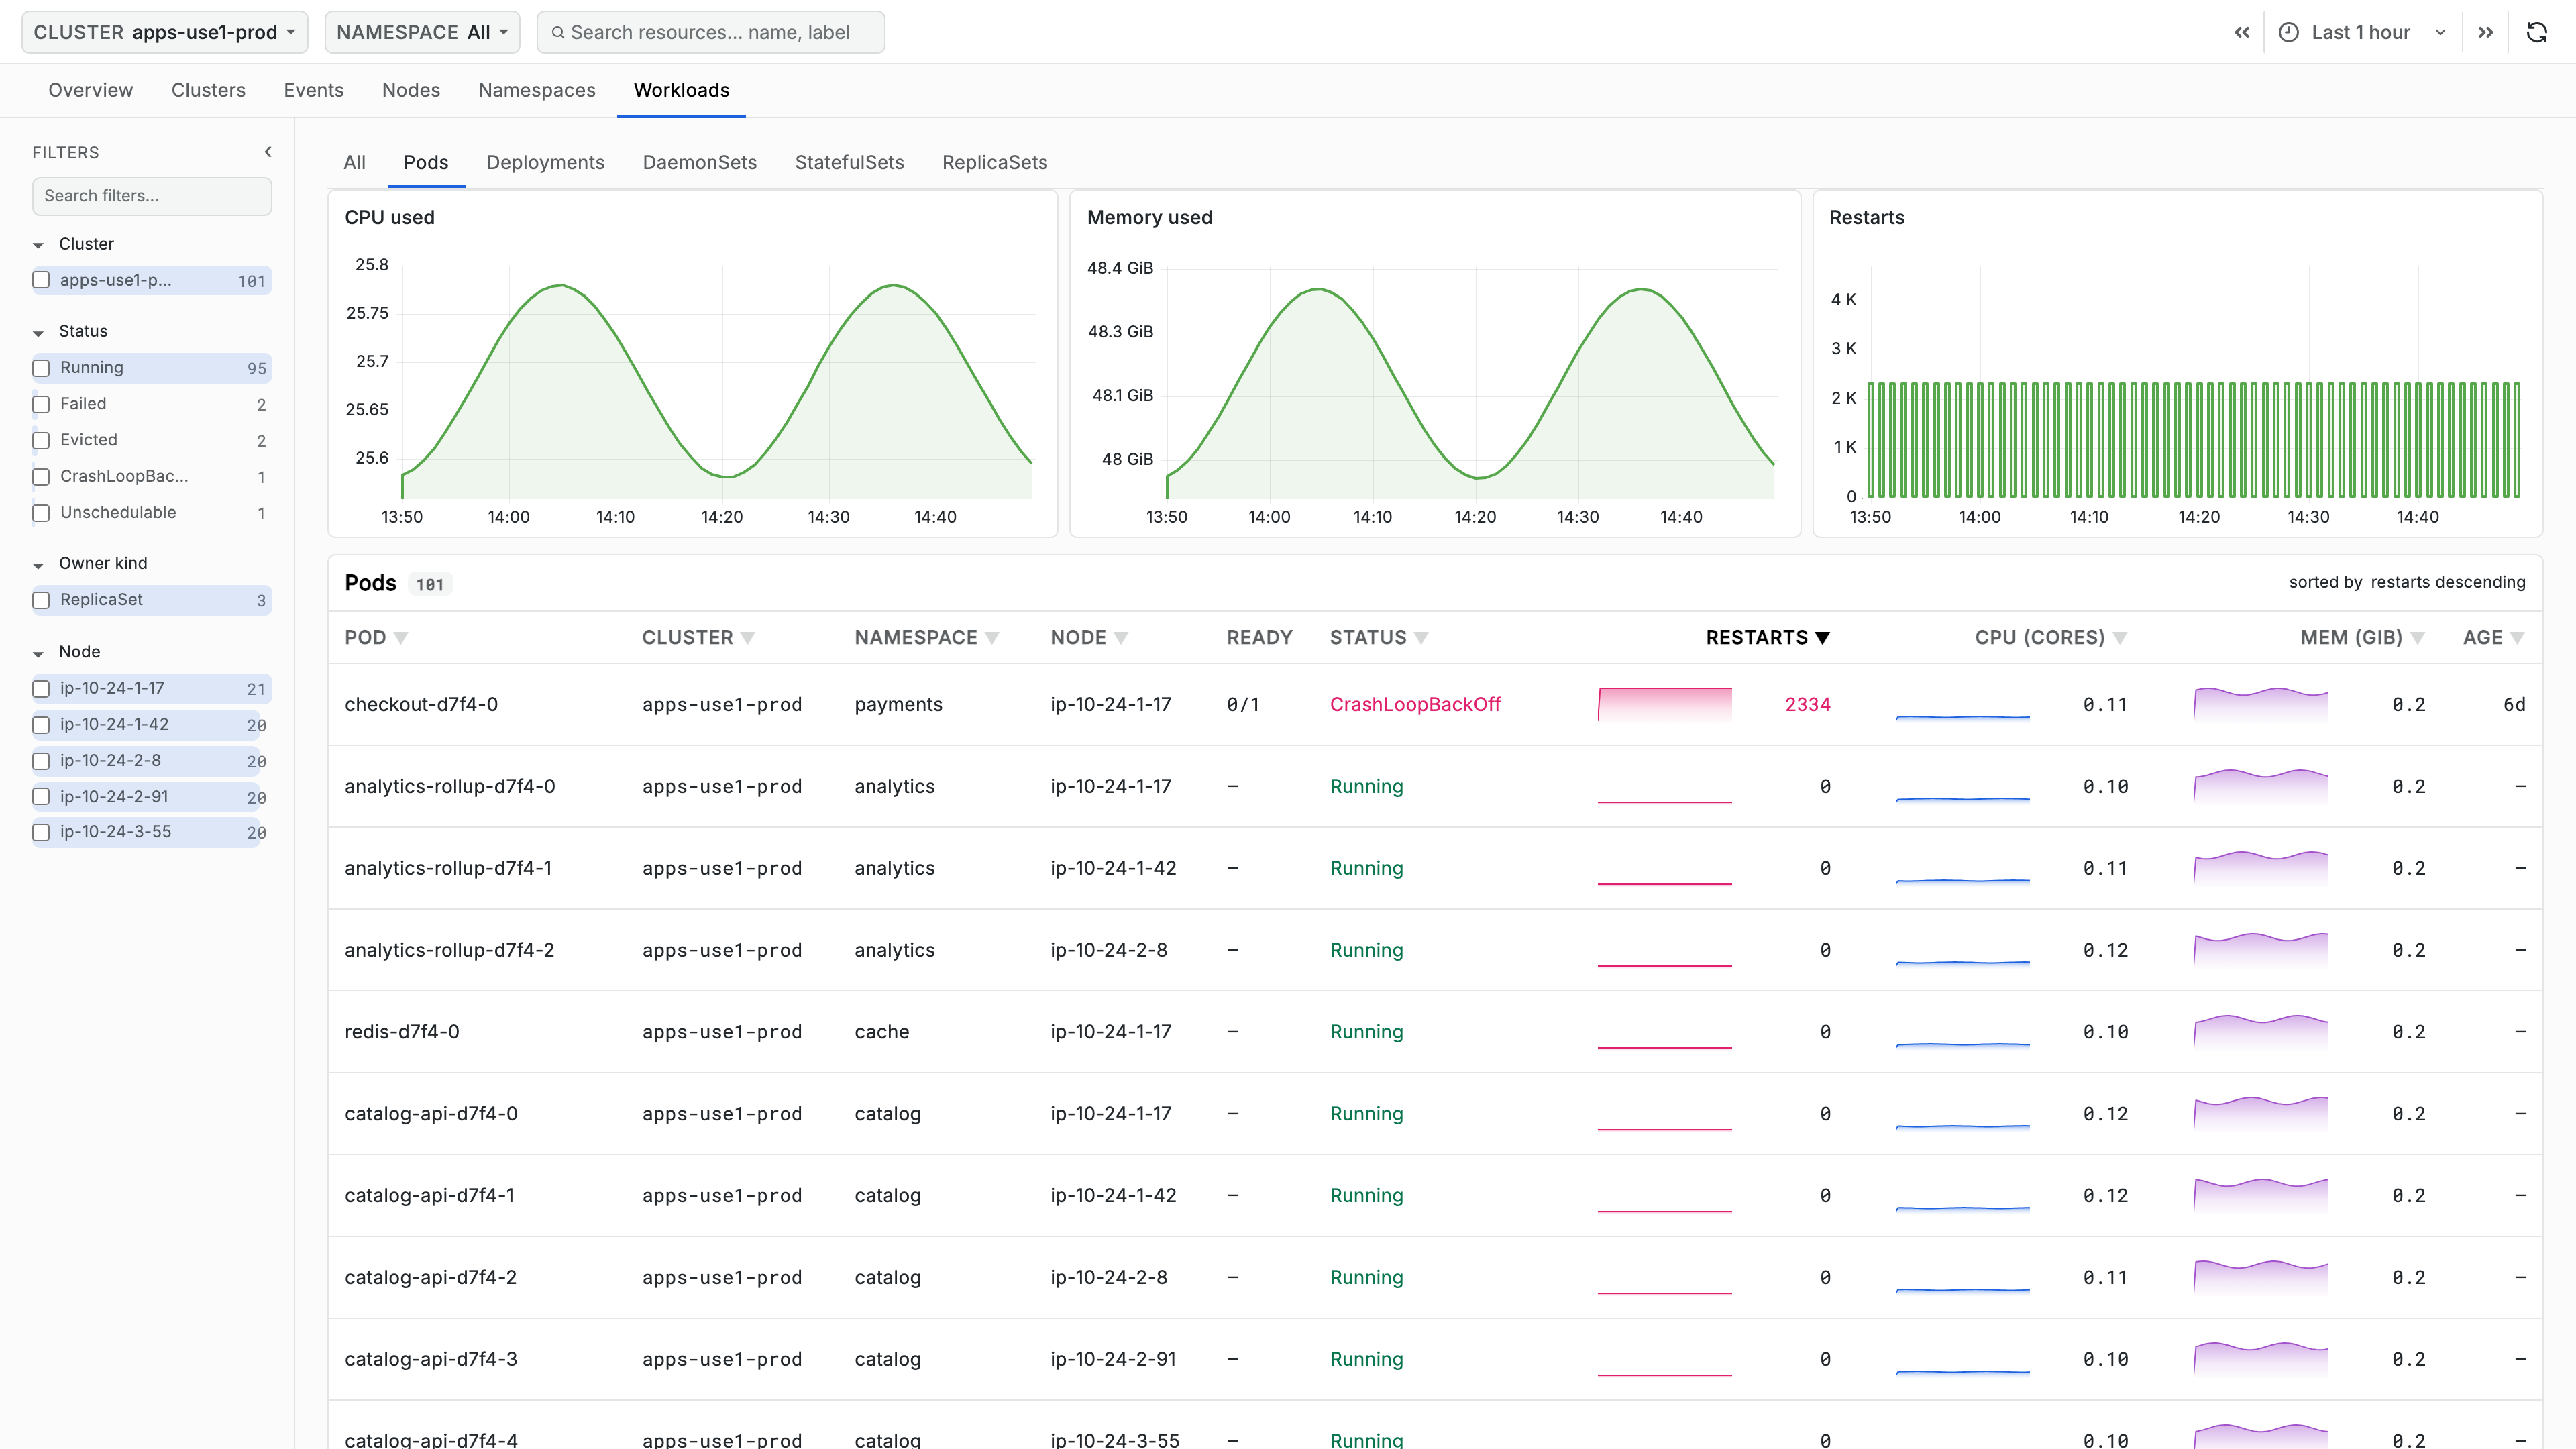
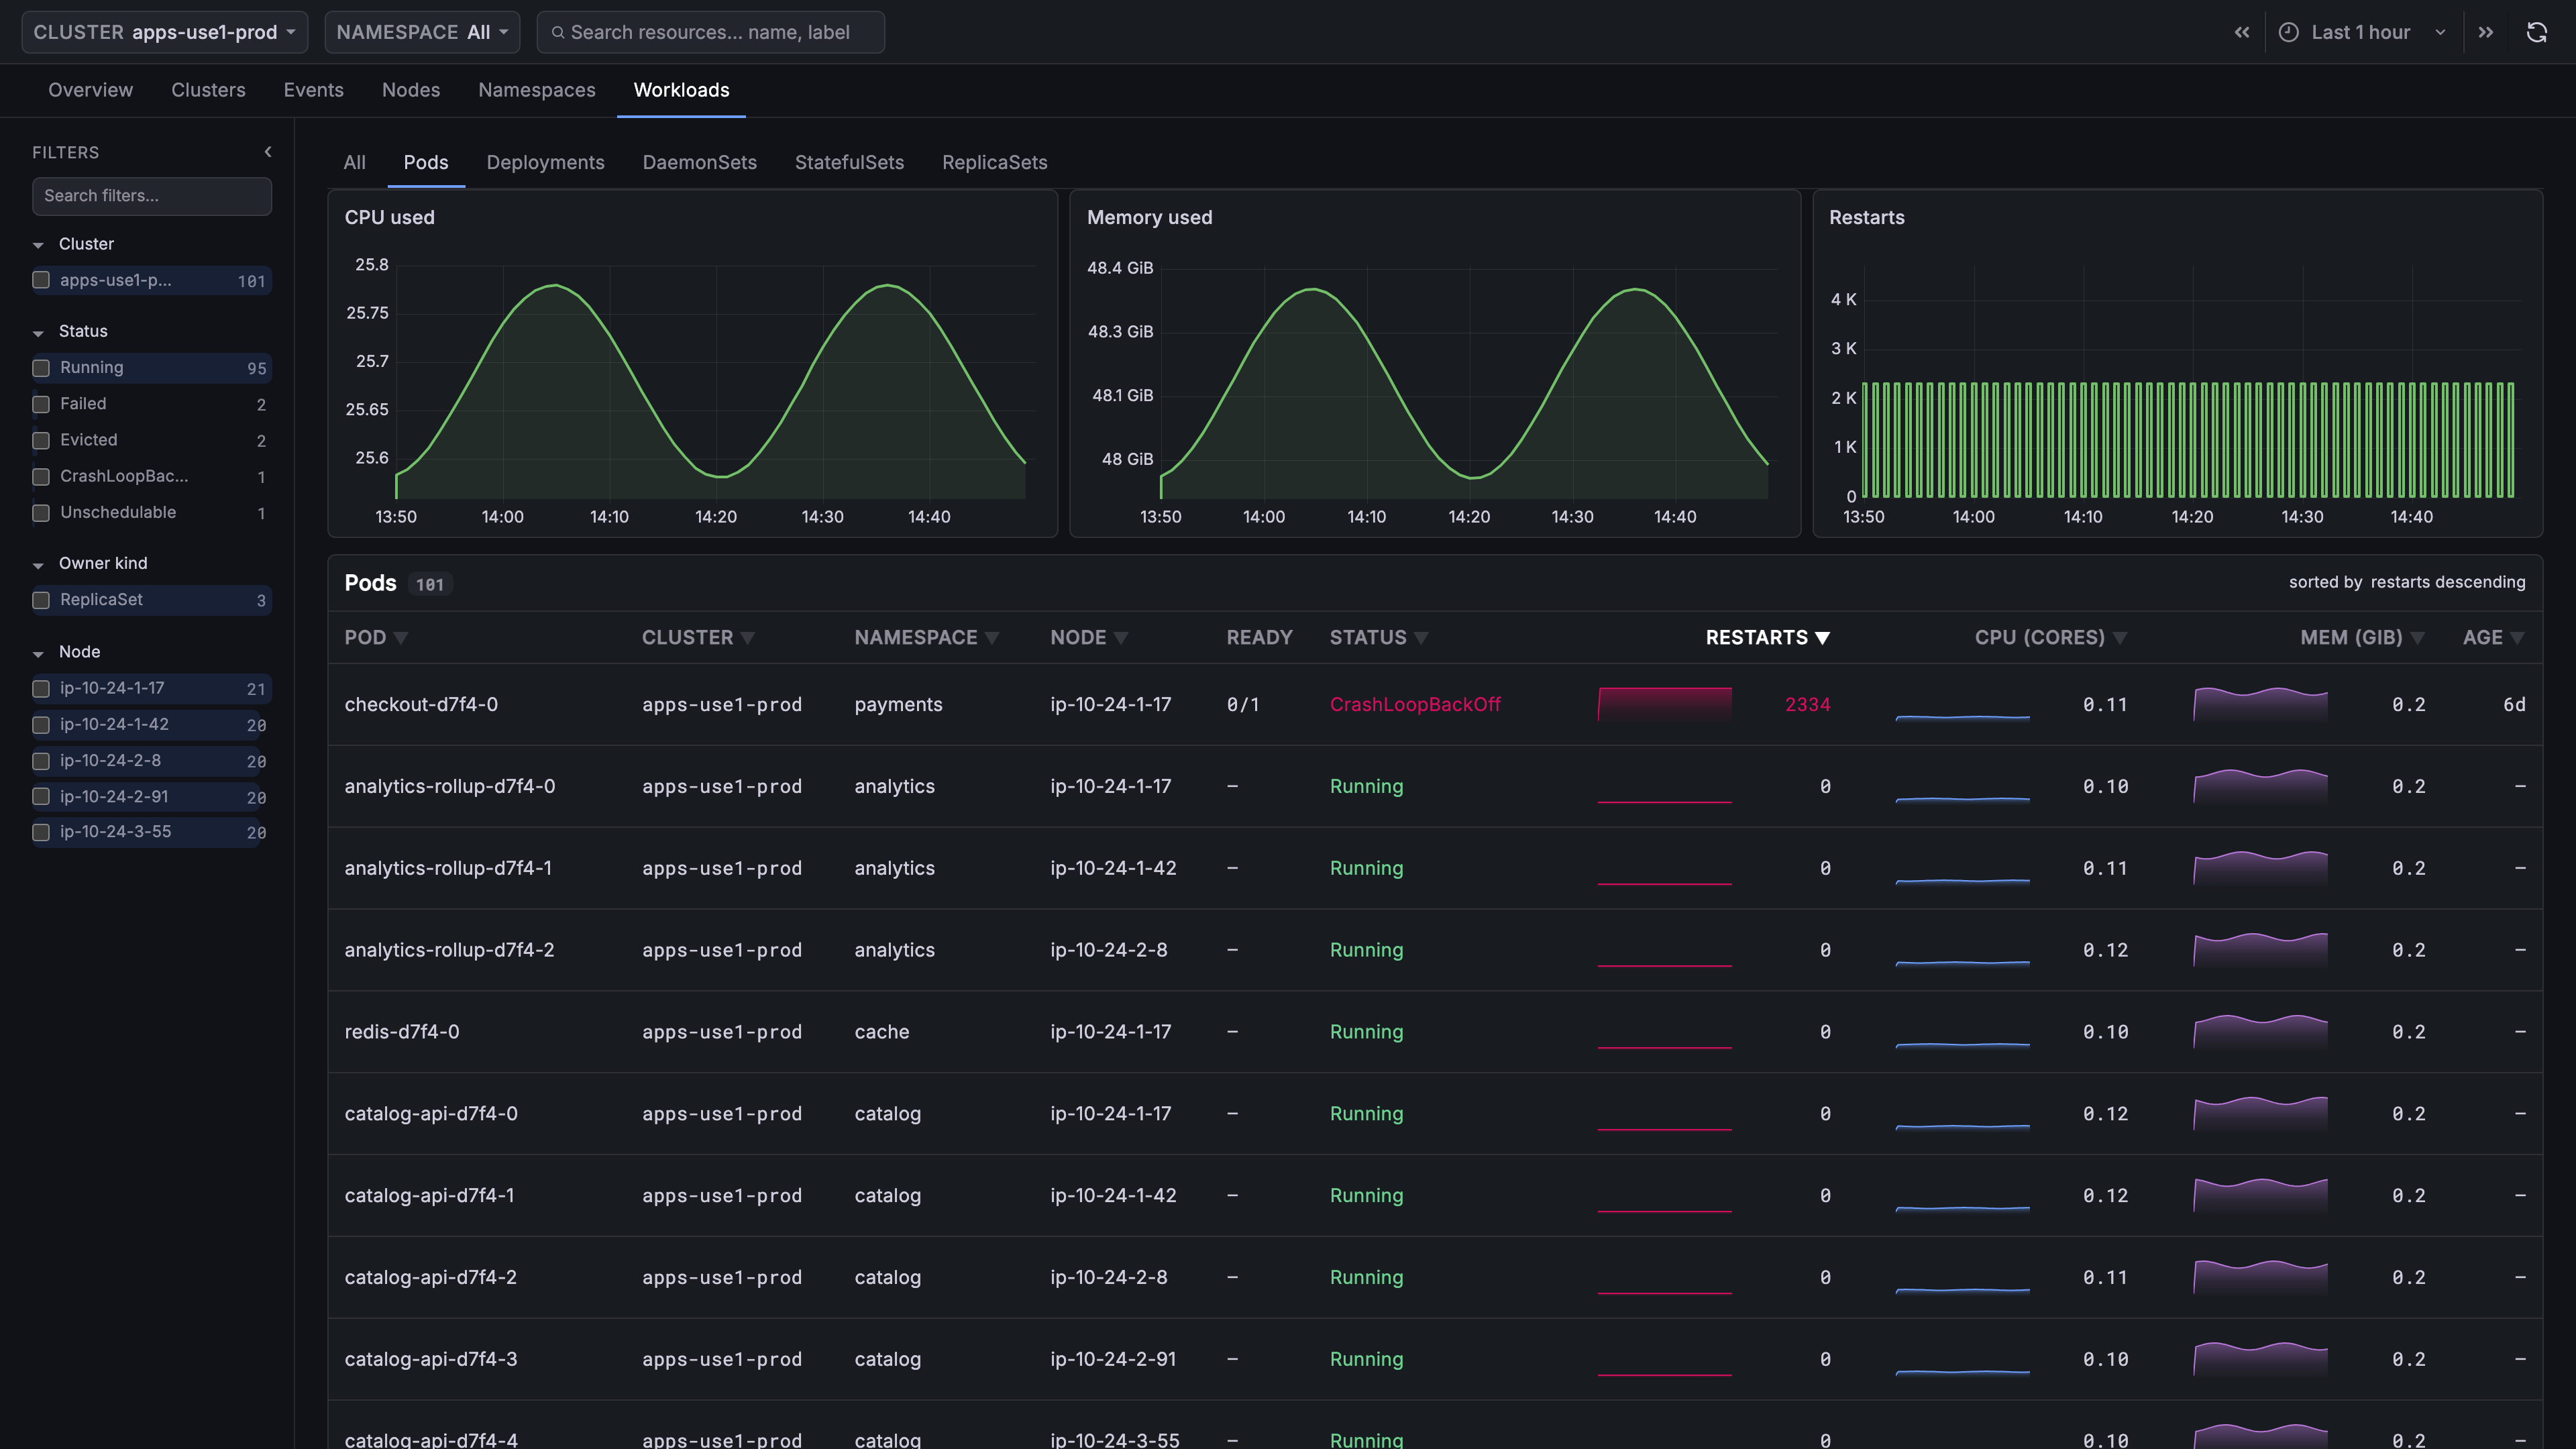
Three charts sit above every sub-tab - CPU used, Memory used and Restarts - measured per pod on All and Pods, and per workload on the kind sub-tabs.
Pods
| Column | Description |
|---|---|
| Pod | The pod's name |
| Namespace | The namespace it runs in |
| Node | The node it is scheduled on, or — if unscheduled |
| Ready | Ready containers over total, as 2/3 |
| Status | The pod phase, or the container's own reason when it has one - CrashLoopBackOff in red, ContainerCreating in orange |
| Restarts | Sparkline and the pod's lifetime restart count |
| CPU (cores) | Sparkline and current CPU use in cores |
| Mem (GiB) | Sparkline and current memory use in GiB |
| Age | How long the pod has existed |
Rows are sorted by restarts by default, which puts the most troubled pods first.
Read Status closely. A pod stuck in Pending has not been
scheduled and the reason is on the Events tab; a pod in
CrashLoopBackOff is scheduled and failing, and the reason is in its own
detail panel.
The number in Restarts is the pod's lifetime counter, but its color reflects restarts within the selected window. A pod that restarted 400 times last month and none today shows a high number in a neutral color. Widening the time picker lights up more rows without changing the numbers.
Deployments, DaemonSets, StatefulSets, and ReplicaSets
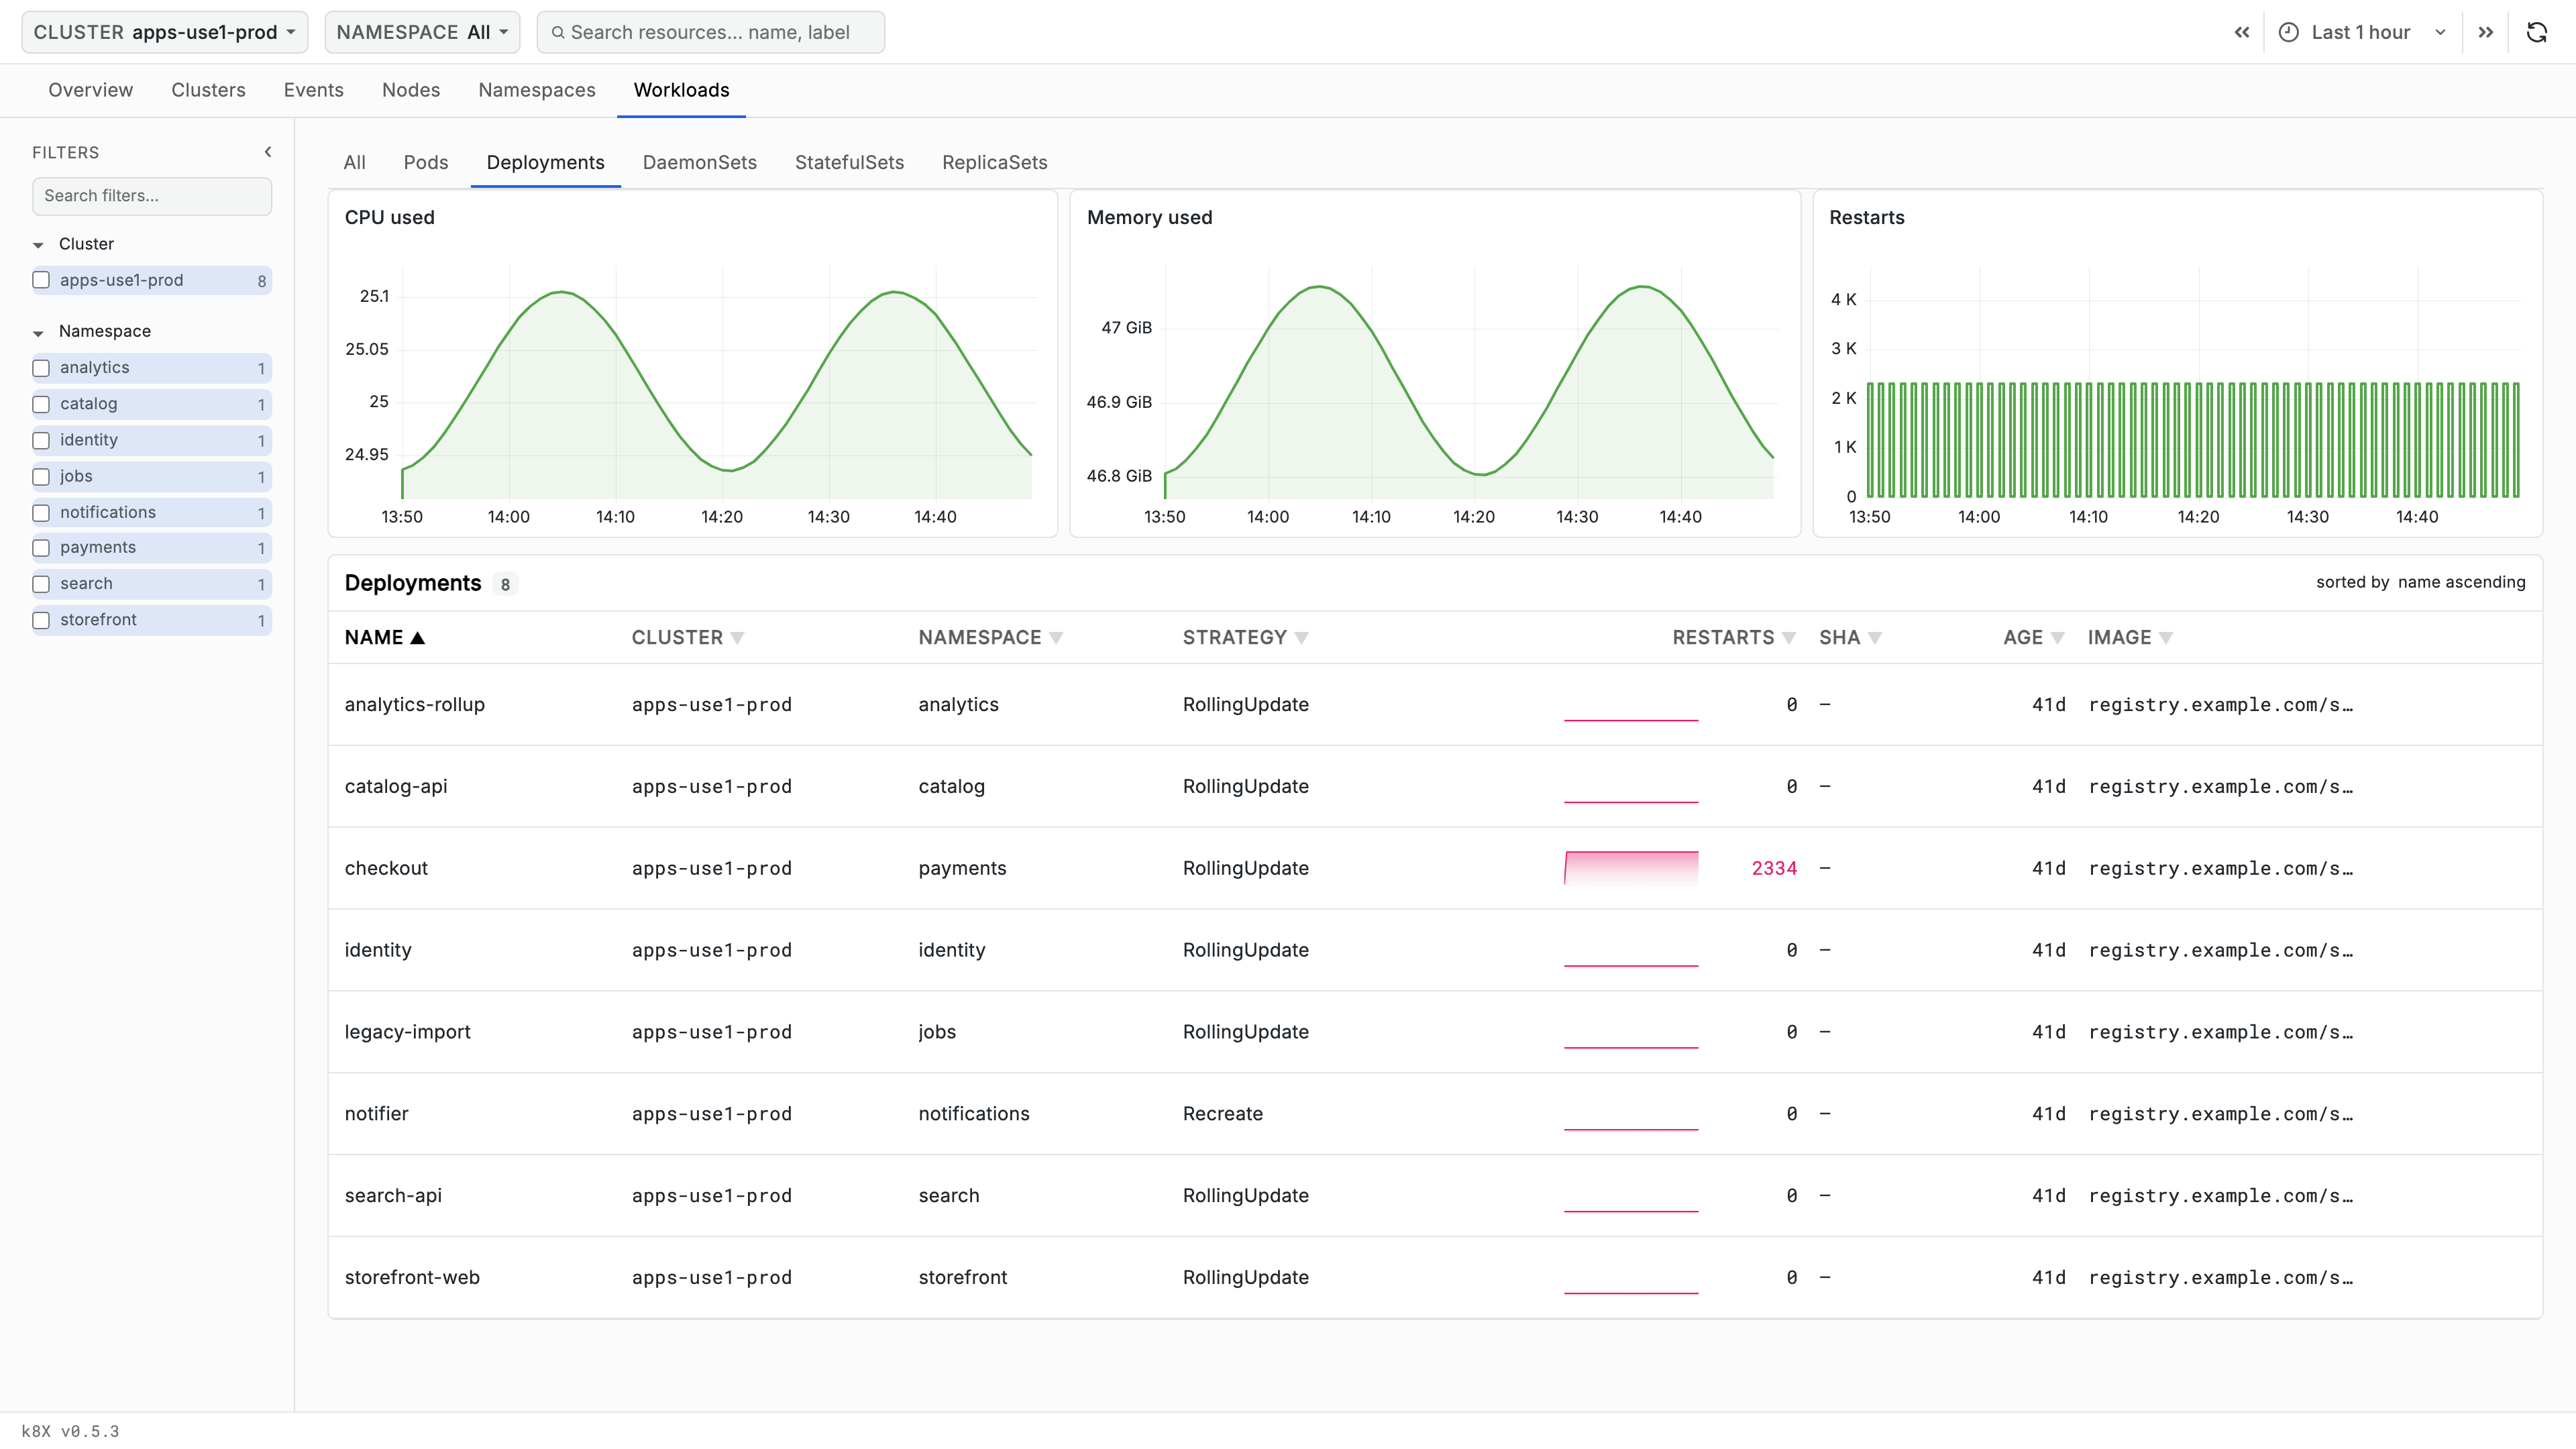
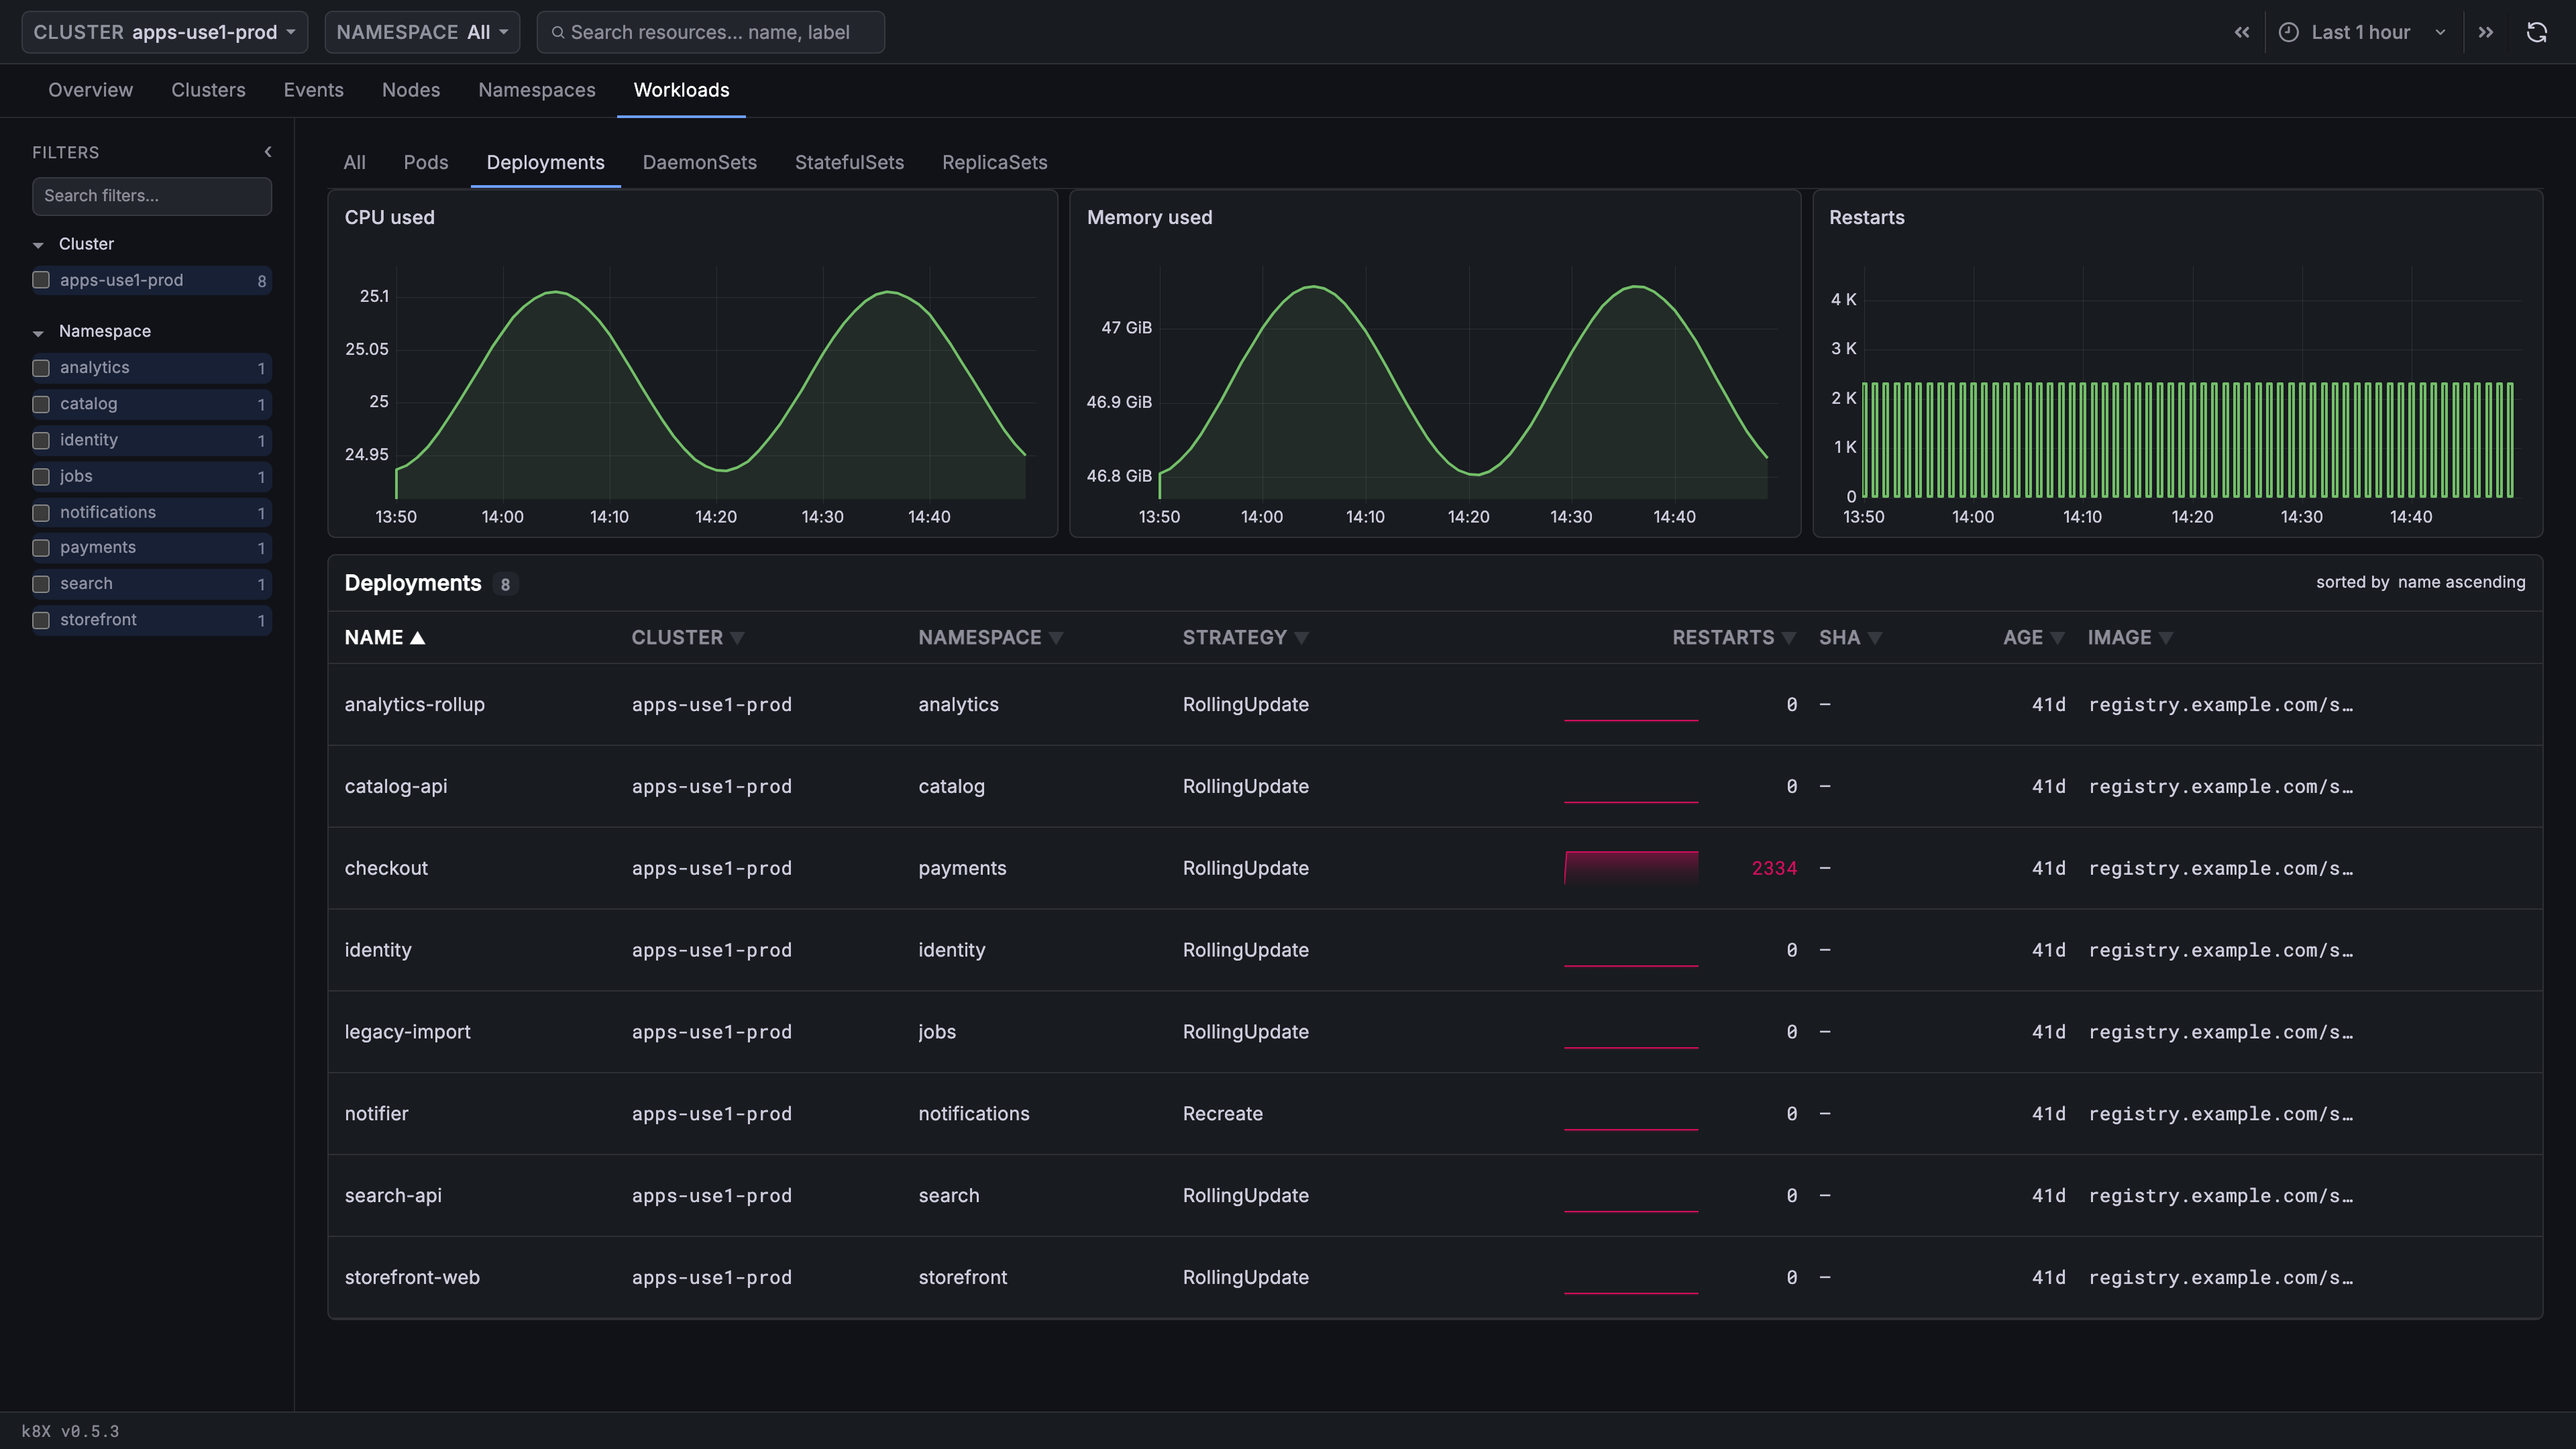
The four kind sub-tabs share a table shape - name, namespace, readiness, restarts and age - and add the columns that only matter for that kind.
| Sub-tab | Readiness | Additional columns |
|---|---|---|
| Deployments | — | Strategy (rollout strategy), SHA (first 12 characters of the image digest, — for tag-pinned images), Image (the full reference, last column) |
| DaemonSets | Ready | Misscheduled - pods running where they should not be, orange when non-zero |
| StatefulSets | Ready | Updated (pods on the current revision), Storage (3 bound, or 1 pending in orange) |
| ReplicaSets | Available | Owner (the owning Deployment, or Orphaned in orange), Rev (revision number) |
The readiness badge always reads <ready>/<desired> and turns red when ready
is below desired. A workload deliberately scaled to zero reads 0/0 in
neutral, not red.
Orphaned on a ReplicaSet means it has no owner reference - usually a
leftover from a deleted Deployment. ReplicaSets scaled to zero are hidden by
default, since a Deployment with a long history accumulates many of them.
Pod Details
Select a pod to open its detail panel.
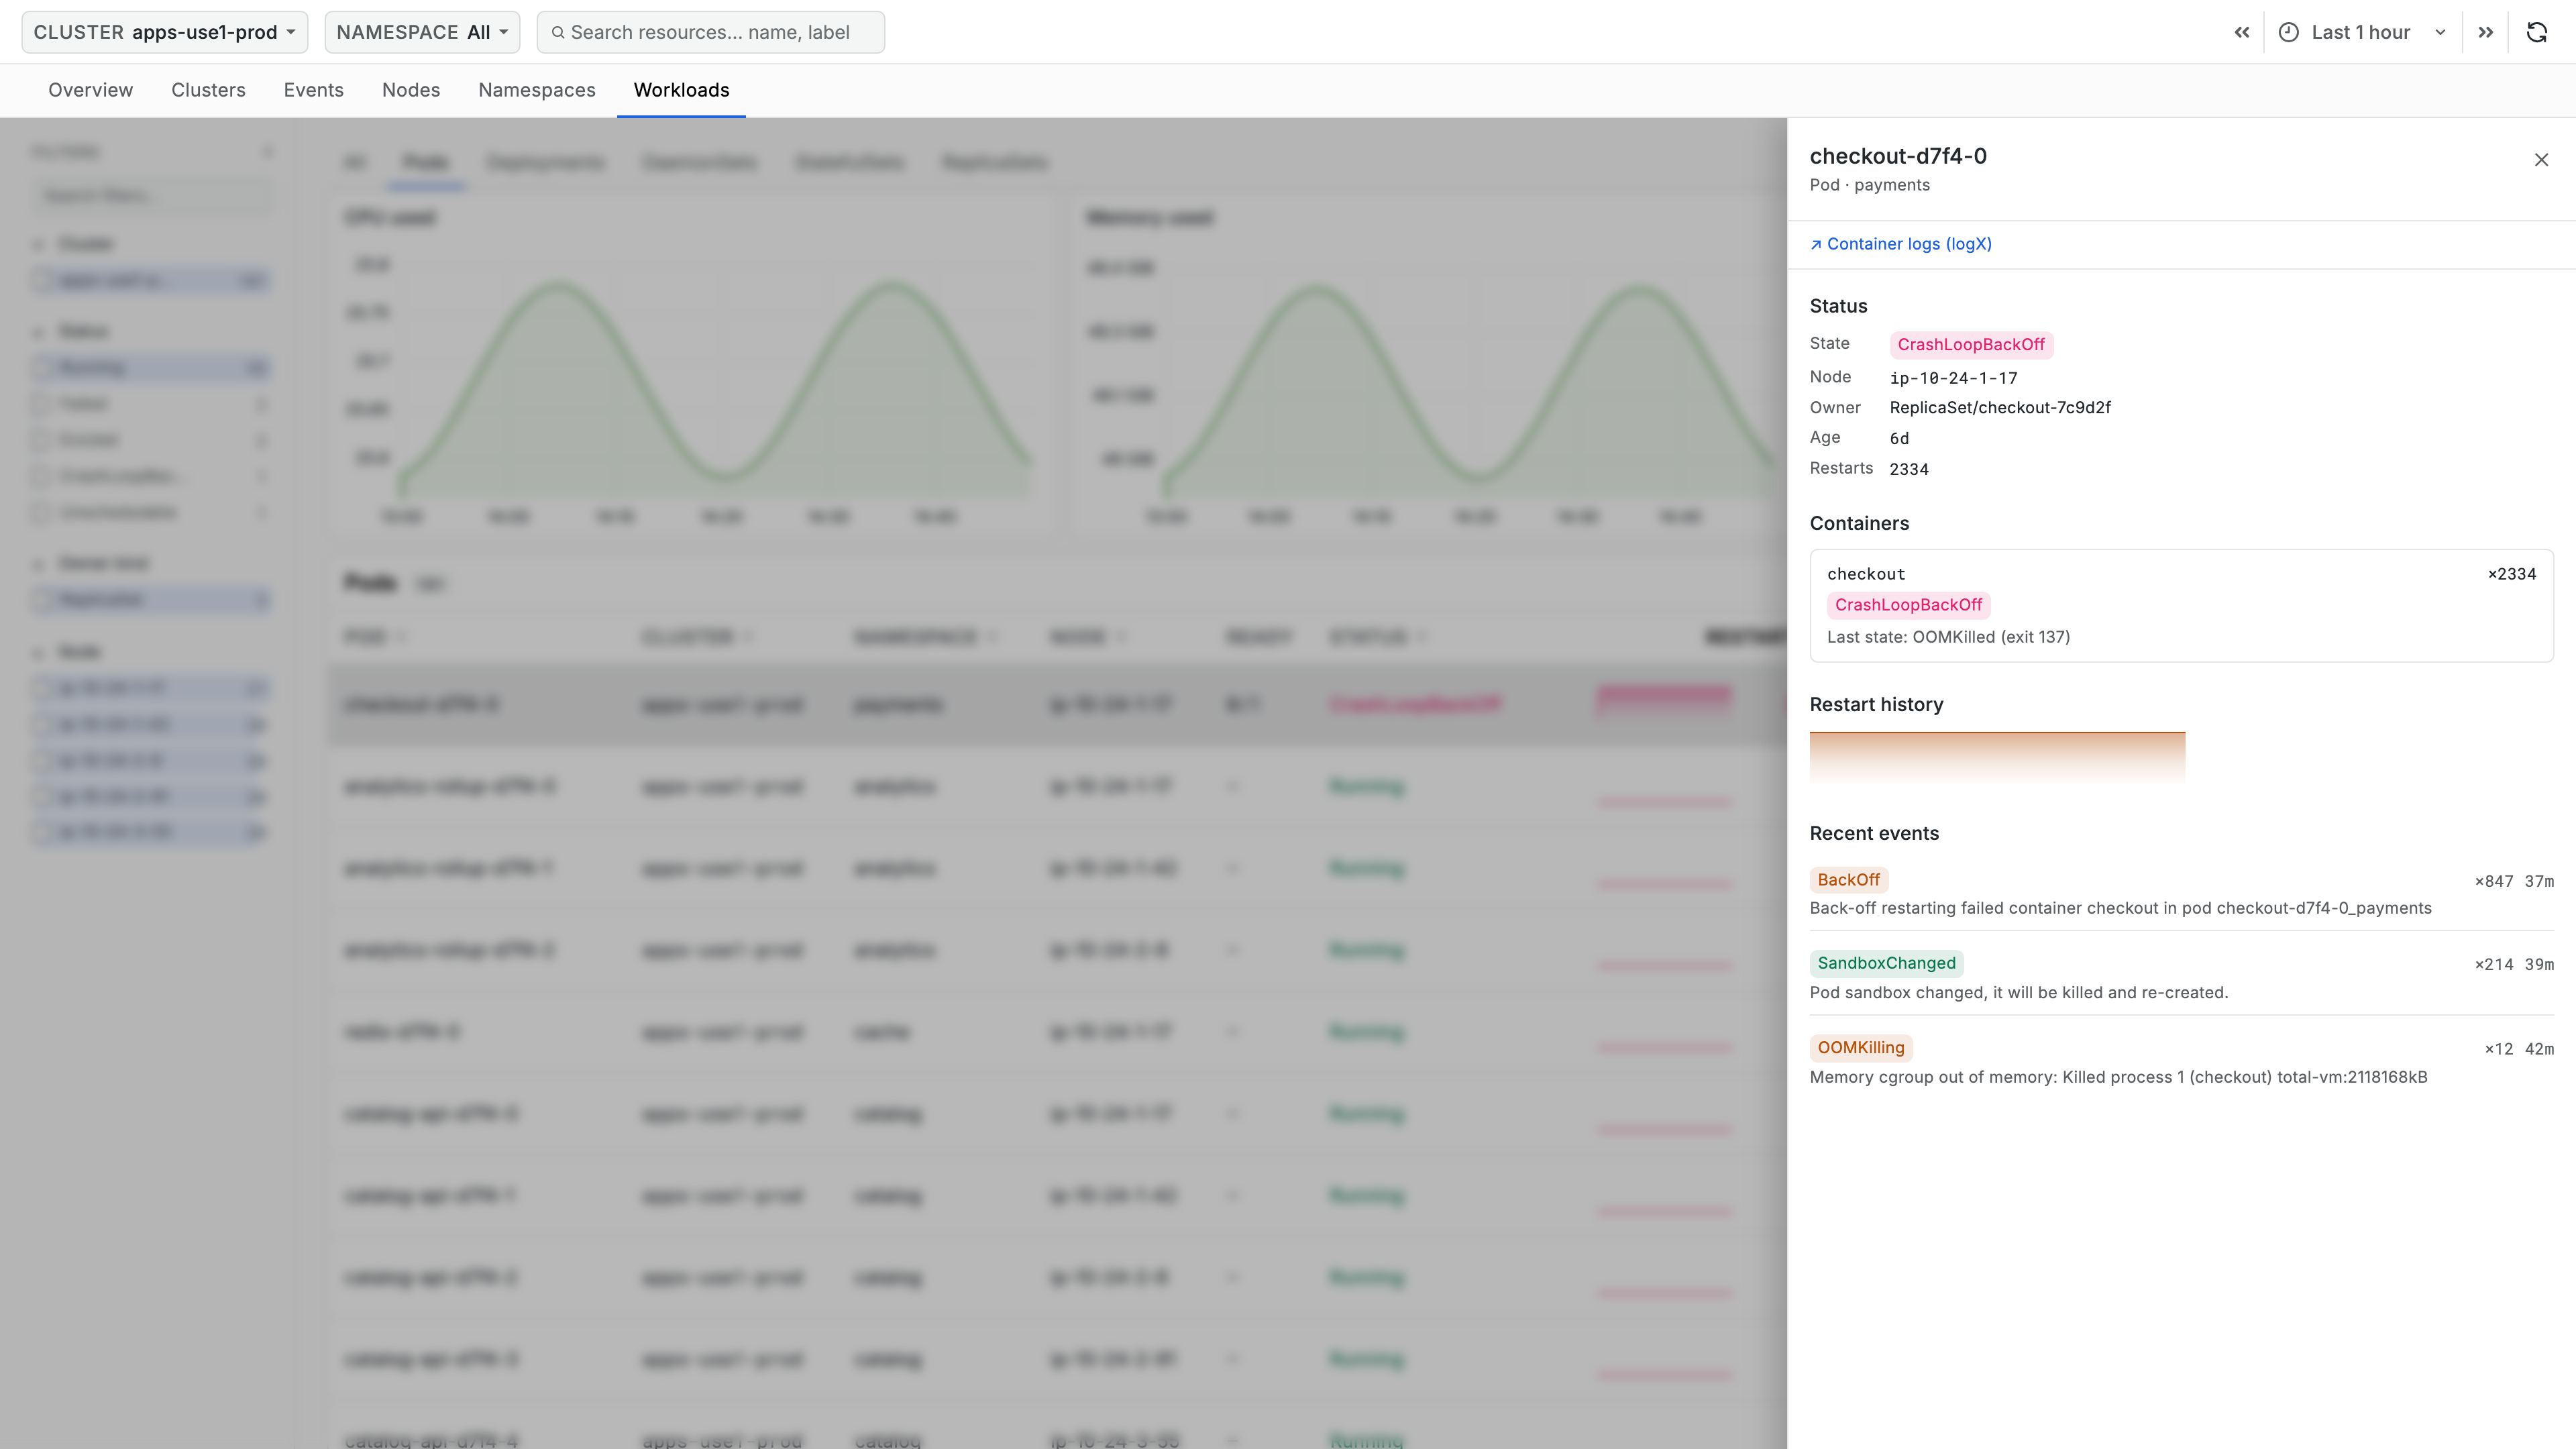
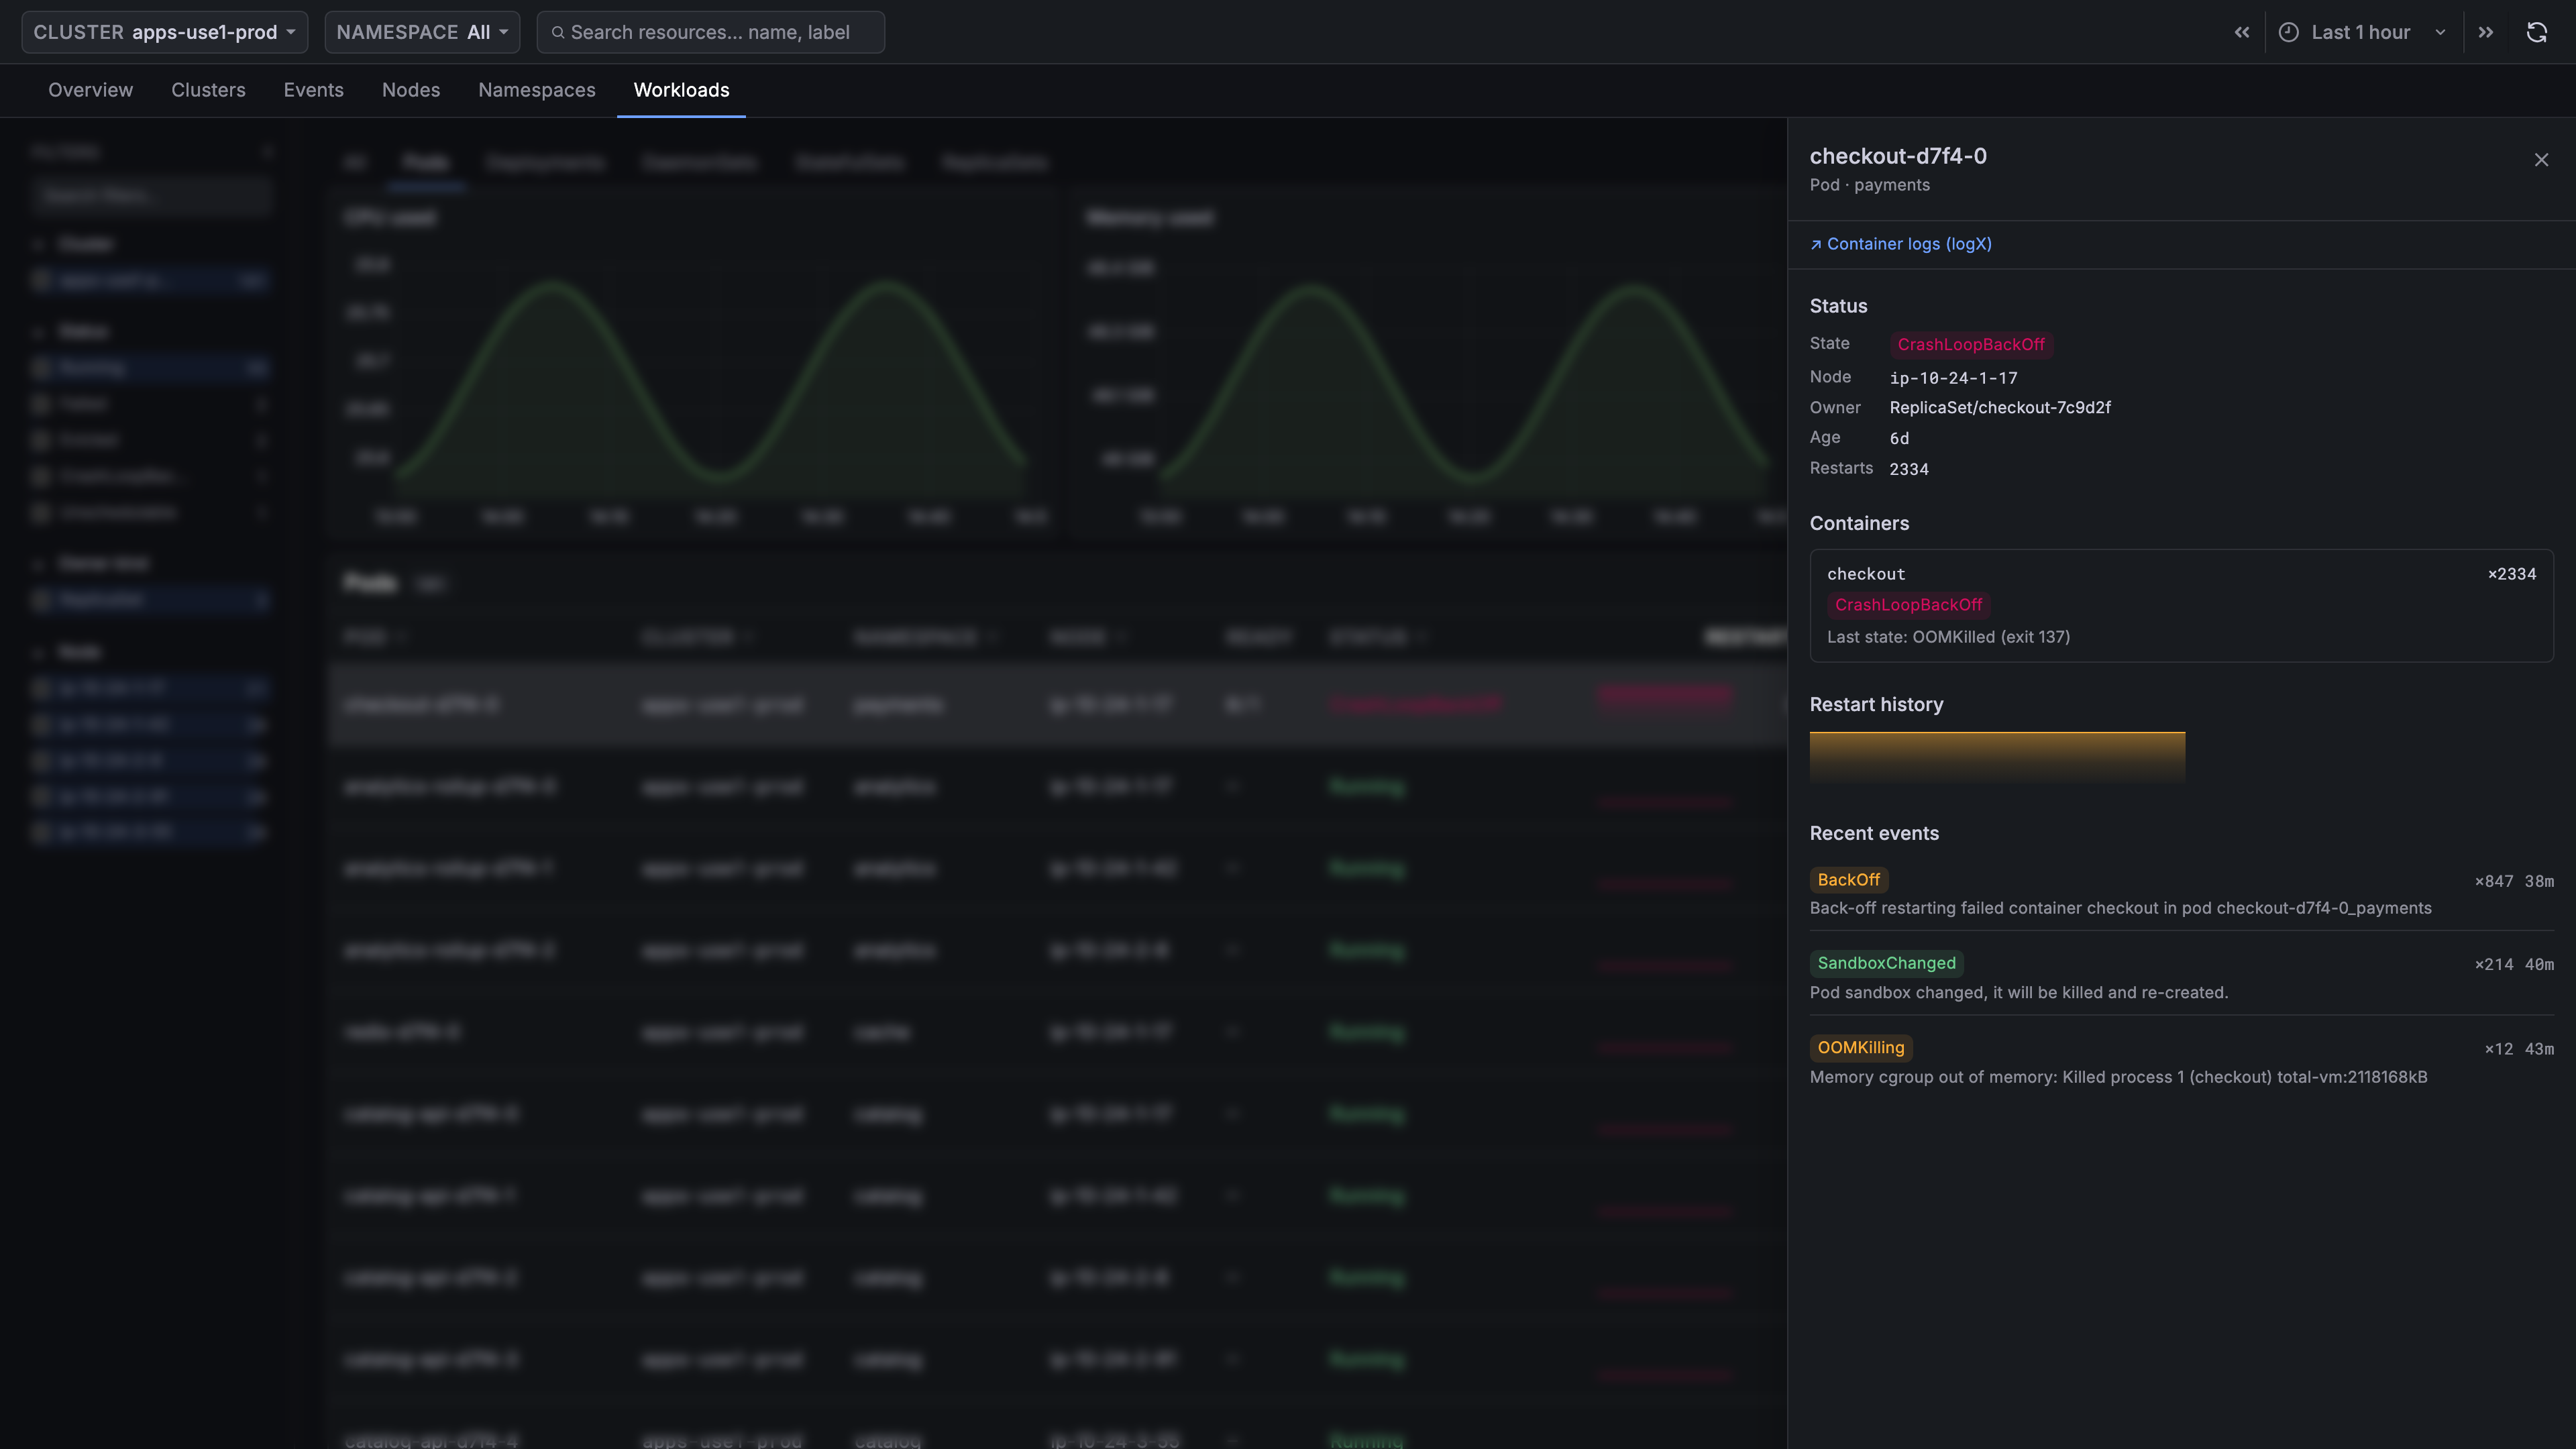
Status
State, Node, Owner (as Deployment/checkout, or
None — this pod is unmanaged), Age, and Restarts.
An unmanaged pod is worth noticing: nothing will recreate it if it dies.
Containers
One box per container, with its restart count, the waiting reason when it has
one, and the previous termination when there was one -
Last state: OOMKilled (exit 137). That line is usually the answer for a pod
in CrashLoopBackOff.
If this section reads
No container detail — this cluster does not ship pod object snapshots., the
k8sobjects receiver is not collecting pods. See
Before You Start.
Restart History
A sparkline of restarts over the window, shown when there is more than one data point. A steady slope is a pod failing repeatedly; a single step is one bad moment.
Recent Events
Kubernetes events about this pod in the window, with reason, repeat count, age, and message.
Cross-App Links
The panel header can carry two links:
- Container logs (logX) opens logX on the same time range, scoped to this pod's service
- APM service opens the APM app on the same time range, scoped to the same service
Both appear only when that app is installed in your Scout instance and k8X
can resolve a service name for the pod - from its app.kubernetes.io/name
label, or failing that from the name of the workload that owns it. A pod with
neither shows no links.
Workload Details
Select a Deployment, DaemonSet, StatefulSet or ReplicaSet to open its panel. Sections appear only when they apply to that kind.
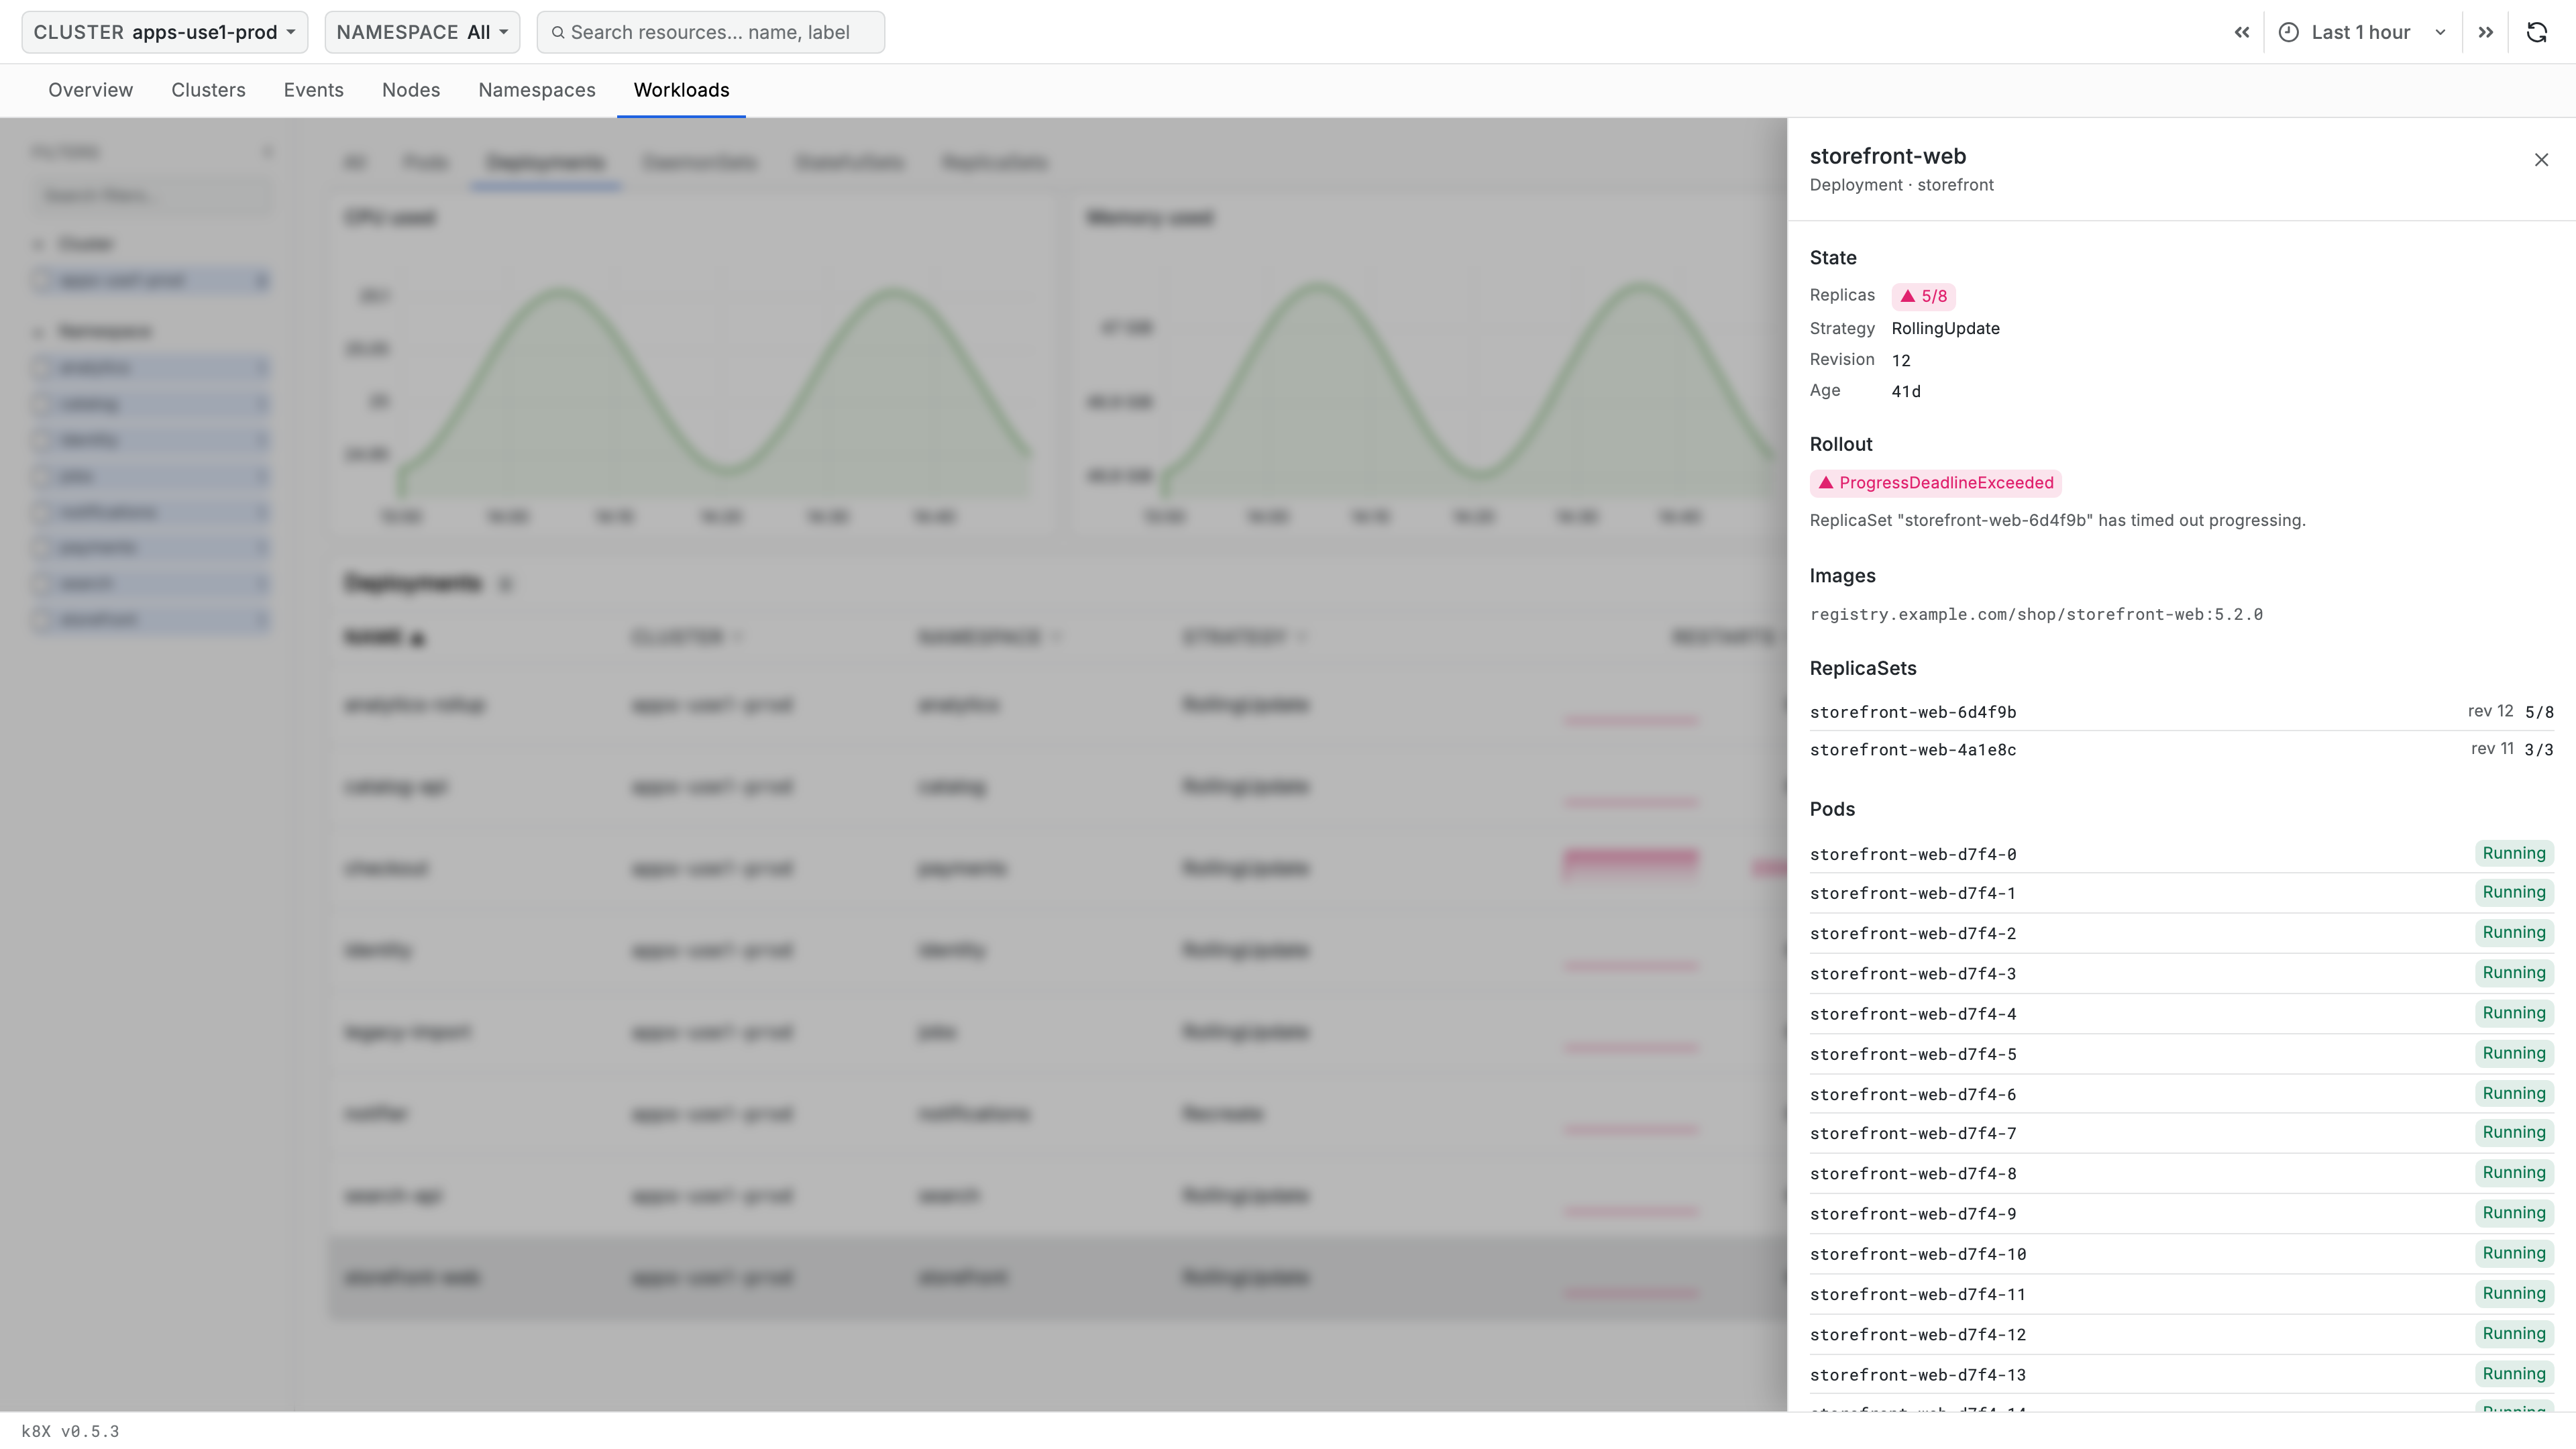
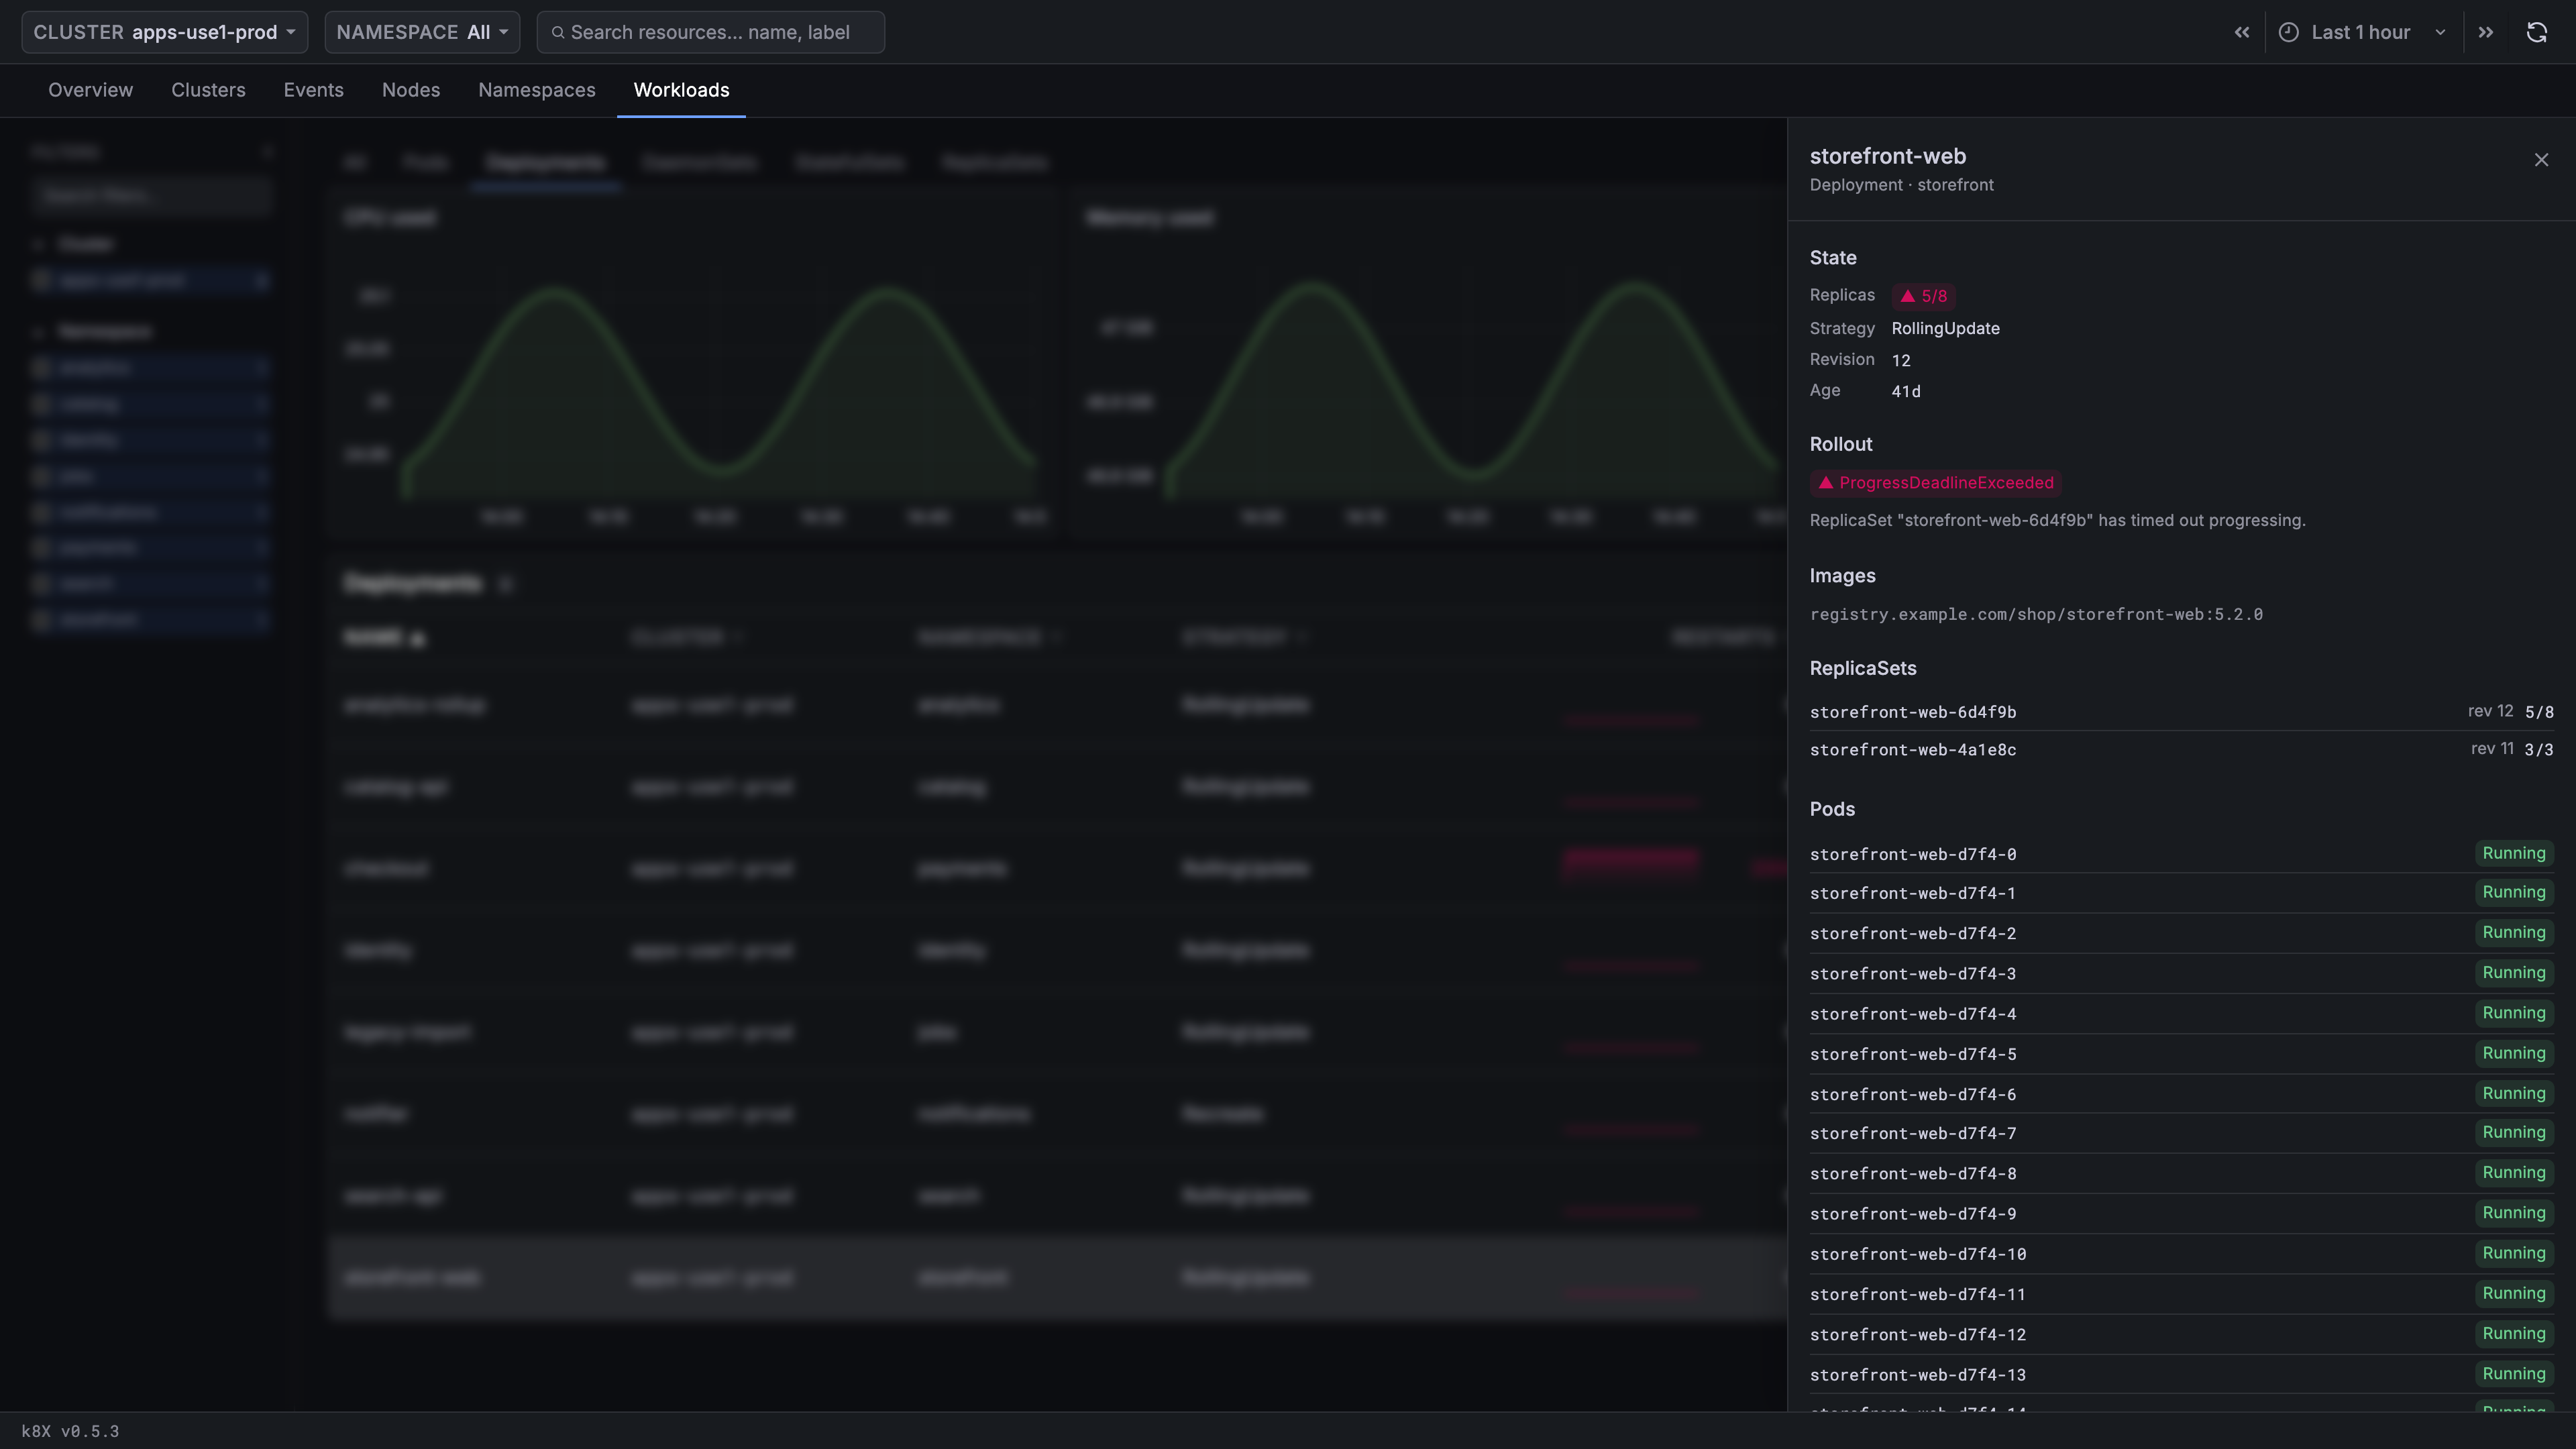
State
Replicas as 2/3 with a ▲ when short, plus Strategy, Revision,
Owner and Age where the kind has them.
Rollout
Appears only when a Deployment is not progressing. Shows the Kubernetes
reason, such as ProgressDeadlineExceeded, and the message verbatim. This is
the section that distinguishes a rollout that is slow from one that has
already given up.
Images
One line per container image, so you can confirm what is actually deployed against what you expected.
Storage
StatefulSets only. One row per persistent volume claim, with its phase and
storage class - Bound · gp3, or Pending. A Pending claim is why the pod
that needs it will not start.
Node Coverage
DaemonSets only, and the fastest way to answer "why is this not running
everywhere". Lists the nodes with no pod and gives a reason for each: a taint
that explains the gap, or
No taint explains this gap — check the nodeSelector or the pod itself. When
coverage is complete it reads Every node runs a pod.
ReplicaSets
Deployments only. Every ReplicaSet for this Deployment, newest revision first, with its revision number and readiness. During a rollout you will see two with pods; after a healthy rollout, one.
Pods
Every pod belonging to the workload, with its status. Headed Replicas for StatefulSets, where the ordinal matters and the list is sorted by it.
Use Cases
Diagnosing a CrashLoopBackOff
- On Pods, filter Status to
CrashLoopBackOff, or sort by Restarts - Open the pod and read Containers for the previous termination -
OOMKilled (exit 137)means raise the memory limit; a non-zero application exit code means read the logs - Check Restart History to tell a persistent failure from a single event
- Open Container logs (logX) from the panel header for the logs themselves
Finding Out Why a Rollout Is Stuck
- On Deployments, find the workload; readiness in red means it is short of replicas
- Open it and read Rollout for the Kubernetes reason
- Check ReplicaSets - two with pods means the new one is not coming up
- Open a pod from the new ReplicaSet;
Pendingpoints at scheduling, whileImagePullBackOffpoints at the image in Images
Working Out Why a DaemonSet Misses Nodes
- On DaemonSets, compare Ready against your node count
- Open it and read Node Coverage, which names each uncovered node and its reason
- For a node whose gap no taint explains, open it on Nodes and compare its labels against the DaemonSet's node selector
Tracking Down a Noisy Neighbor
- Sort Pods by CPU (cores) or Mem (GiB)
- Check the pod's Node, then open that node on Nodes to see what else it carries
- Check the namespace on Namespaces - a pod using far more than it requested is what makes a namespace over-committed
Related Guides
- Getting Started - Prerequisites and health thresholds
- Overview - The unhealthy-workloads shortlist
- Nodes - The nodes these pods are scheduled on
- Namespaces - Resource commitment these workloads consume
- Events - Scheduling failures and other event detail
- logX - Container logs for a pod's service