k8X Clusters
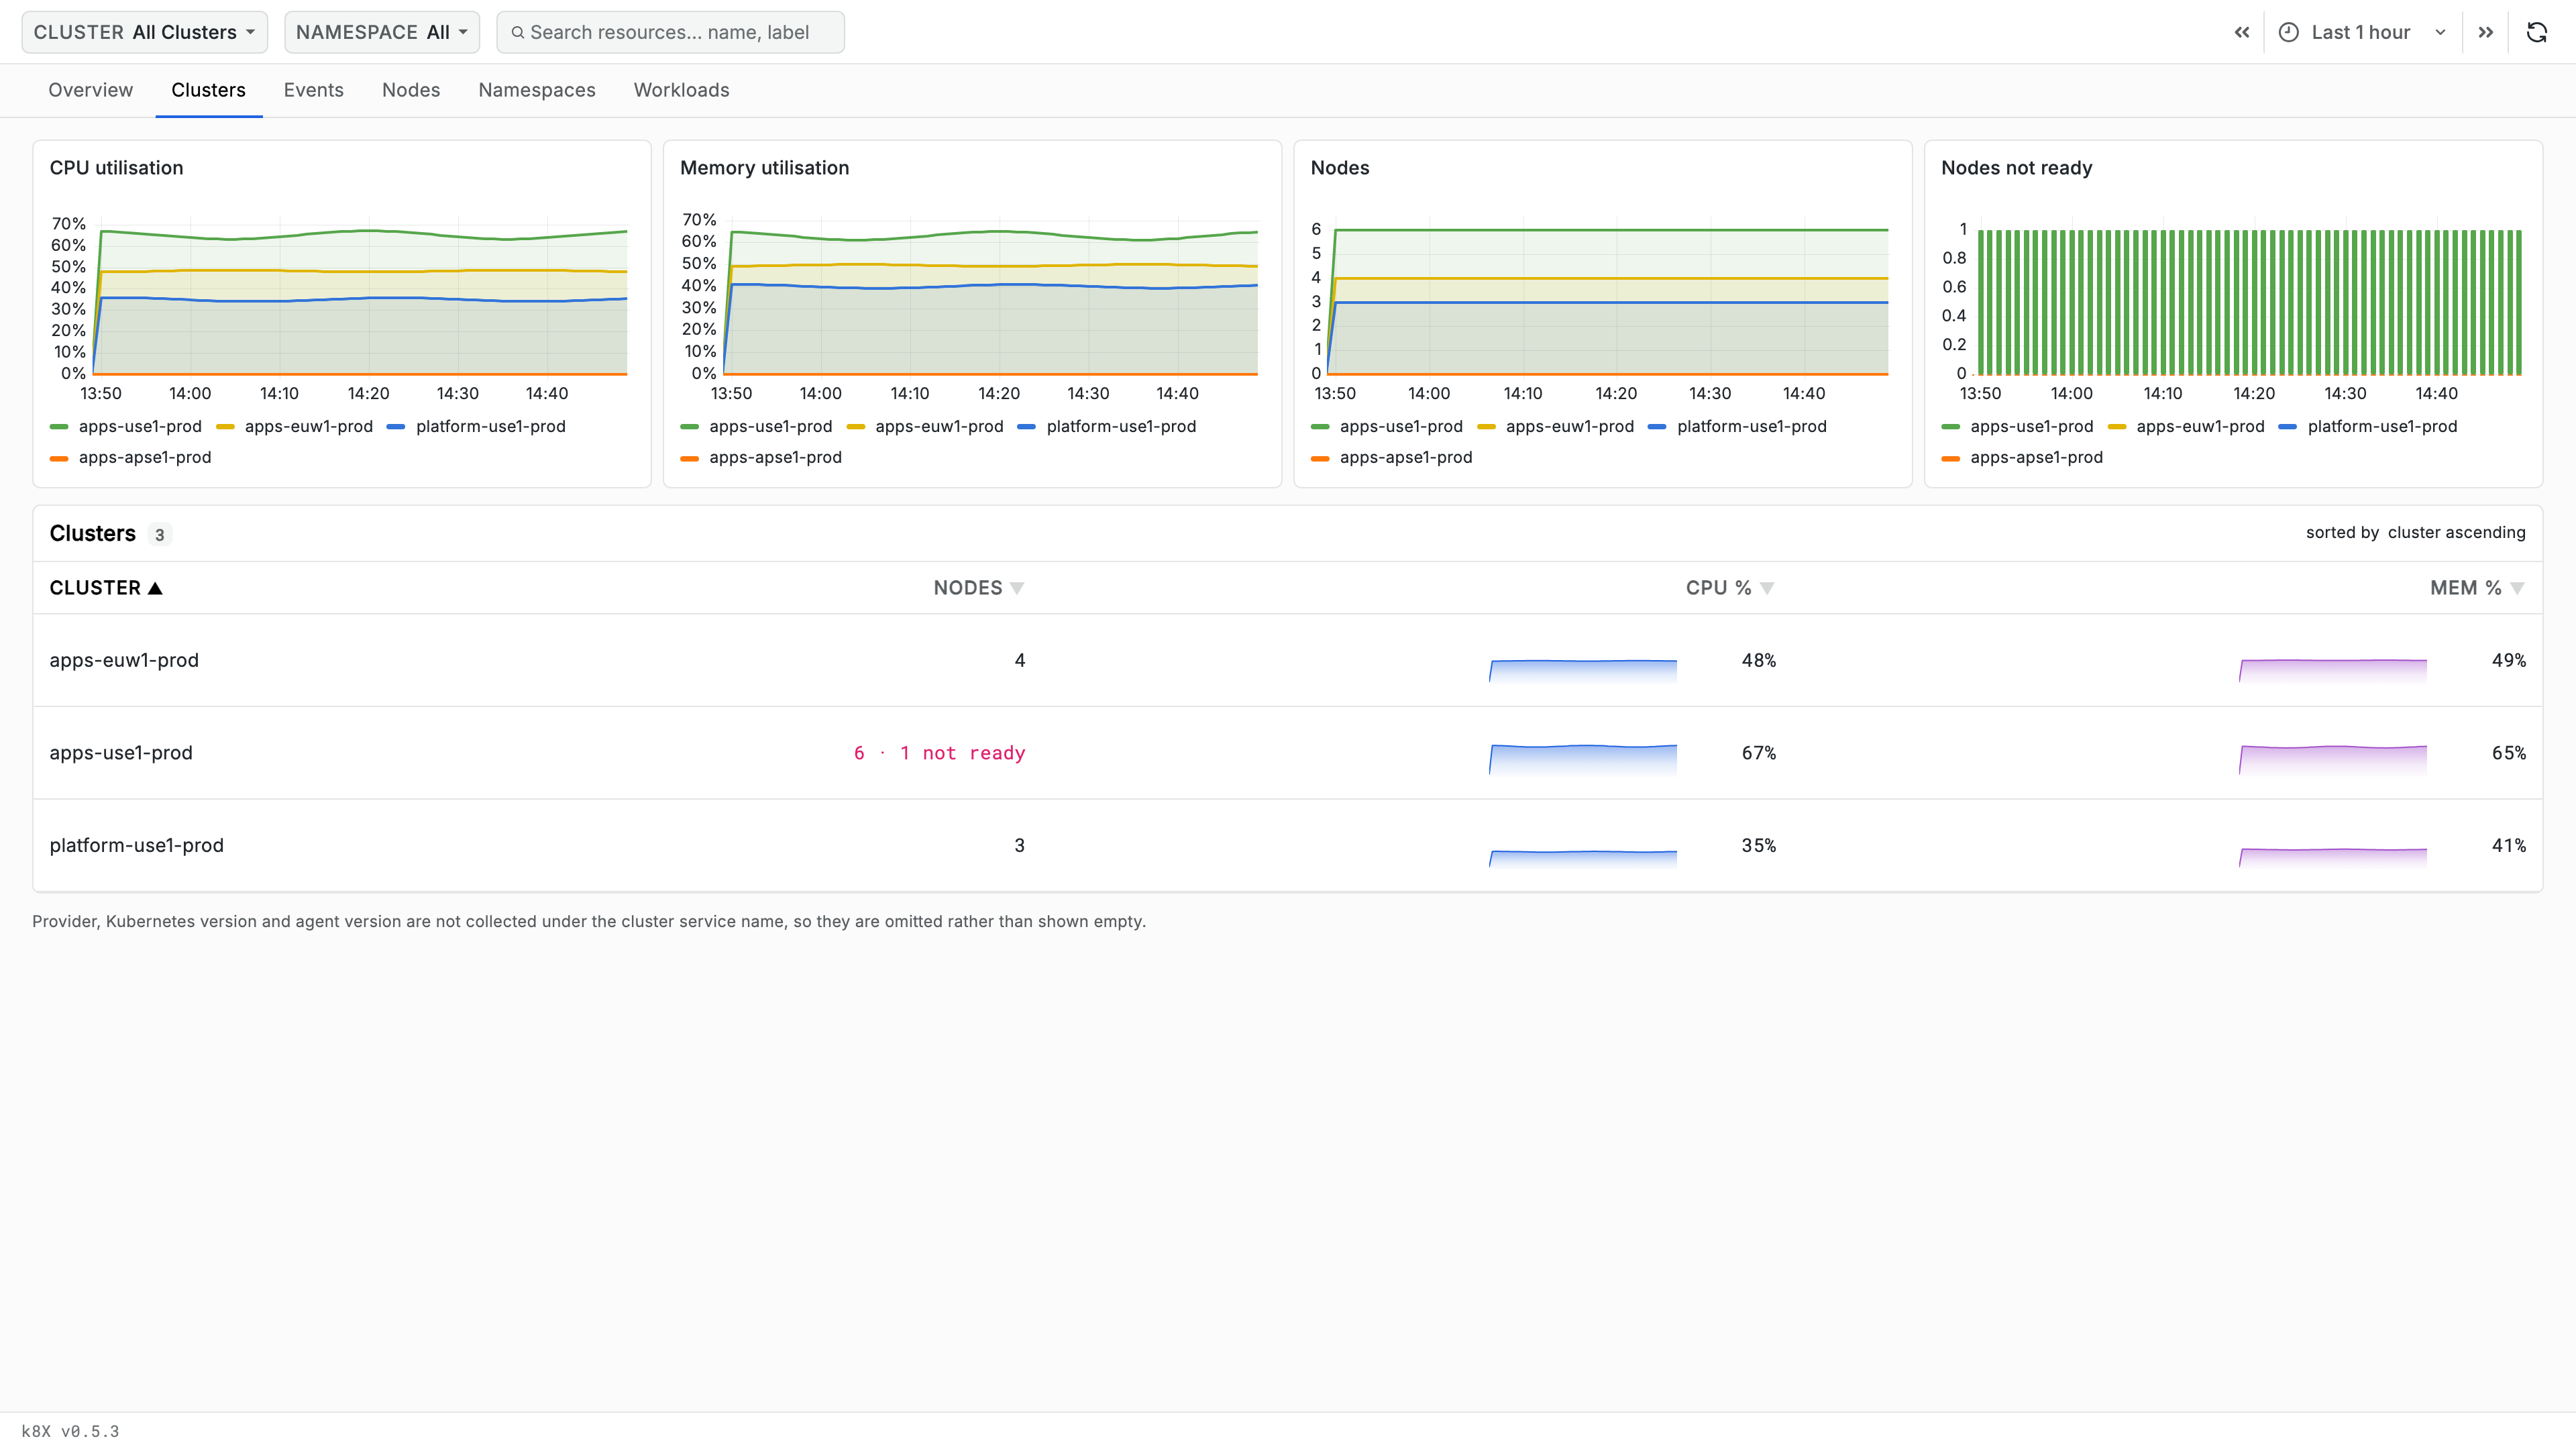
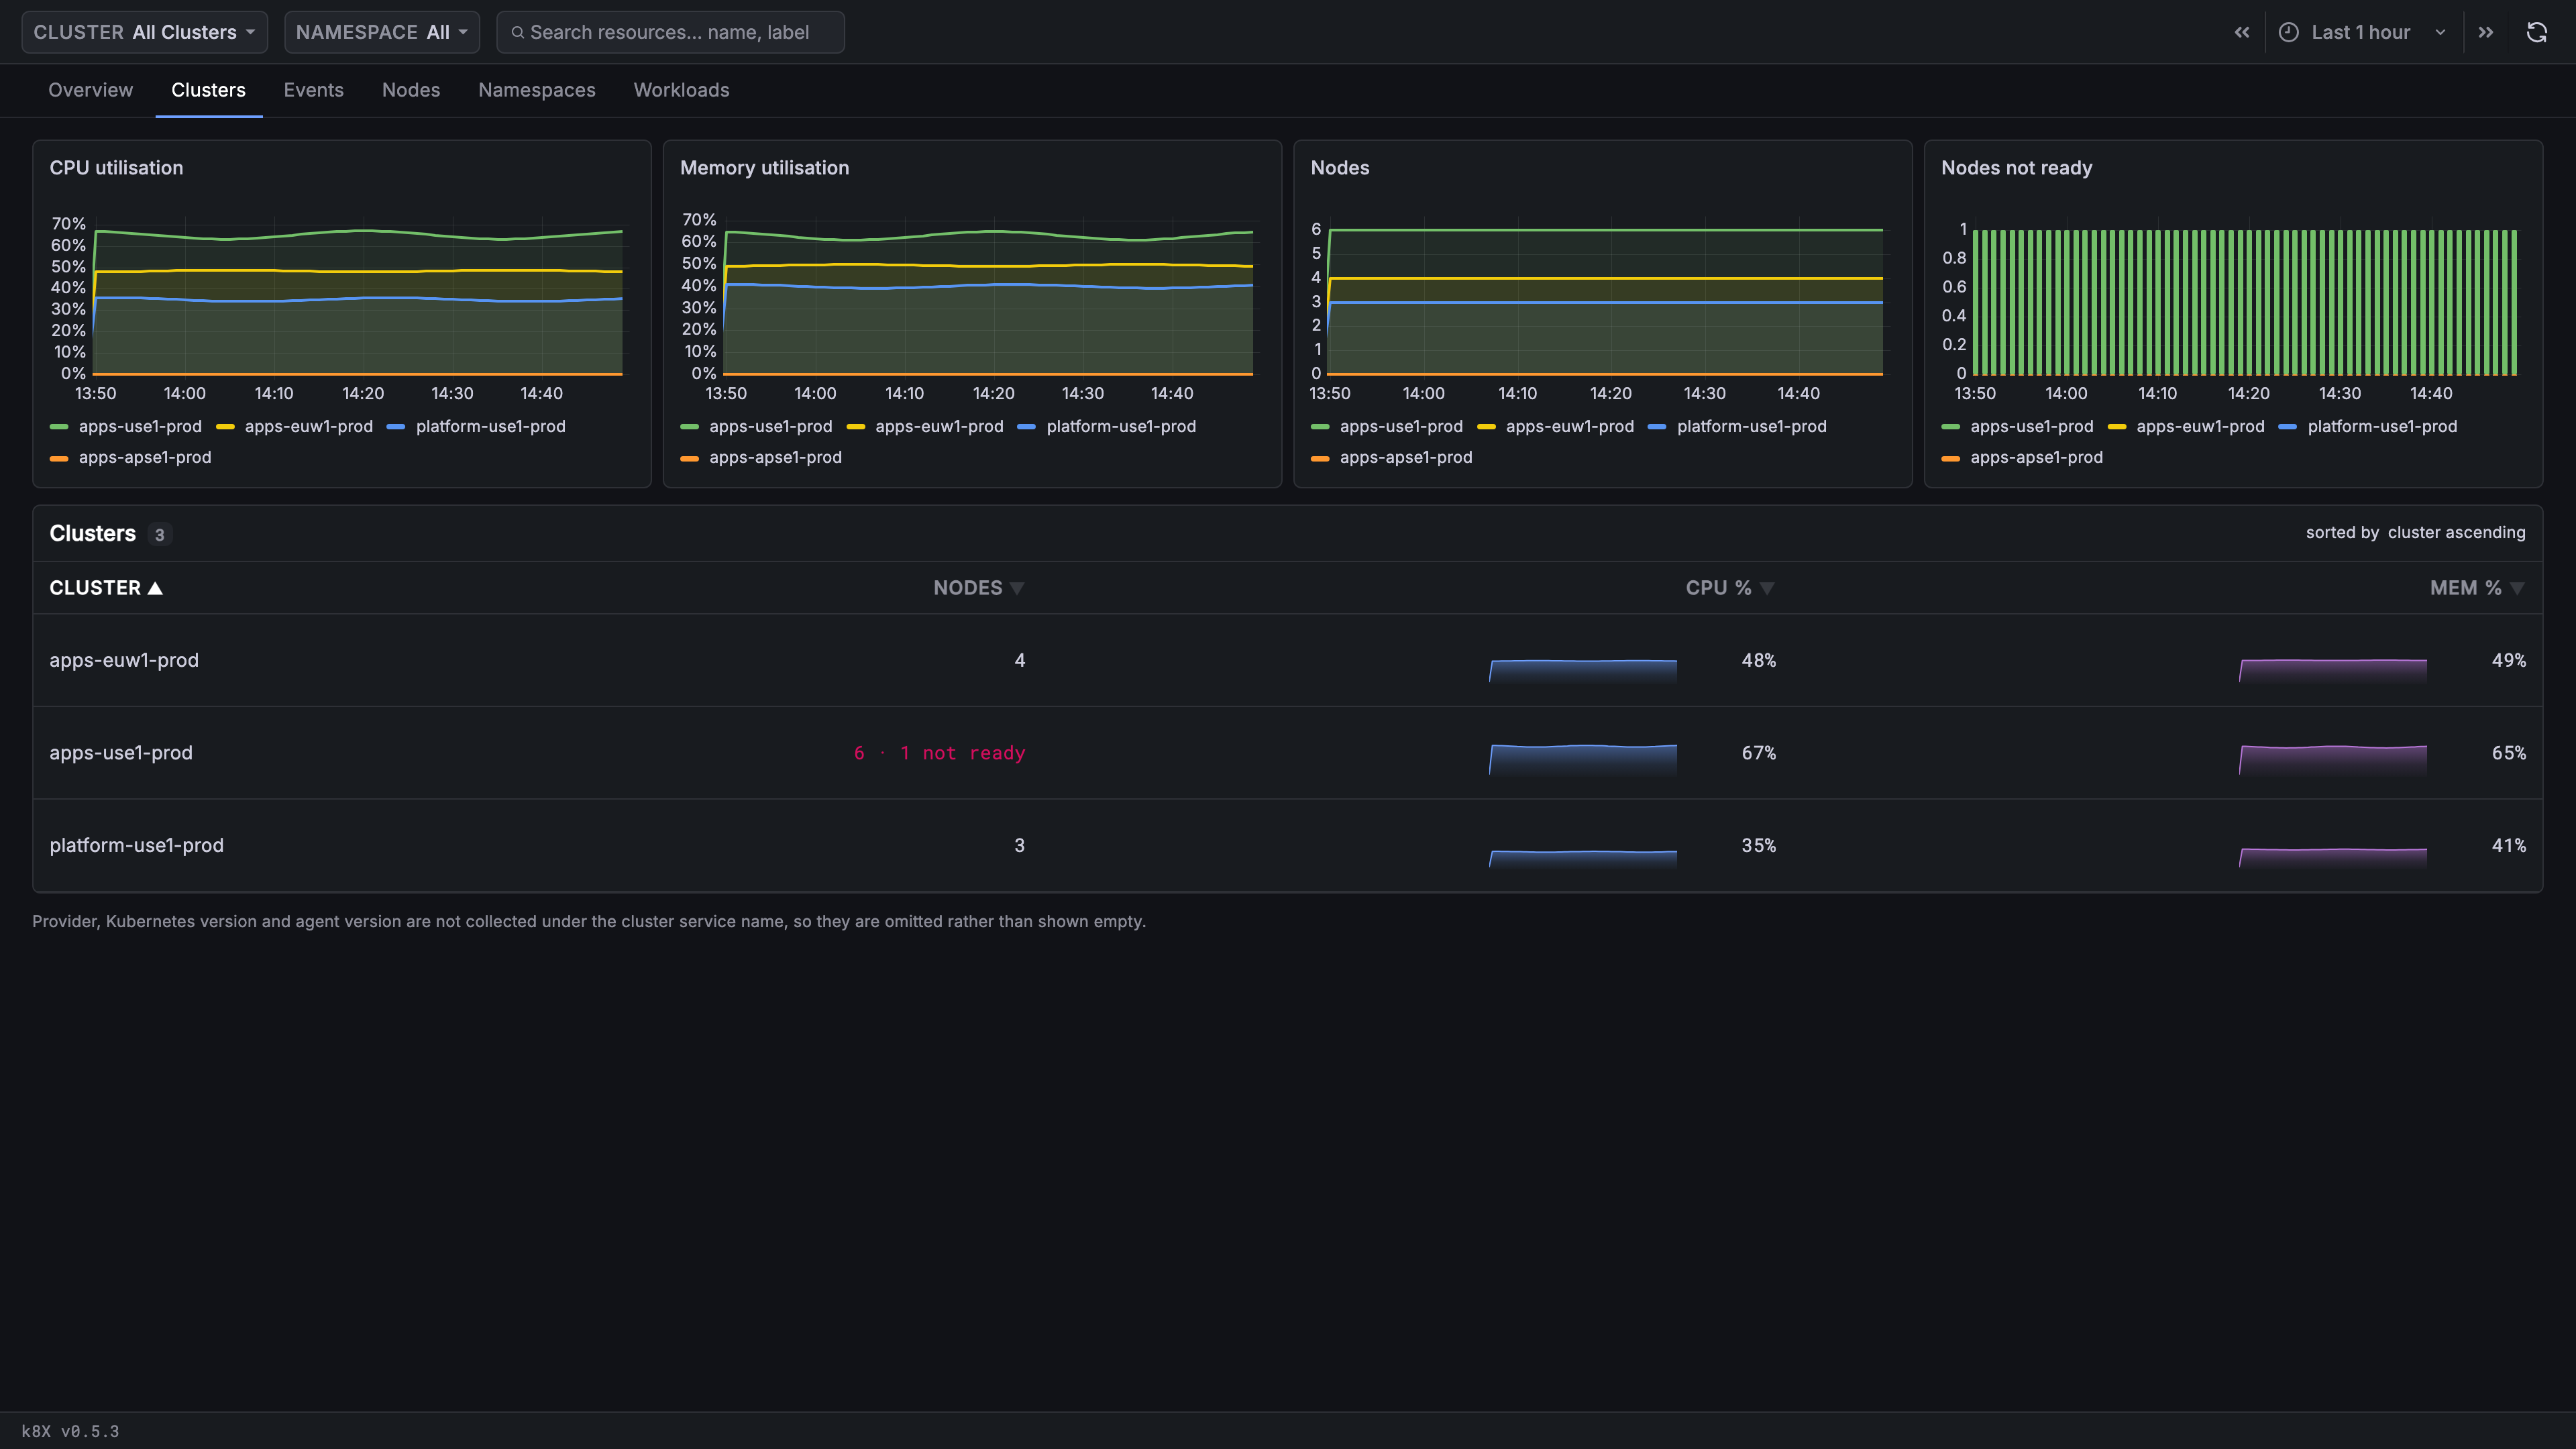
The Clusters tab compares every cluster reporting to Scout side by side. It answers two questions: which cluster is under pressure, and which cluster has stopped reporting.
Along with Overview, this is one of the two tabs with no filters sidebar - there is nothing to facet when each row is already a whole cluster. Use the cluster selector in the top bar to narrow the set.
Charts
Four charts run across the top, each with one series per cluster:
- CPU utilisation - CPU used as a percentage of allocatable
- Memory utilisation - memory used as a percentage of allocatable
- Nodes - node count over the window
- Nodes not ready - not-ready node count, drawn as bars
Nodes and Nodes not ready read together: a step down in one that matches a step up in the other is a node going unhealthy, while a step down in Nodes alone is a node leaving the cluster.
Cluster List
| Column | Description |
|---|---|
| Cluster | The cluster's service name, as configured in k8X |
| Nodes | Node count. Reads 12 · 1 not ready in red when any node is not ready |
| CPU % | Sparkline of CPU utilization over the window, with the latest value. Orange at 80%, red at 95% |
| Mem % | Sparkline of memory utilization, with the latest value. Orange at 75%, red at 90% |
Both percentages are against allocatable capacity, not against requests.
Hovering a colored value names the state, such as critical CPU utilisation.
See Health Thresholds.
Selecting a row scopes the whole app to that cluster and opens the Overview tab.
Below the table, a footnote explains an absence: provider, Kubernetes version and agent version are not collected under the cluster service name, so k8X omits those columns rather than showing them empty.
When a Cluster Is Missing
No clusters are reporting in the selected window. means no configured
cluster emitted node metrics in the window. When only some clusters are
missing, they simply do not appear as rows - there is no placeholder row for a
silent cluster.
The Overview tab is the better place to notice this, because its Clusters card compares reporting clusters against configured ones and names the silent ones on hover.
A cluster that never appears, rather than one that disappeared, usually means its configured service name does not match what its collector writes. See Select Your Clusters.
Use Cases
Finding the Cluster Under Pressure
- Sort by CPU % or Mem %, or read the colored values straight off the table
- Check the matching chart to tell a sustained climb from a brief spike
- Select the row to scope the app to that cluster, then open Nodes to find which nodes carry the load
Checking Capacity Before a Rollout
- Compare CPU % and Mem % across clusters for headroom
- Check Nodes not ready for capacity that is counted but unavailable
- Select the target cluster and open Namespaces to see how much of the headroom is already requested by existing workloads
Related Guides
- Getting Started - Interface layout and health thresholds
- Overview - Fleet health, including which clusters are reporting
- Nodes - The nodes behind each cluster's utilization
- Namespaces - How a cluster's capacity is committed