k8X Nodes
The Nodes tab lists every node across the clusters in scope, with the conditions, capacity and utilization that decide whether a node can still take work.
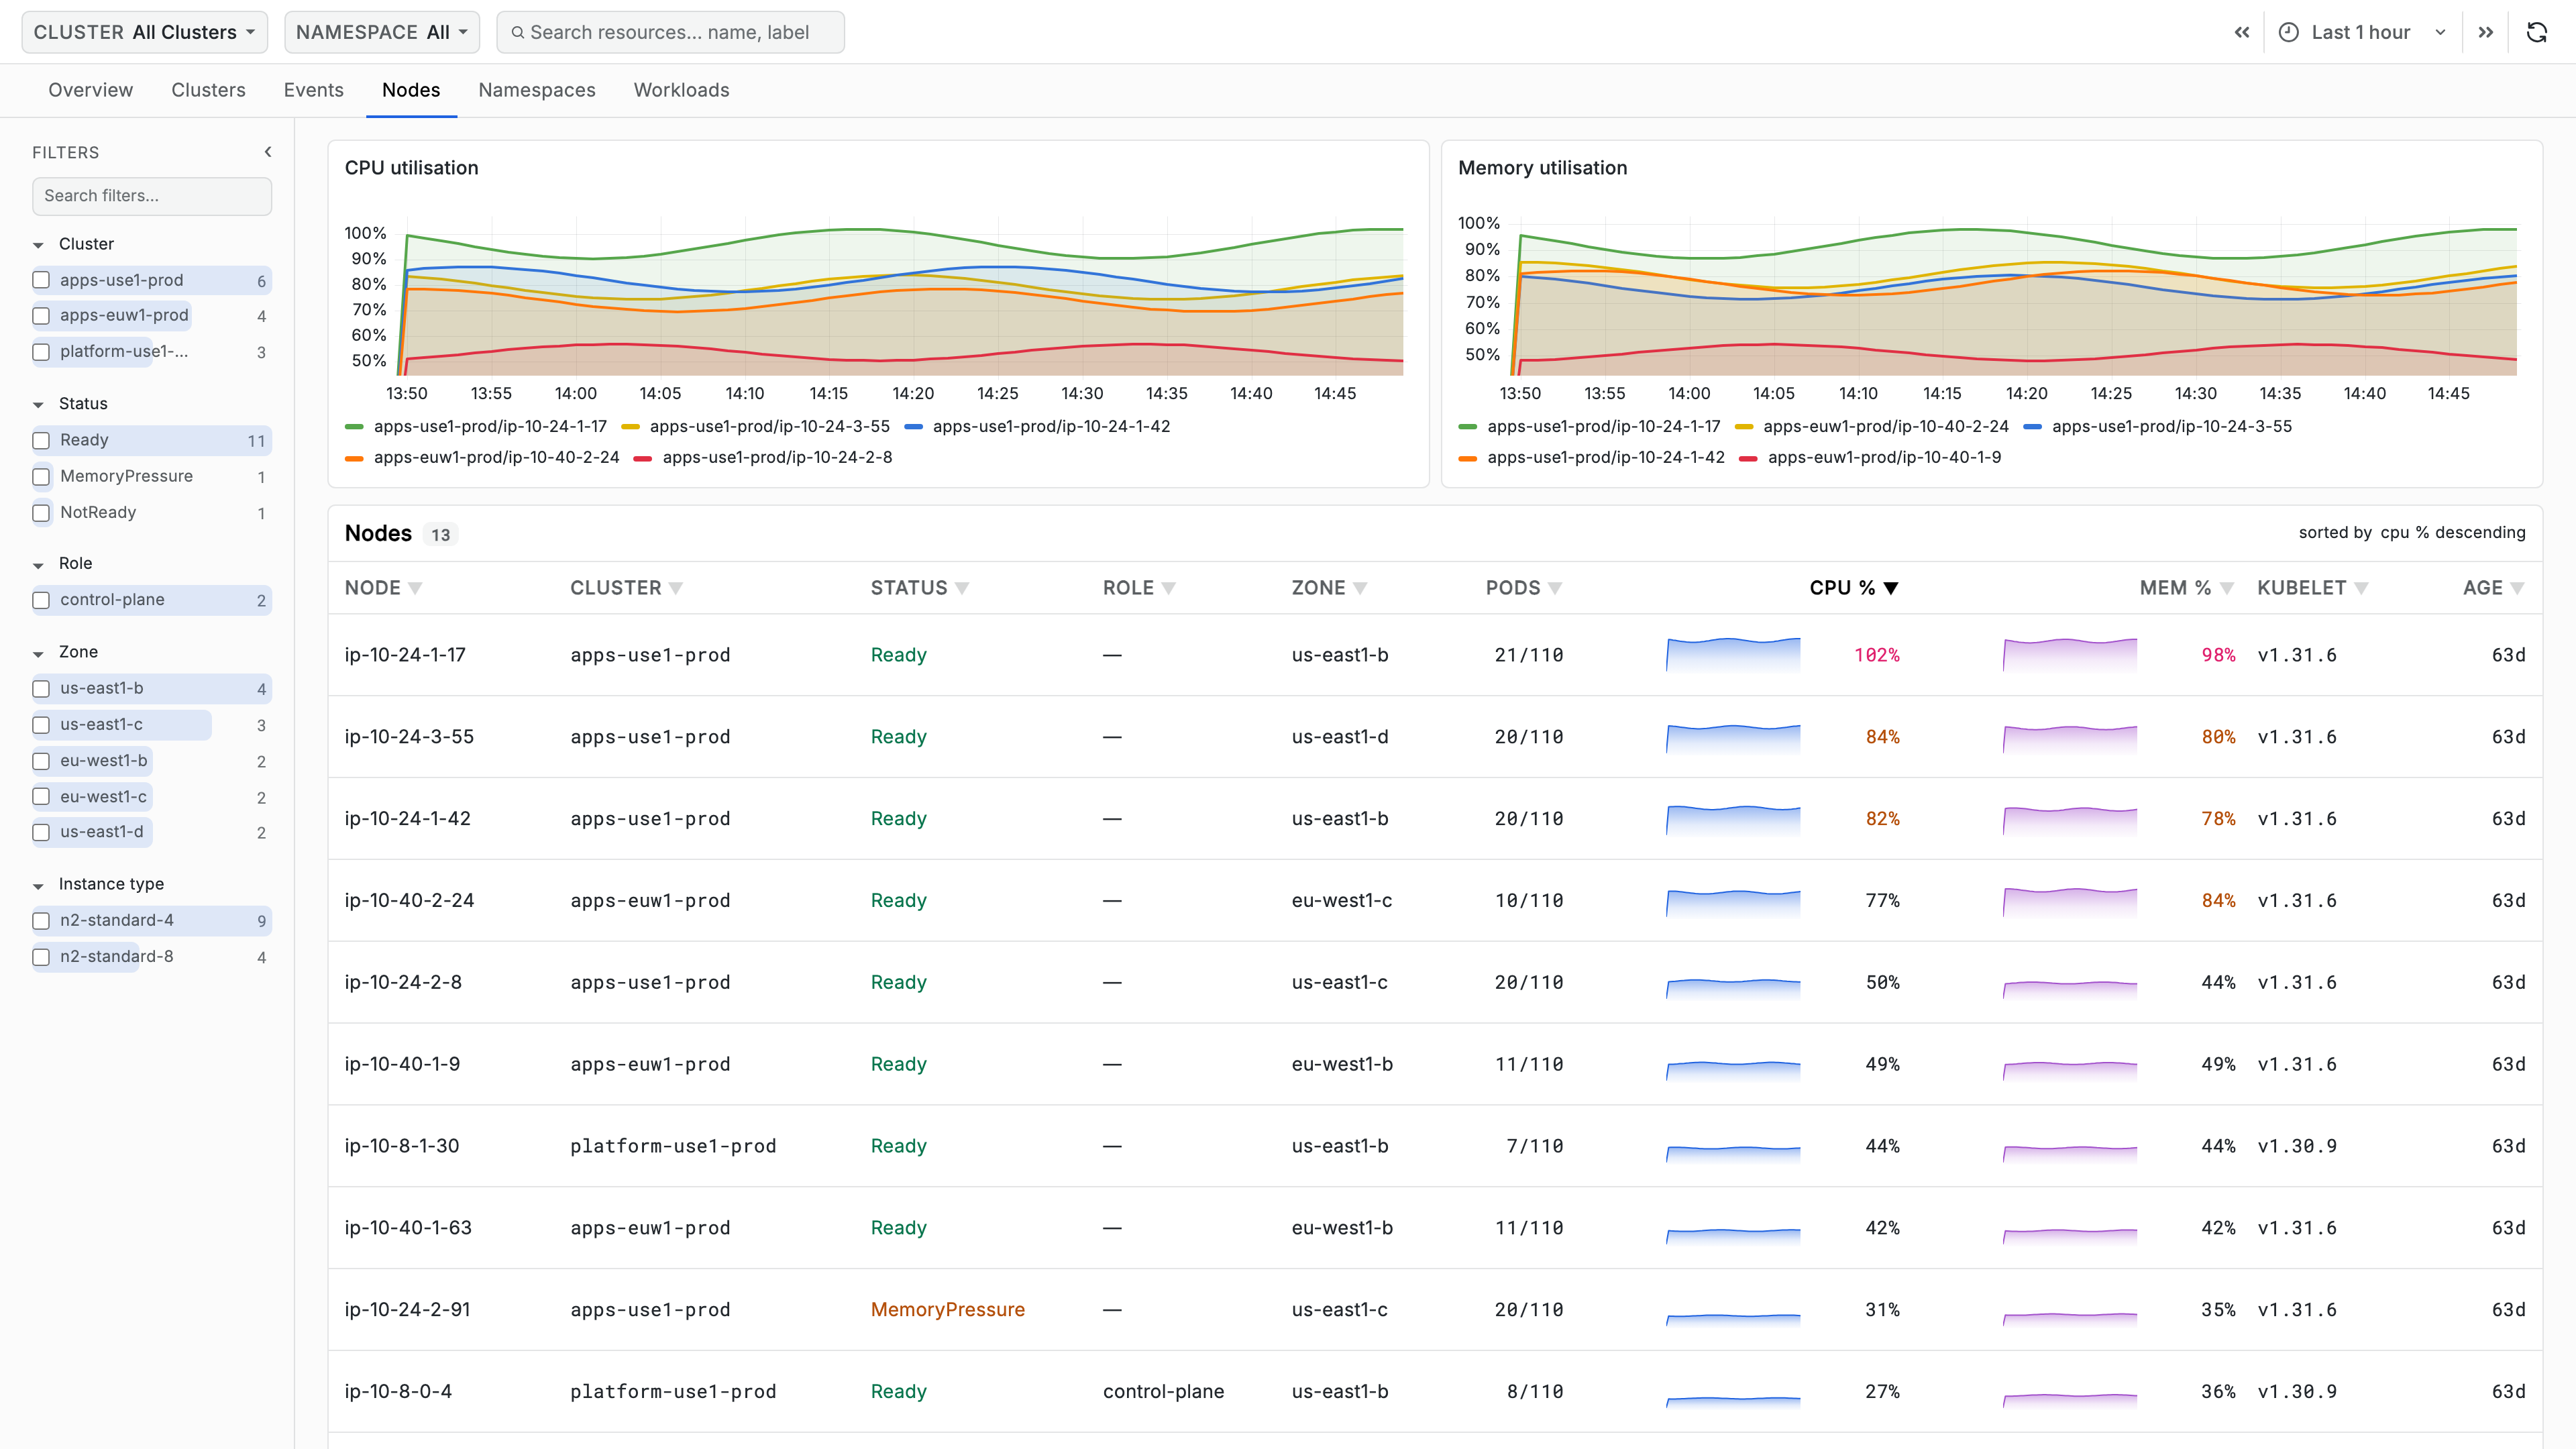
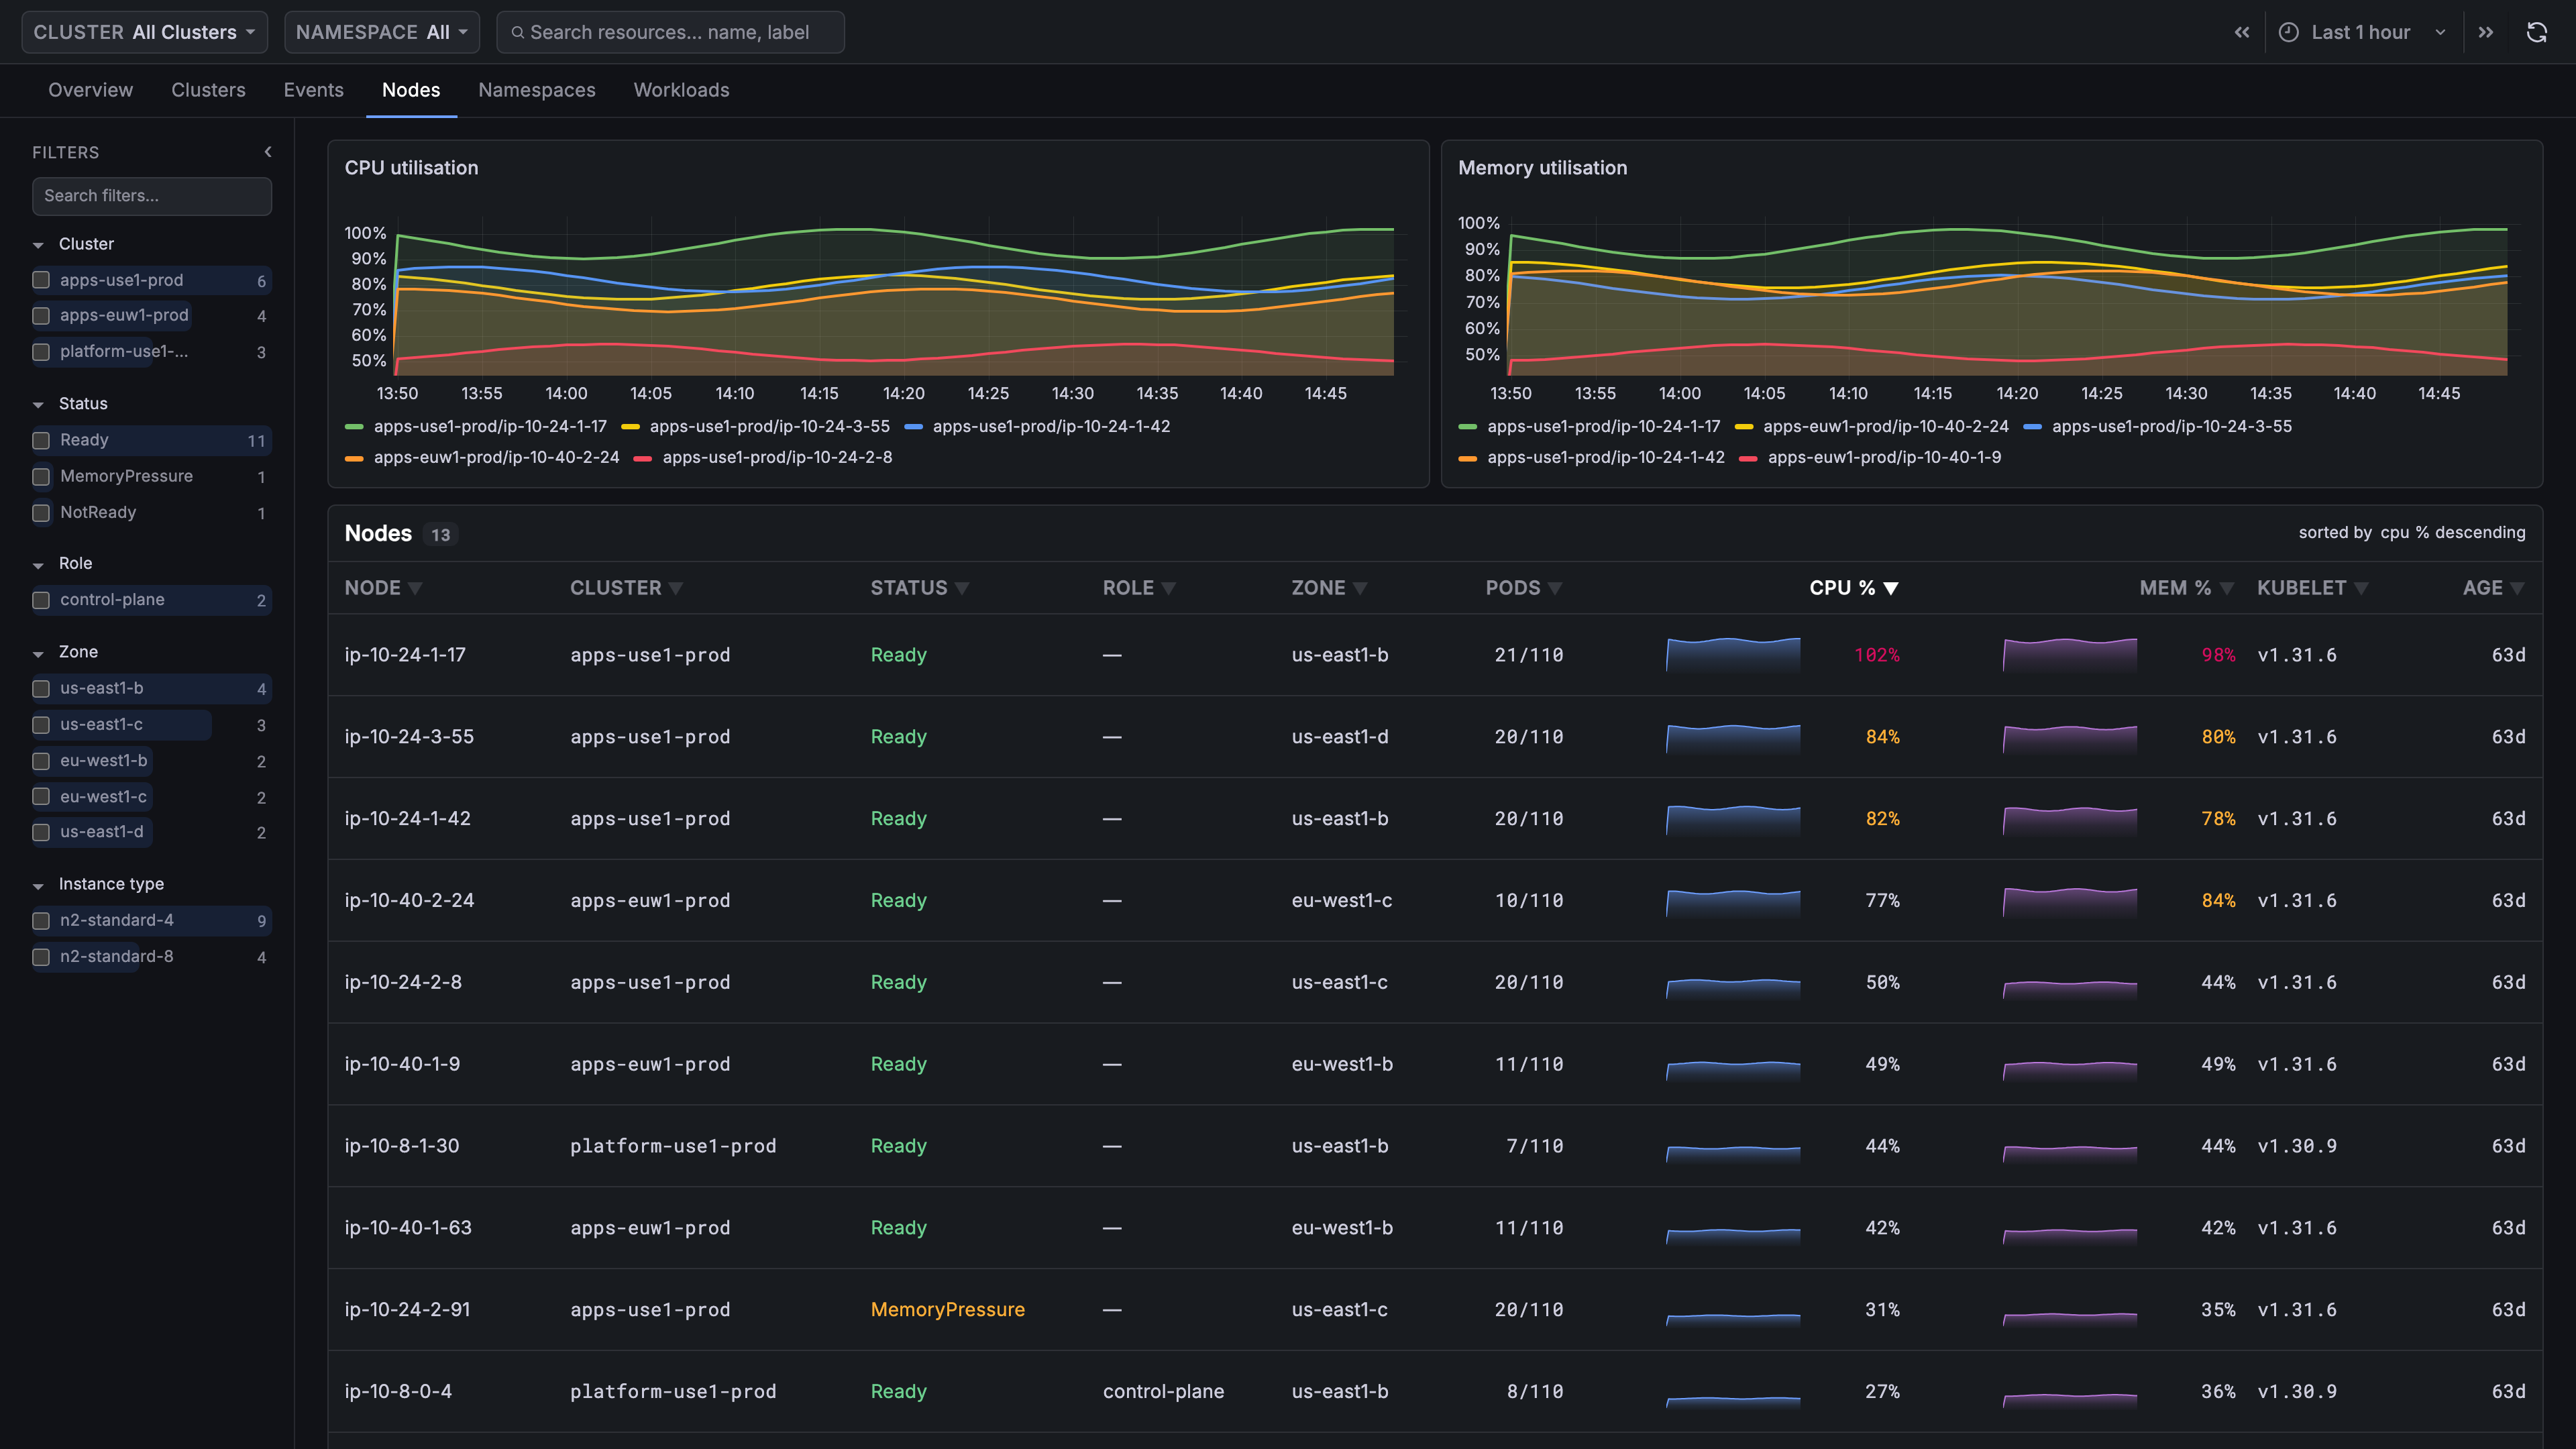
Filters
| Facet | Use it to... |
|---|---|
| Cluster | Narrow to one cluster's nodes |
| Status | Isolate Ready, NotReady, MemoryPressure, DiskPressure, or PIDPressure nodes |
| Role | Separate control-plane nodes from workers. Only control-plane nodes carry a role label, so workers show no value |
| Zone | Compare availability zones |
| Instance type | Compare machine types |
The search box matches node name, role, zone and instance type.
Node List
The CPU utilisation and Memory utilisation charts above the table cover the top five nodes only, so a node further down the table will not have a series there.
| Column | Description |
|---|---|
| Node | The node's name |
| Status | Ready, or NotReady in red, or a pressure condition in orange |
| Role | The node's role label, or — for a worker |
| Zone | The node's zone, or — |
| Pods | Running pods over allocatable pods, as 31/58 |
| CPU % | Sparkline and latest CPU utilization against allocatable. Orange at 80%, red at 95% |
| Mem % | Sparkline and latest memory utilization against allocatable. Orange at 75%, red at 90% |
| Kubelet | The kubelet version, or — |
| Age | How long the node has been in the cluster |
Rows are sorted by CPU utilization by default.
If Pods shows a bare count rather than 31/58, the collector is not
reporting pod capacity. Add pods to allocatable_types_to_report - see
Before You Start. Role, Zone,
Kubelet and Age come from node object snapshots, so if all four are
— across every row, the k8sobjects receiver is not collecting nodes.
Node Details
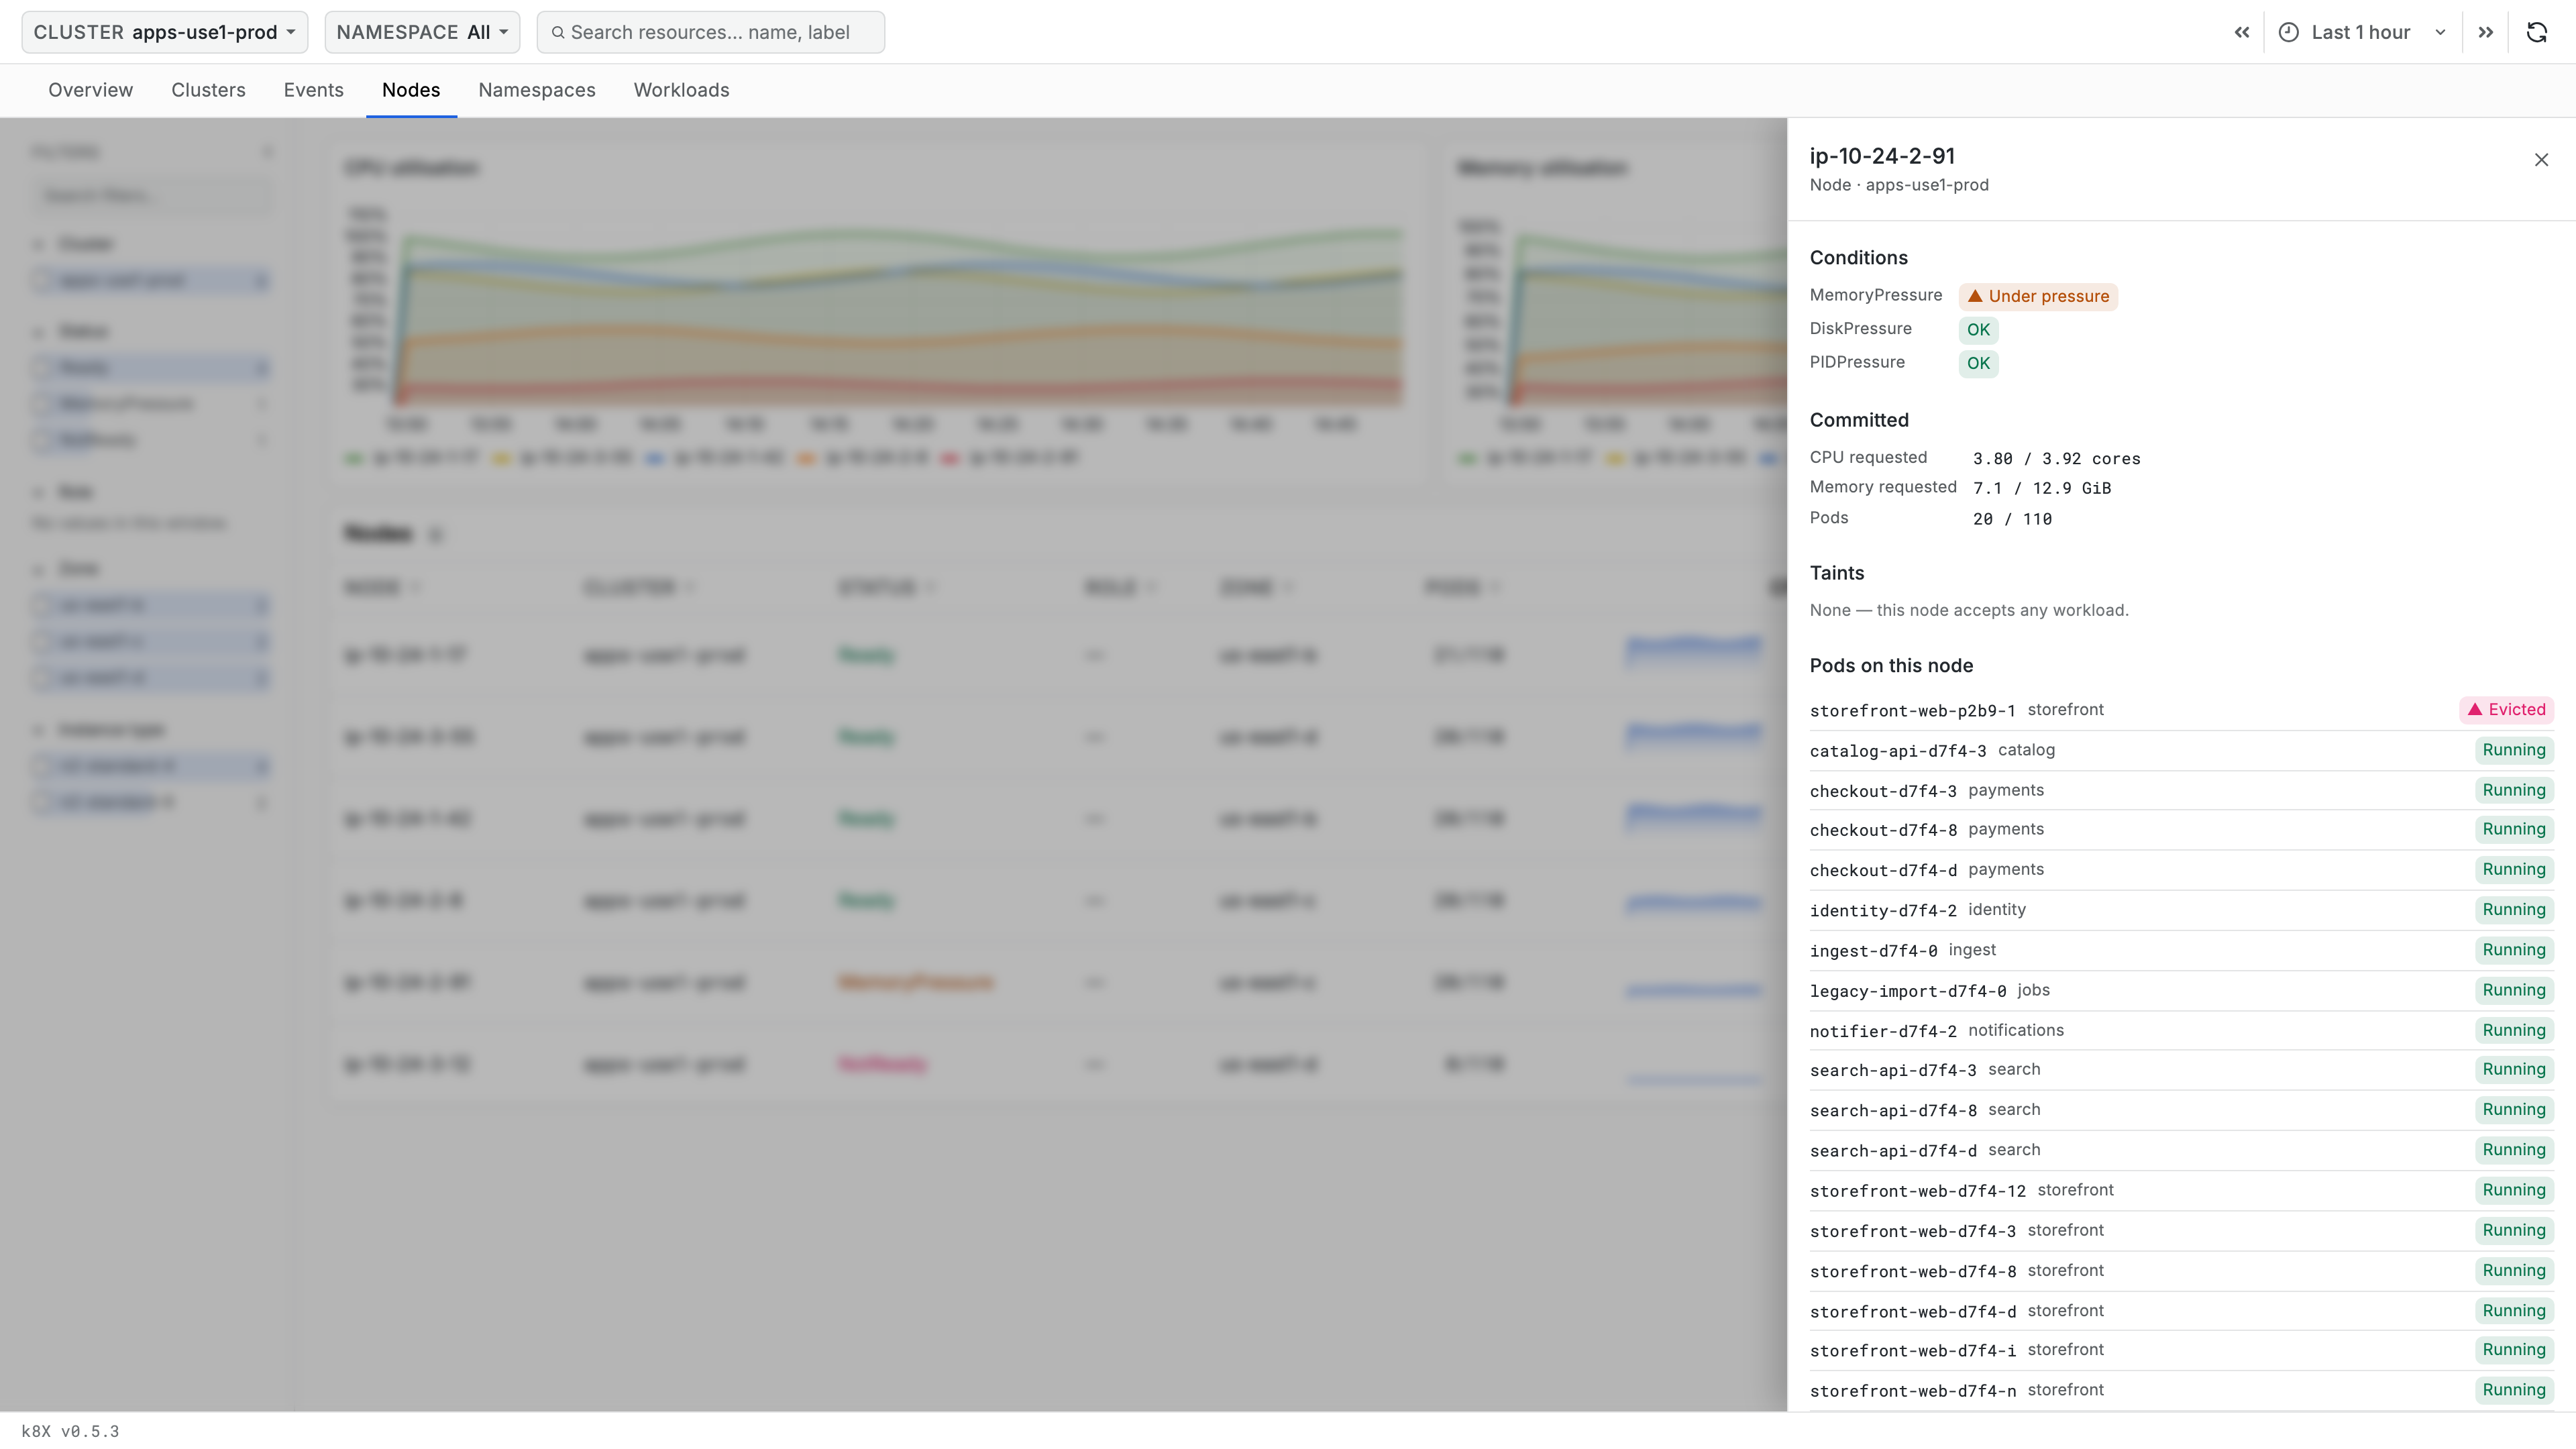
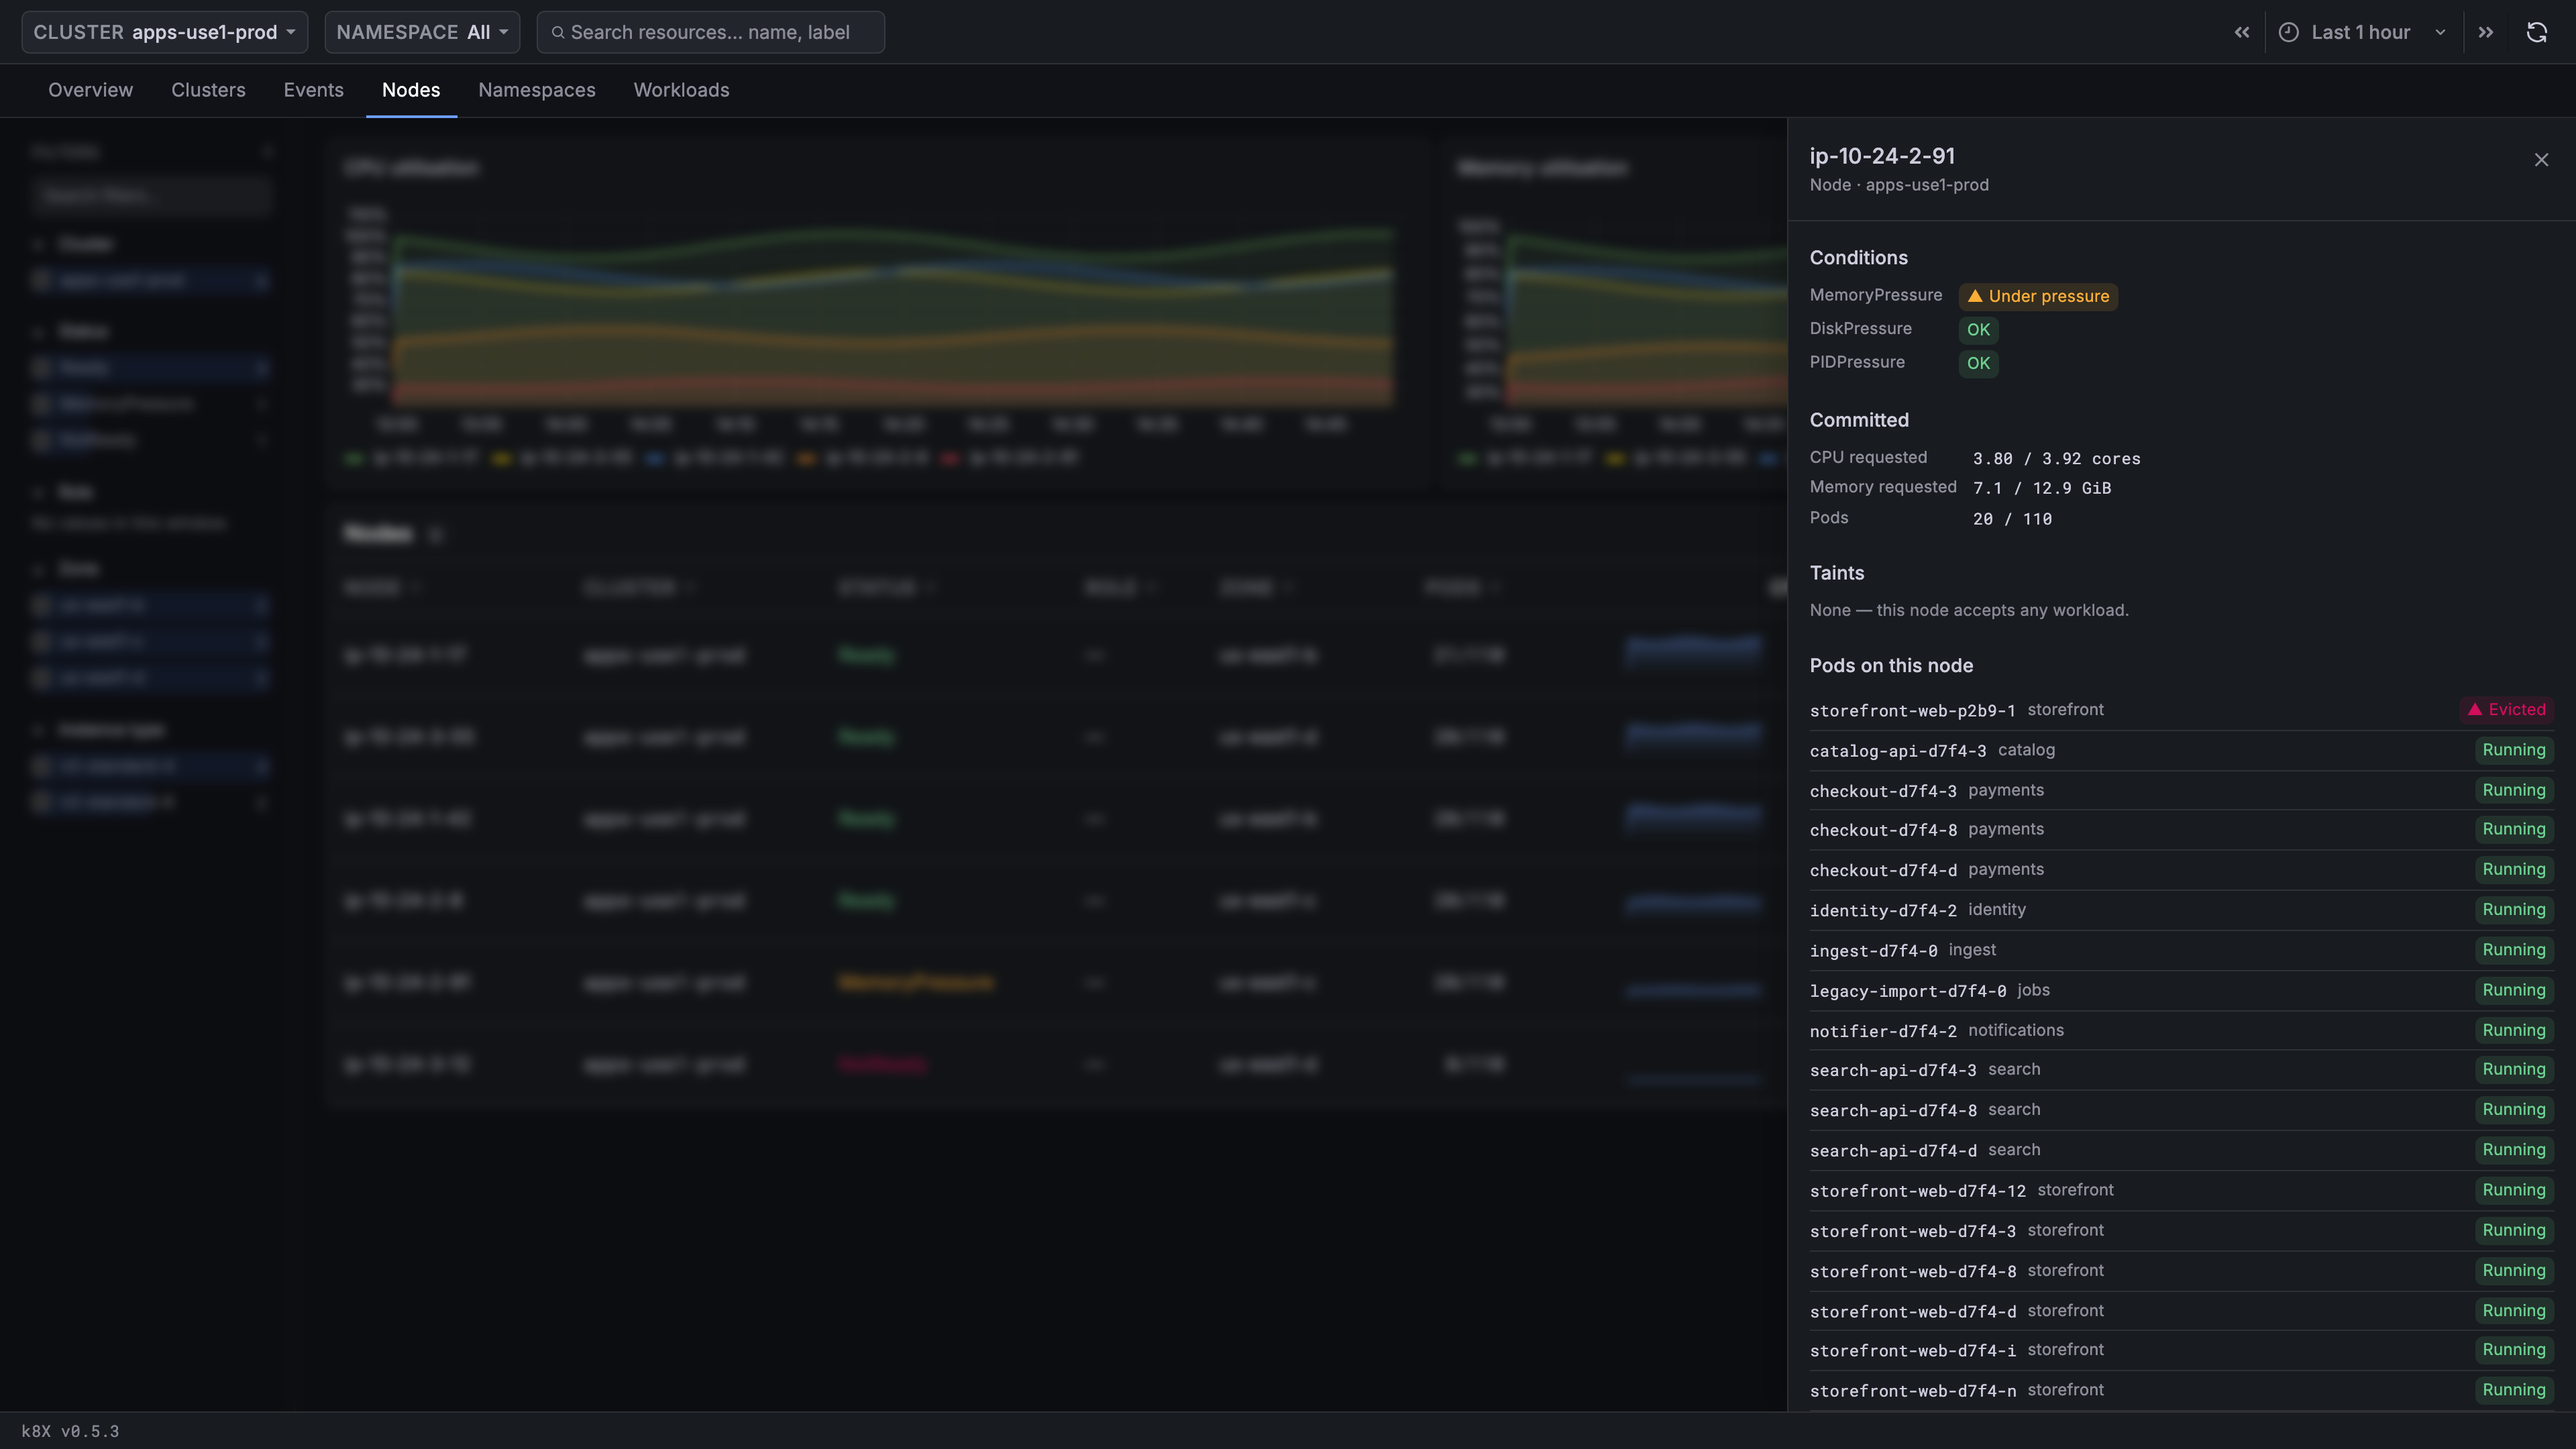
Select a node to open its detail panel.
Conditions
One row per condition the collector reports - Ready, MemoryPressure,
DiskPressure, PIDPressure, NetworkUnavailable. Each reads OK, or
Under pressure with a ▲ when the condition is firing.
Committed
How much of the node is already promised to the pods on it, which is what the scheduler actually reasons about:
- CPU requested -
12.50 / 16.00 cores - Memory requested -
41.2 / 62.0 GiB - Pods -
31 / 58
This is requests against allocatable, not usage against allocatable. A node
can sit at 30% CPU usage and still refuse new pods because its CPU
requests are fully committed. When a row reads Not collected, the
container request metrics are not enabled on the collector.
Taints
None — this node accepts any workload., or one line per taint as
key=value:Effect. This is the first thing to check when a DaemonSet is not
running everywhere.
Pods on this Node
Every pod scheduled here, unhealthy pods first, then alphabetical, each with its namespace and status.
Recent Events
Kubernetes events about this node in the selected window, each with its
reason, a ×N count when it repeated, its age, and its message. Warning
reasons are highlighted.
Host
Instance type and Kubelet, the two hardware and version facts that explain a node behaving differently from its peers.
Use Cases
Diagnosing a Node That Stopped Taking Pods
- Filter Status to the pressure conditions, or look for orange in the Status column
- Open the node and read Conditions to confirm which pressure is firing
- Check Committed - if CPU or memory requests are near allocatable, the node is full by request even if usage looks modest
- Check Taints for something added recently
- Read Recent Events for the scheduler's own account
Finding Why a DaemonSet Skips a Node
- Open the node the DaemonSet is missing from
- Read Taints - a taint with no matching toleration is the usual cause
- Cross-check the DaemonSet's Node Coverage section on the Workloads tab, which names the gap and its reason
Comparing a Slow Zone or Instance Type
- Filter by Zone or Instance type
- Compare CPU % and Mem % across the filtered set
- Open an outlier and check Host to confirm the machine type, then Pods on this Node for what it is actually running
Related Guides
- Getting Started - Prerequisites and health thresholds
- Clusters - Cluster-level capacity these nodes roll up into
- Workloads - The pods scheduled onto these nodes
- Events - Full event stream, including scheduling failures