k8X Overview
The Overview tab is the first screen k8X opens on: the state of your whole fleet in one page. Every stat card is a link into the tab that explains it, carrying the relevant filter with it, so the usual path through k8X starts here and drills down.


Fleet Status
Above the cards, a single line says how much of your fleet is actually
reporting: 8 of 10 clusters reporting when a cluster has gone quiet, or
10 clusters in scope when everything is healthy. To the right, as of Jan 5, 14:32 records when the panels last loaded successfully.
"Reporting" means the cluster emitted node metrics in the last 150 seconds - two and a half scrape intervals at the standard 60-second cadence. A cluster that stops reporting is almost always a collector problem rather than a cluster problem.
Stat Cards
Each card shows a count, a sub-line summarizing its health, and a ▲ when
the state is one you would want to act on. A — means no data.
| Card | Value | Sub-line | Opens |
|---|---|---|---|
| Clusters | Clusters currently reporting | 3 not reporting ▲, 2 unhealthy ▲, or all healthy | Clusters tab |
| Nodes | Nodes across all clusters | 4 not ready ▲ or all ready | Nodes tab, filtered to NotReady when any node is not ready |
| Pods | Pods across all clusters | 126 running · 2 pending · 1 failed ▲ | Workloads tab on the Pods sub-tab, filtered to failed pods when there are any |
| Workloads | Deployments, DaemonSets, StatefulSets, and ReplicaSets | 5 unhealthy ▲ or all healthy | Workloads tab, filtered to unhealthy |
| Warning events | Warning events in the window | in the last 1h, or in the last 1h · 4/10 clusters when some clusters shipped none | Events tab, filtered to Warning |
Hovering the Clusters card names the silent clusters and how many are configured. If a card fails to load it says so and becomes a retry button rather than a link.
Charts


- Pods by status -
Running,Pending, andFailedpod counts over the window. A step change here usually pairs with something in the events table below. - Cluster CPU / Memory utilization - CPU and memory utilization per
cluster, as a percentage of allocatable. Two series per cluster, named
<cluster> CPUand<cluster> memory.
Drag across either chart to narrow the whole page's time range to that span.
Unhealthy Workloads
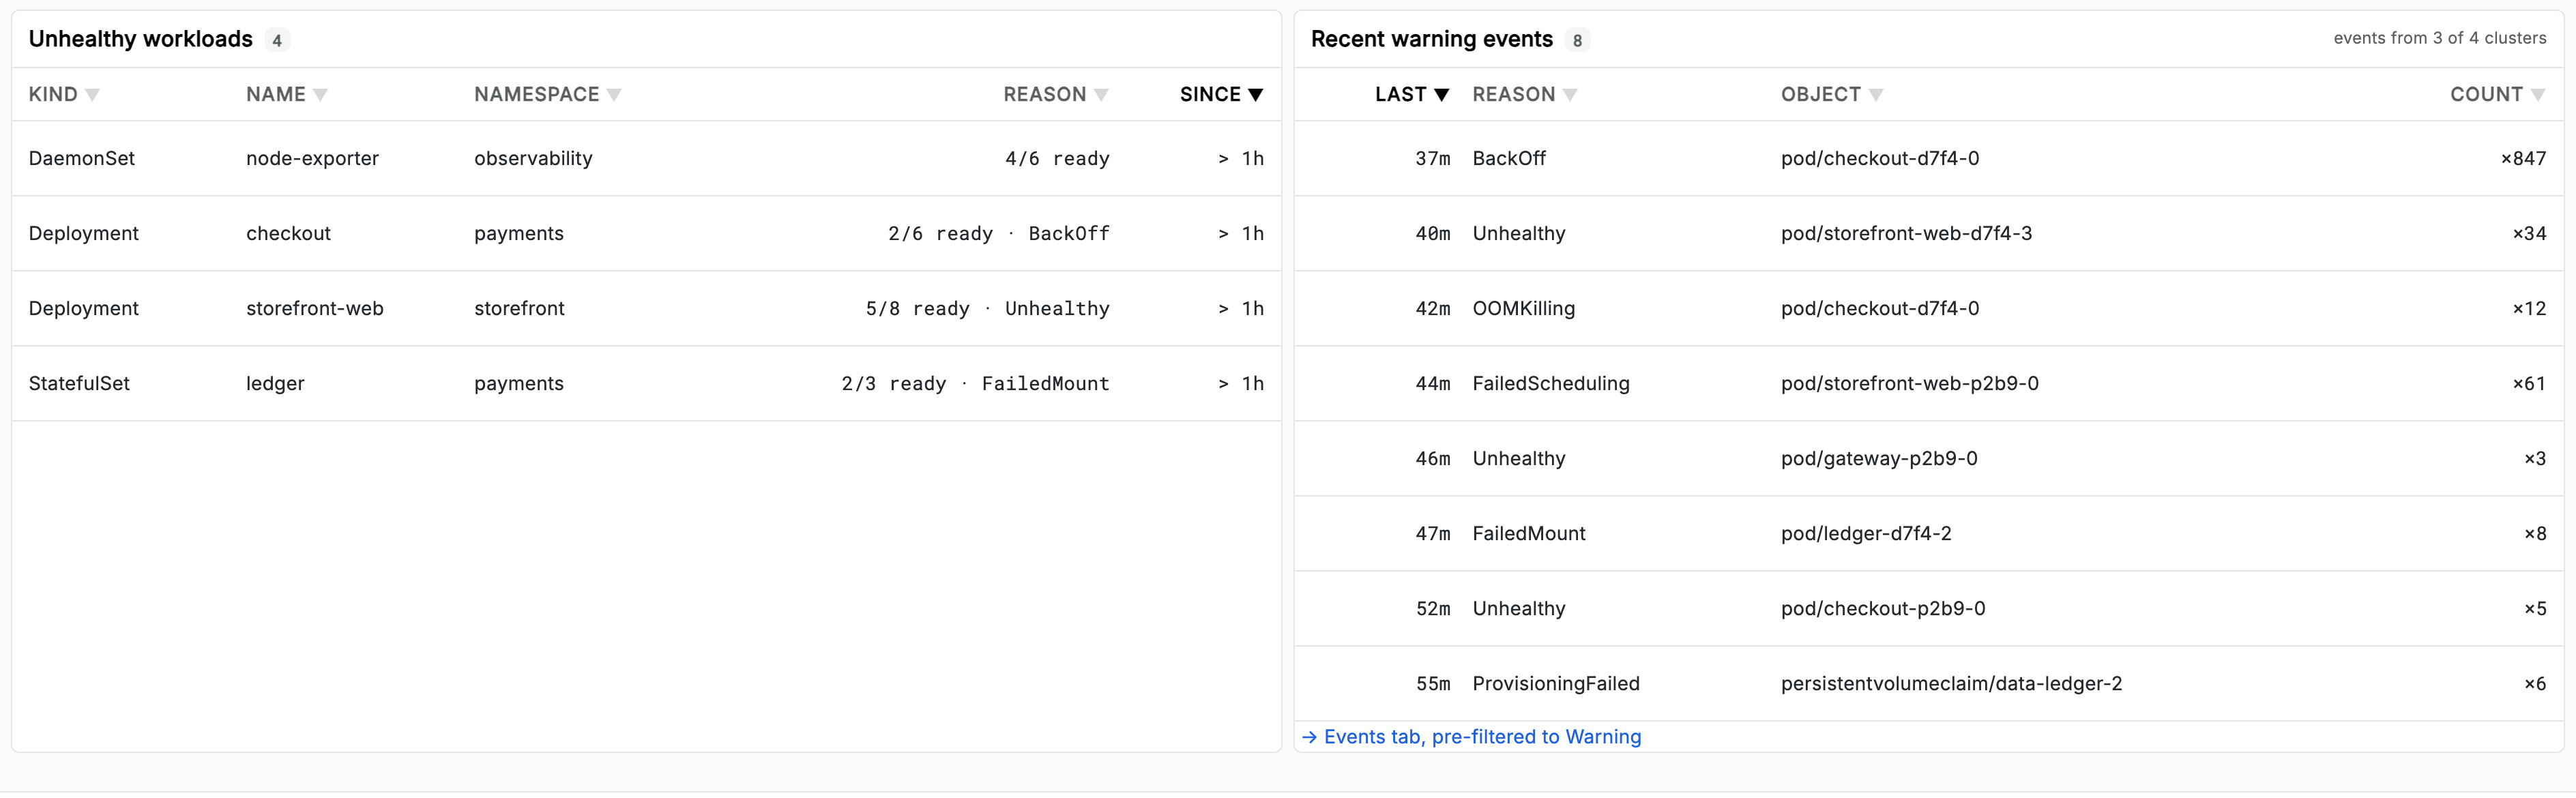
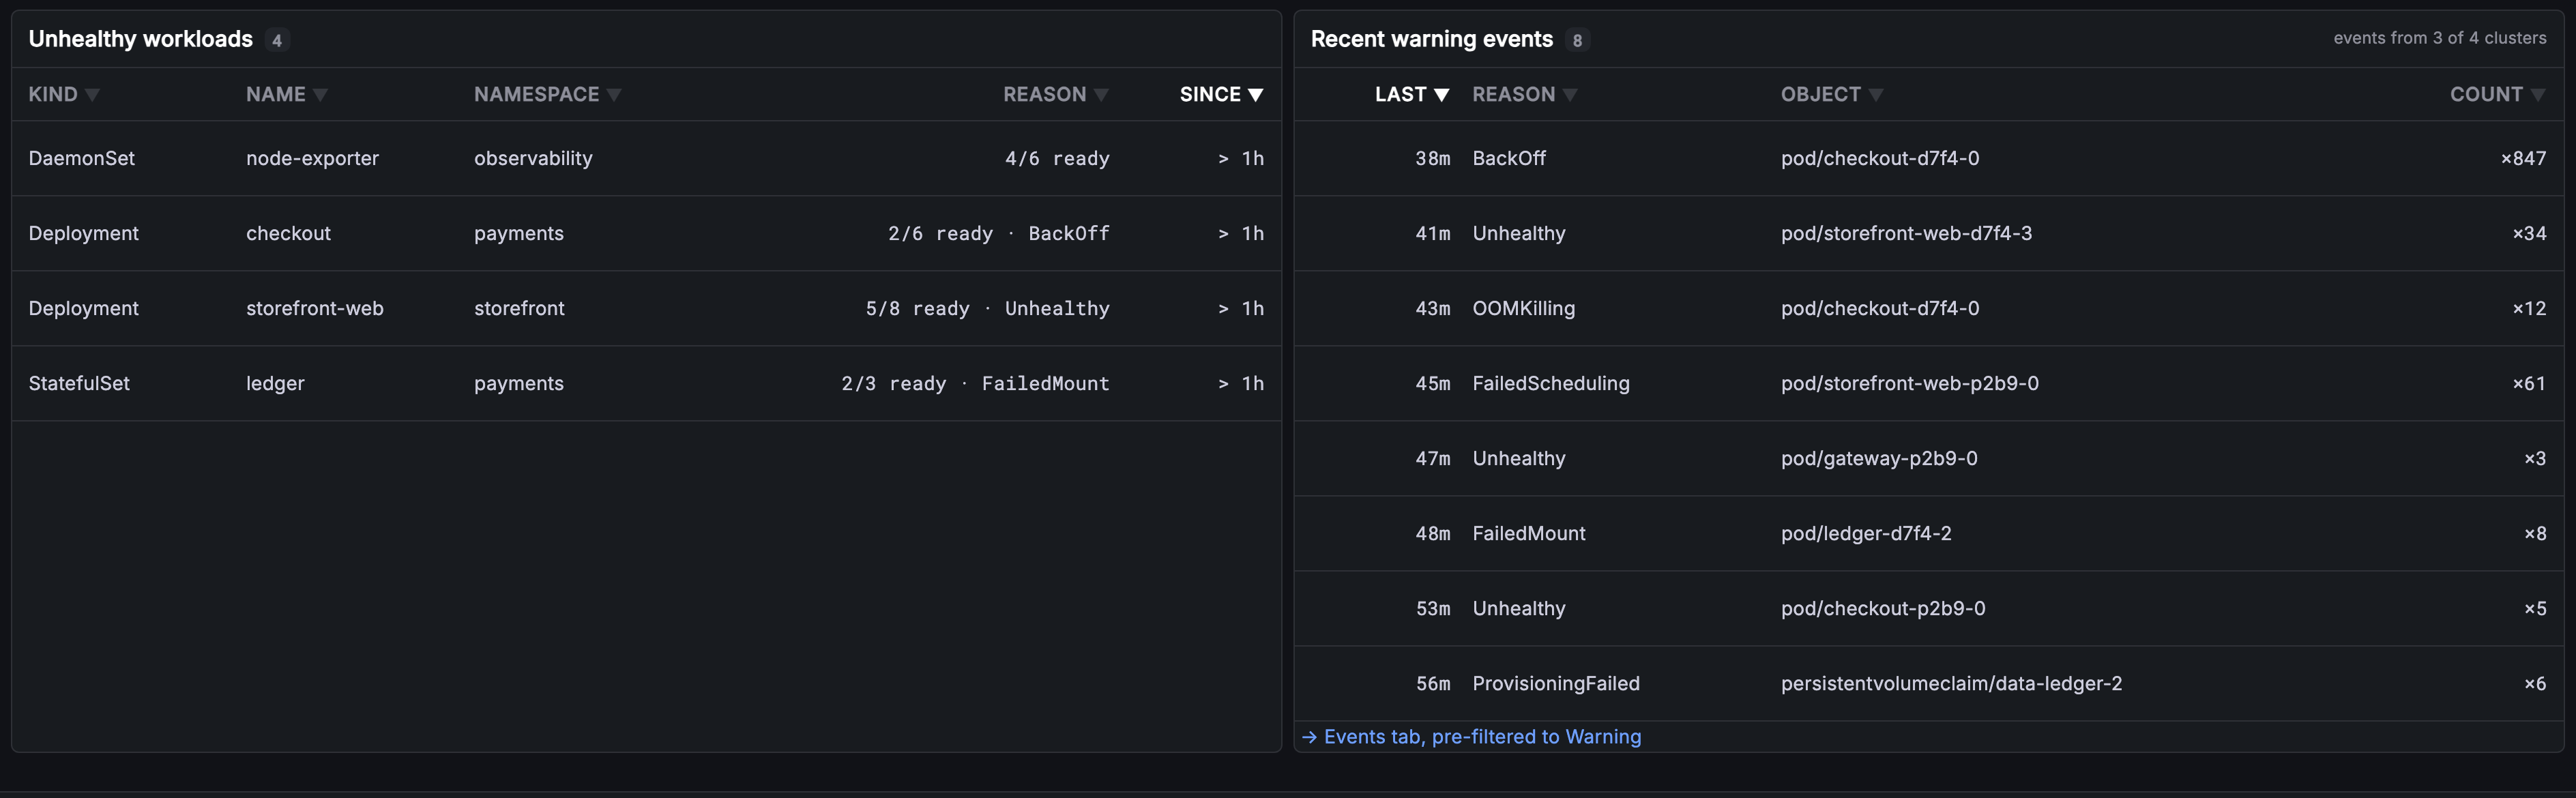
Every workload not at its desired replica count, newest problem first.
| Column | Description |
|---|---|
| Kind | Deployment, DaemonSet, StatefulSet, or ReplicaSet |
| Name | The workload's name |
| Namespace | The namespace it runs in |
| Reason | Replica shortfall as 2/3 ready, plus a matching recent event reason when one exists - 2/3 ready · OOMKilled |
| Since | How long it has been unhealthy: 40m, 2h, 3d. Shows the window length prefixed with > when it was already unhealthy when the window opened |
Selecting a row opens the Workloads tab scoped to that workload's kind, name and namespace.
The event reason in Reason is advisory. It matches on the workload's name, so on the rare fleet running identically named workloads in different clusters it can attach the wrong cluster's event. Confirm on the Events tab before acting on it.
When there is nothing to show, the table reads
All workloads healthy in the selected scope. On a very large fleet it may
also warn that the list was truncated and ask you to narrow the cluster or
namespace scope.
Recent Warning Events
The ten most recent warning events across the selected clusters.
| Column | Description |
|---|---|
| Last | How long ago the event last fired: 12s, 4m, 3h, 2d |
| Reason | The Kubernetes event reason, such as FailedScheduling |
| Object | The object it concerns, as pod/checkout-7d9f |
| Count | How many times it fired, as ×12 |
A button below the table opens the Events tab pre-filtered to warnings.
Two notes can appear beside the panel title, and both are about coverage rather than about your cluster:
all clusters- some events carry no cluster attribute, so those rows are shown against every cluster.events from 4 of 10 clusters- the named clusters shipped no Kubernetes events in this window. Hovering says which, and suggests the usual cause: thek8sobjectsreceiver is not enabled on them. See Before You Start.
If no cluster in scope has ever shipped events, the panel says so directly rather than showing an empty table.
Use Cases
Morning Fleet Check
- Read the fleet status line - if it says
N of M clusters reporting, start with the silent clusters on the Clusters tab, because everything below is missing their data - Scan the five stat cards for a
▲ - Open whichever card carries one; the filter travels with you
Tracing a Pod Failure to its Cause
- Note the failed count on the Pods card and select it to open the Workloads tab already filtered to failed pods
- Check Unhealthy workloads for the owning workload and its Reason -
OOMKilledandFailedSchedulingpoint in very different directions - Confirm on the Events tab, which carries the full message
Confirming a Deploy Landed Cleanly
- Set the time picker to cover the deploy
- Watch Pods by status for a
Pendingbulge that drains back toRunning; one that does not drain is a rollout that did not complete - Check Unhealthy workloads for the workload you deployed, and its Since value against your deploy time
Related Guides
- Getting Started - Interface layout, prerequisites, and shared filters
- Clusters - Per-cluster capacity and node readiness
- Workloads - The workloads behind the unhealthy list
- Events - Full event stream with facets and messages