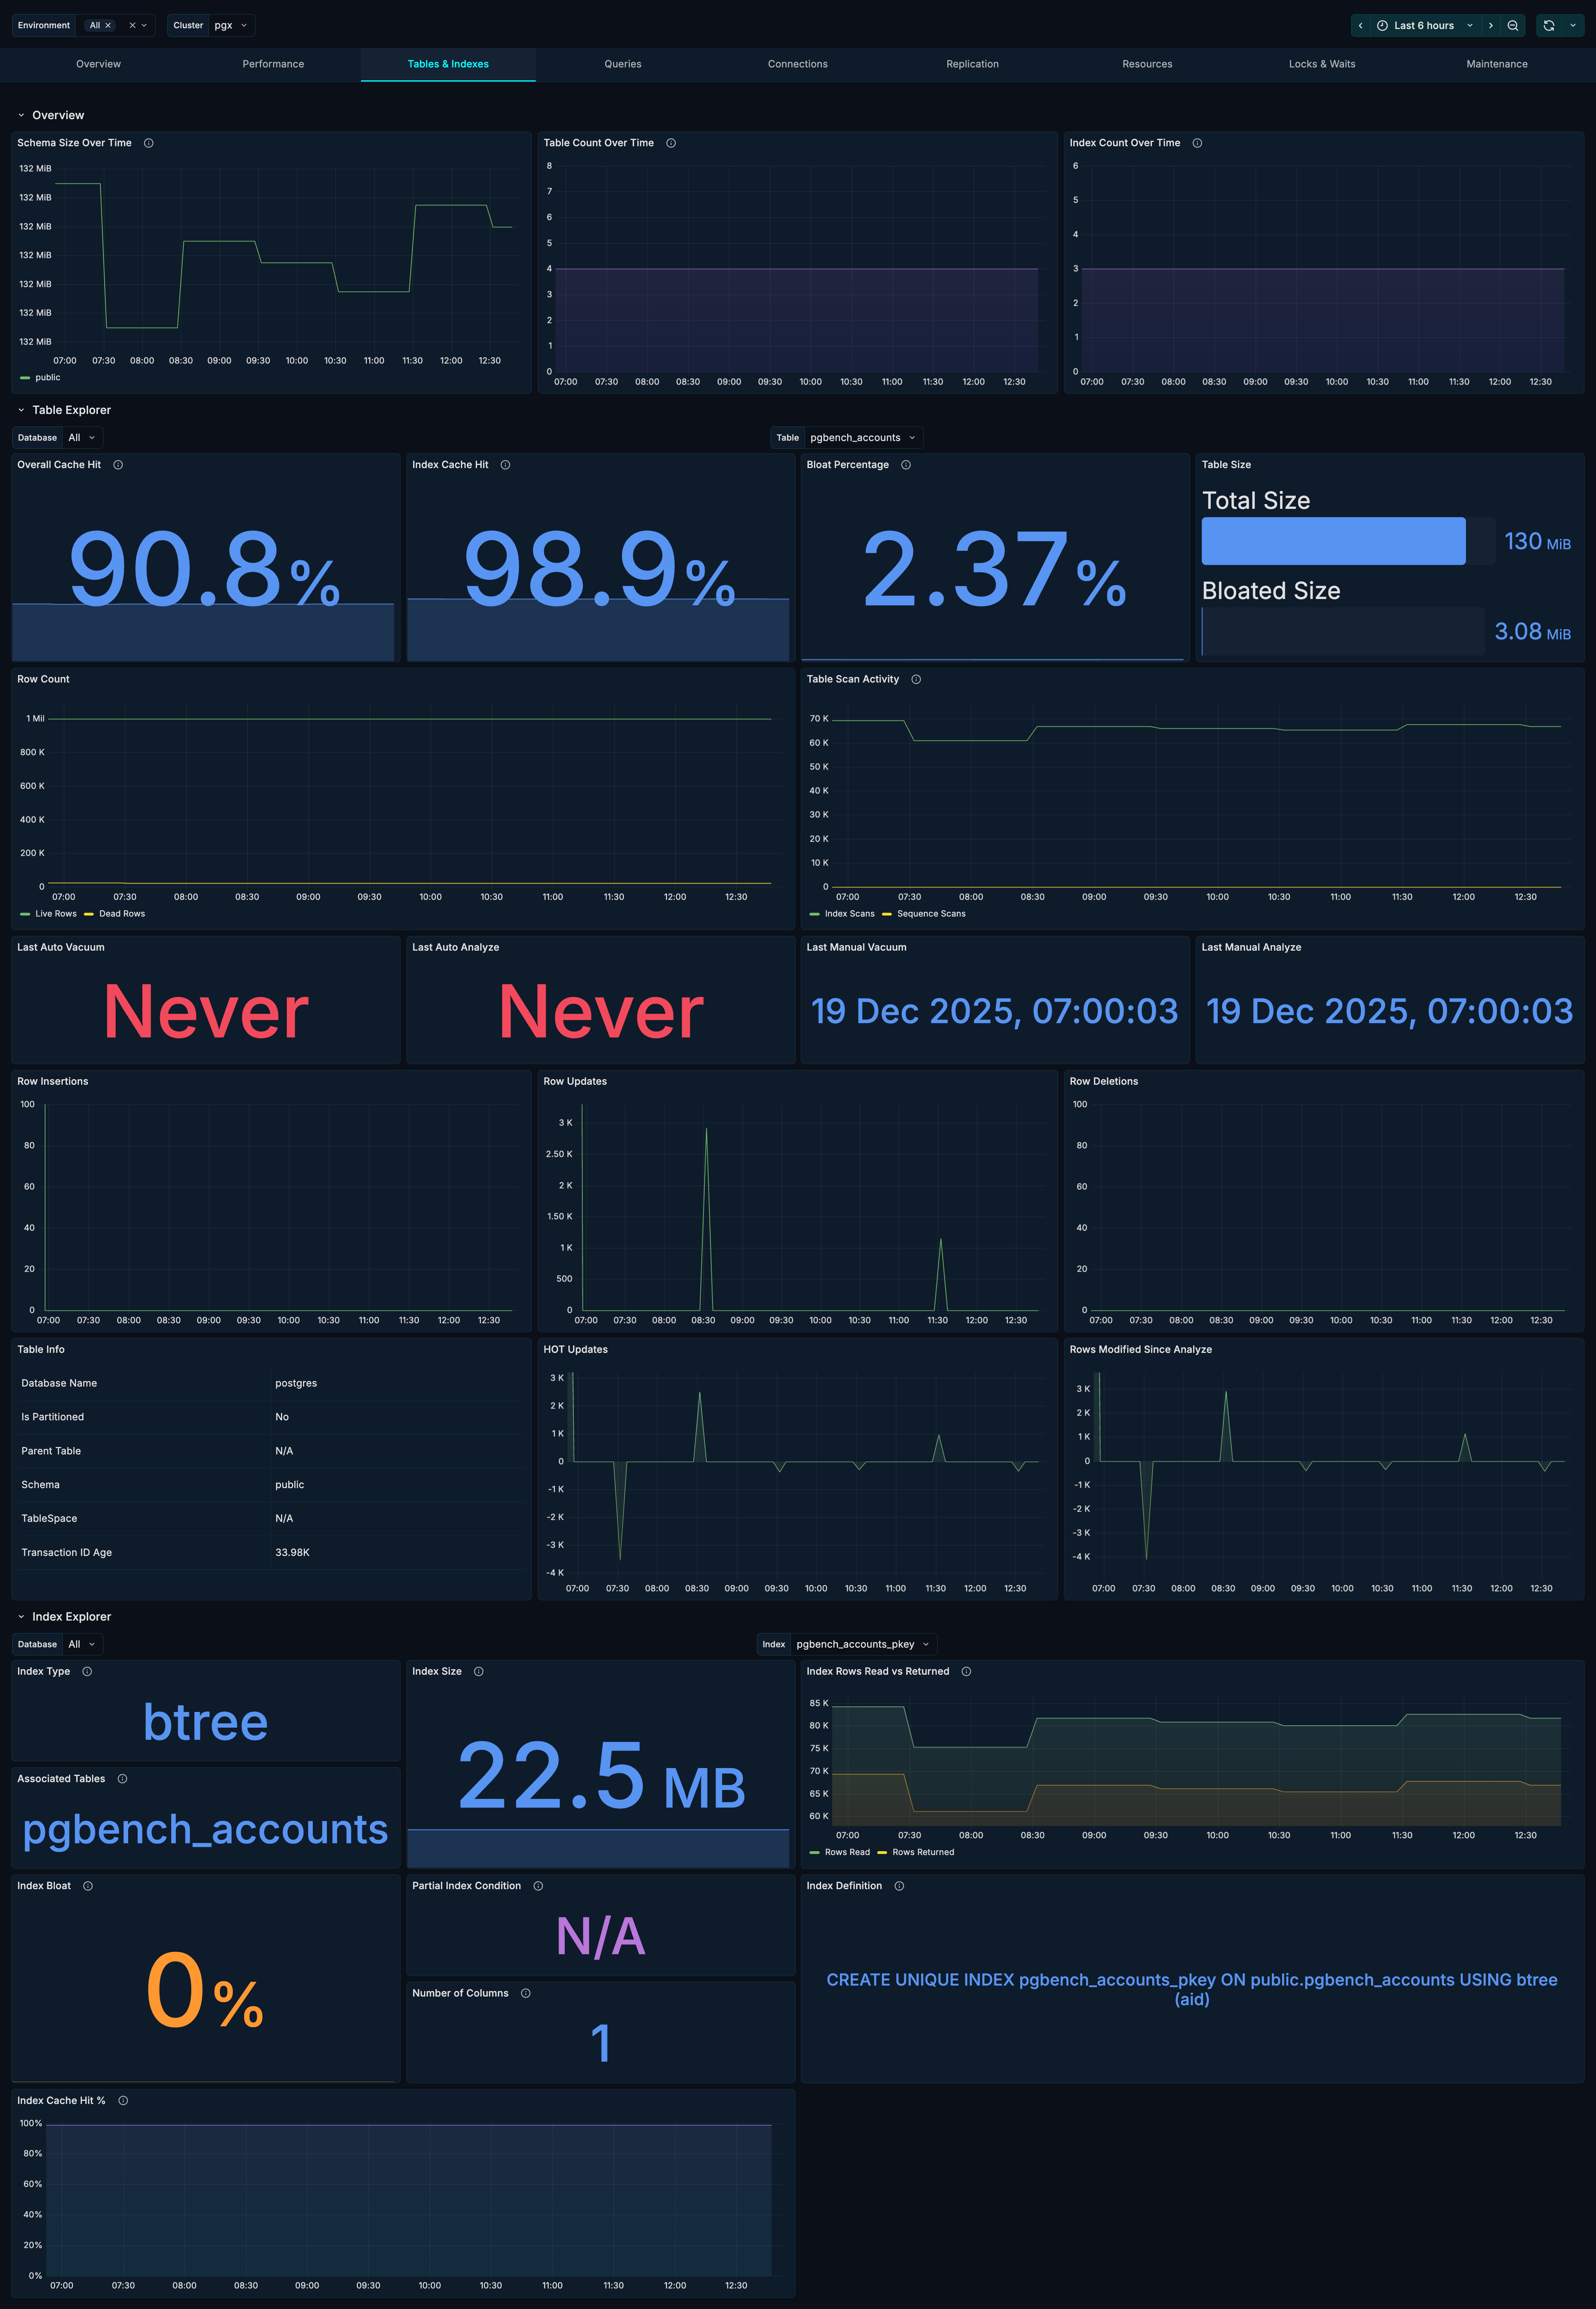
Tables & Indexes
The Tables & Indexes tab provides detailed insights into table health, index effectiveness, and storage optimization opportunities. Use it to identify bloated tables, underutilized indexes, and maintenance needs.
Sections
The Tables & Indexes tab is organized into three sections:
- Overview - High-level table and index counts
- Table Explorer - Deep dive into individual table metrics
- Index Explorer - Detailed index analysis
Overview Section
The Overview section provides cluster-wide table and index metrics.
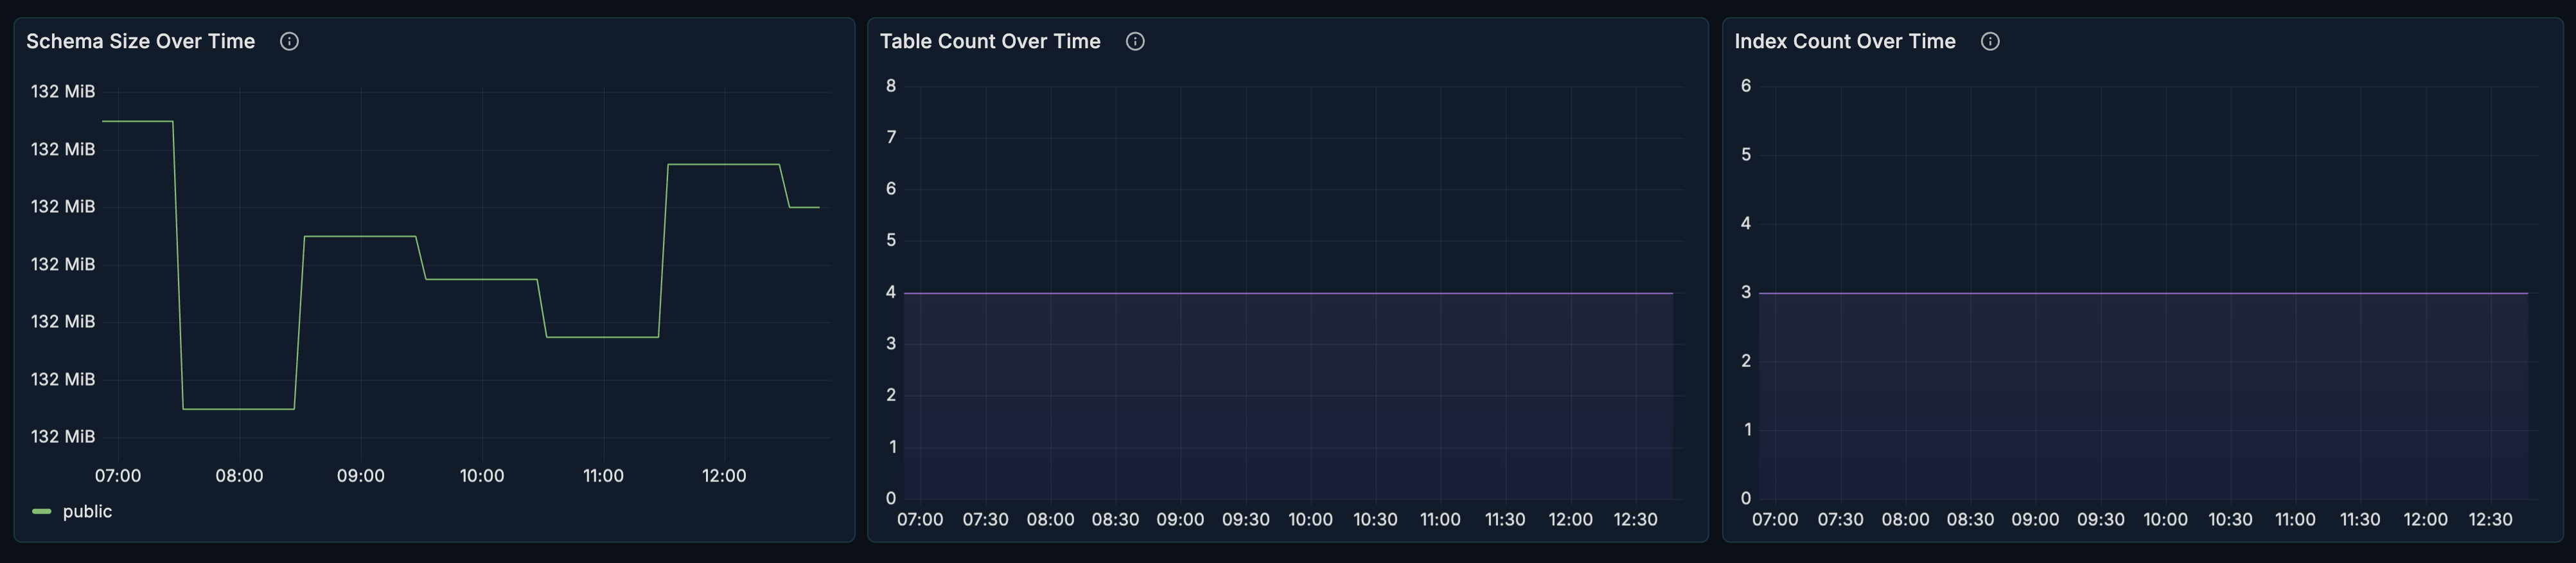
Schema Size
What it shows: Total size of schemas over time.
How to use it:
- Track storage growth trends
- Identify schemas consuming most space
- Plan capacity and cleanup
Table Count
What it shows: Number of tables over time.
How to use it:
- Track schema evolution
- Detect unexpected table creation
- Monitor temporary table patterns
Index Count
What it shows: Number of indexes over time.
How to use it:
- Track index growth
- Ensure indexes are being created as expected
- Detect index sprawl
Table Explorer Section
The Table Explorer allows you to drill down into individual table metrics. This section is collapsed by default - click to expand.

Filters
| Filter | Description |
|---|---|
| Database | Select the database to explore |
| Table | Select the specific table to analyze |
Key Stats Row
Four stat panels showing critical table health indicators:
Overall Cache Hit Ratio
What it shows: Percentage of reads served from buffer cache.
Healthy range: > 99% for frequently accessed tables.
When to investigate:
- Cache hit ratio below 95%
- Sudden drops in cache hit ratio
- Tables with unexpectedly low ratios
Index Cache Hit Ratio
What it shows: Percentage of index reads from cache vs disk.
Healthy range: > 99% for indexed queries.
When to investigate:
- Low index cache hits indicate memory pressure
- May need to increase
shared_buffers - Consider index optimization
Bloat Percentage
What it shows: Estimated wasted space due to dead tuples.
Healthy range: < 20% for most tables.
When to investigate:
- Bloat > 20% - consider VACUUM
- Bloat > 50% - consider VACUUM FULL or pg_repack
- Rapidly increasing bloat
Table Size
What it shows: Current table size as a bar gauge.
How to use it:
- Quick visual reference for table size
- Compare relative sizes across tables
- Track growth over time
Row Metrics
Row Count
What it shows: Live and dead row counts over time.
How to interpret:
- Growing dead rows = vacuum falling behind
- Sudden live row drops = mass deletions
- Stable ratios = healthy maintenance
Table Scan Activity
What it shows: Sequential scans vs index scans.
What to look for:
- High sequential scans on large tables = missing indexes
- All index scans = good index coverage
- Mix depends on query patterns
Vacuum & Analyze Stats
Four panels showing maintenance timestamps:
| Panel | Description |
|---|---|
| Last Auto Vacuum | When autovacuum last ran |
| Last Auto Analyze | When autoanalyze last ran |
| Last Manual Vacuum | When manual VACUUM was run |
| Last Manual Analyze | When manual ANALYZE was run |
When to investigate:
- Very old timestamps indicate maintenance issues
- Frequent manual runs may indicate autovacuum tuning needed
- Missing autovacuum runs on busy tables
Row Activity
Three time-series panels showing row operations:
Row Insertions
What it shows: Insert rate over time.
How to use it:
- Track data ingestion patterns
- Identify bulk load operations
- Correlate with application behavior
Row Updates
What it shows: Update rate over time.
How to use it:
- Track update-heavy workloads
- Identify update storms
- Plan for bloat management
Row Deletions
What it shows: Delete rate over time.
How to use it:
- Track data purge patterns
- Identify mass delete operations
- Plan vacuum scheduling
Additional Table Metrics
Table Info
What it shows: Table metadata including schema, tablespace, and partitioning info.
HOT Updates
What it shows: Heap-Only Tuple updates over time.
Why it matters:
- HOT updates are more efficient (no index update needed)
- High HOT ratio = good fillfactor configuration
- Low HOT ratio = consider adjusting fillfactor
Rows Modified Since Analyze
What it shows: Number of rows changed since last ANALYZE.
Why it matters:
- High values may indicate stale statistics
- Query planner uses statistics for optimization
- May need more frequent ANALYZE
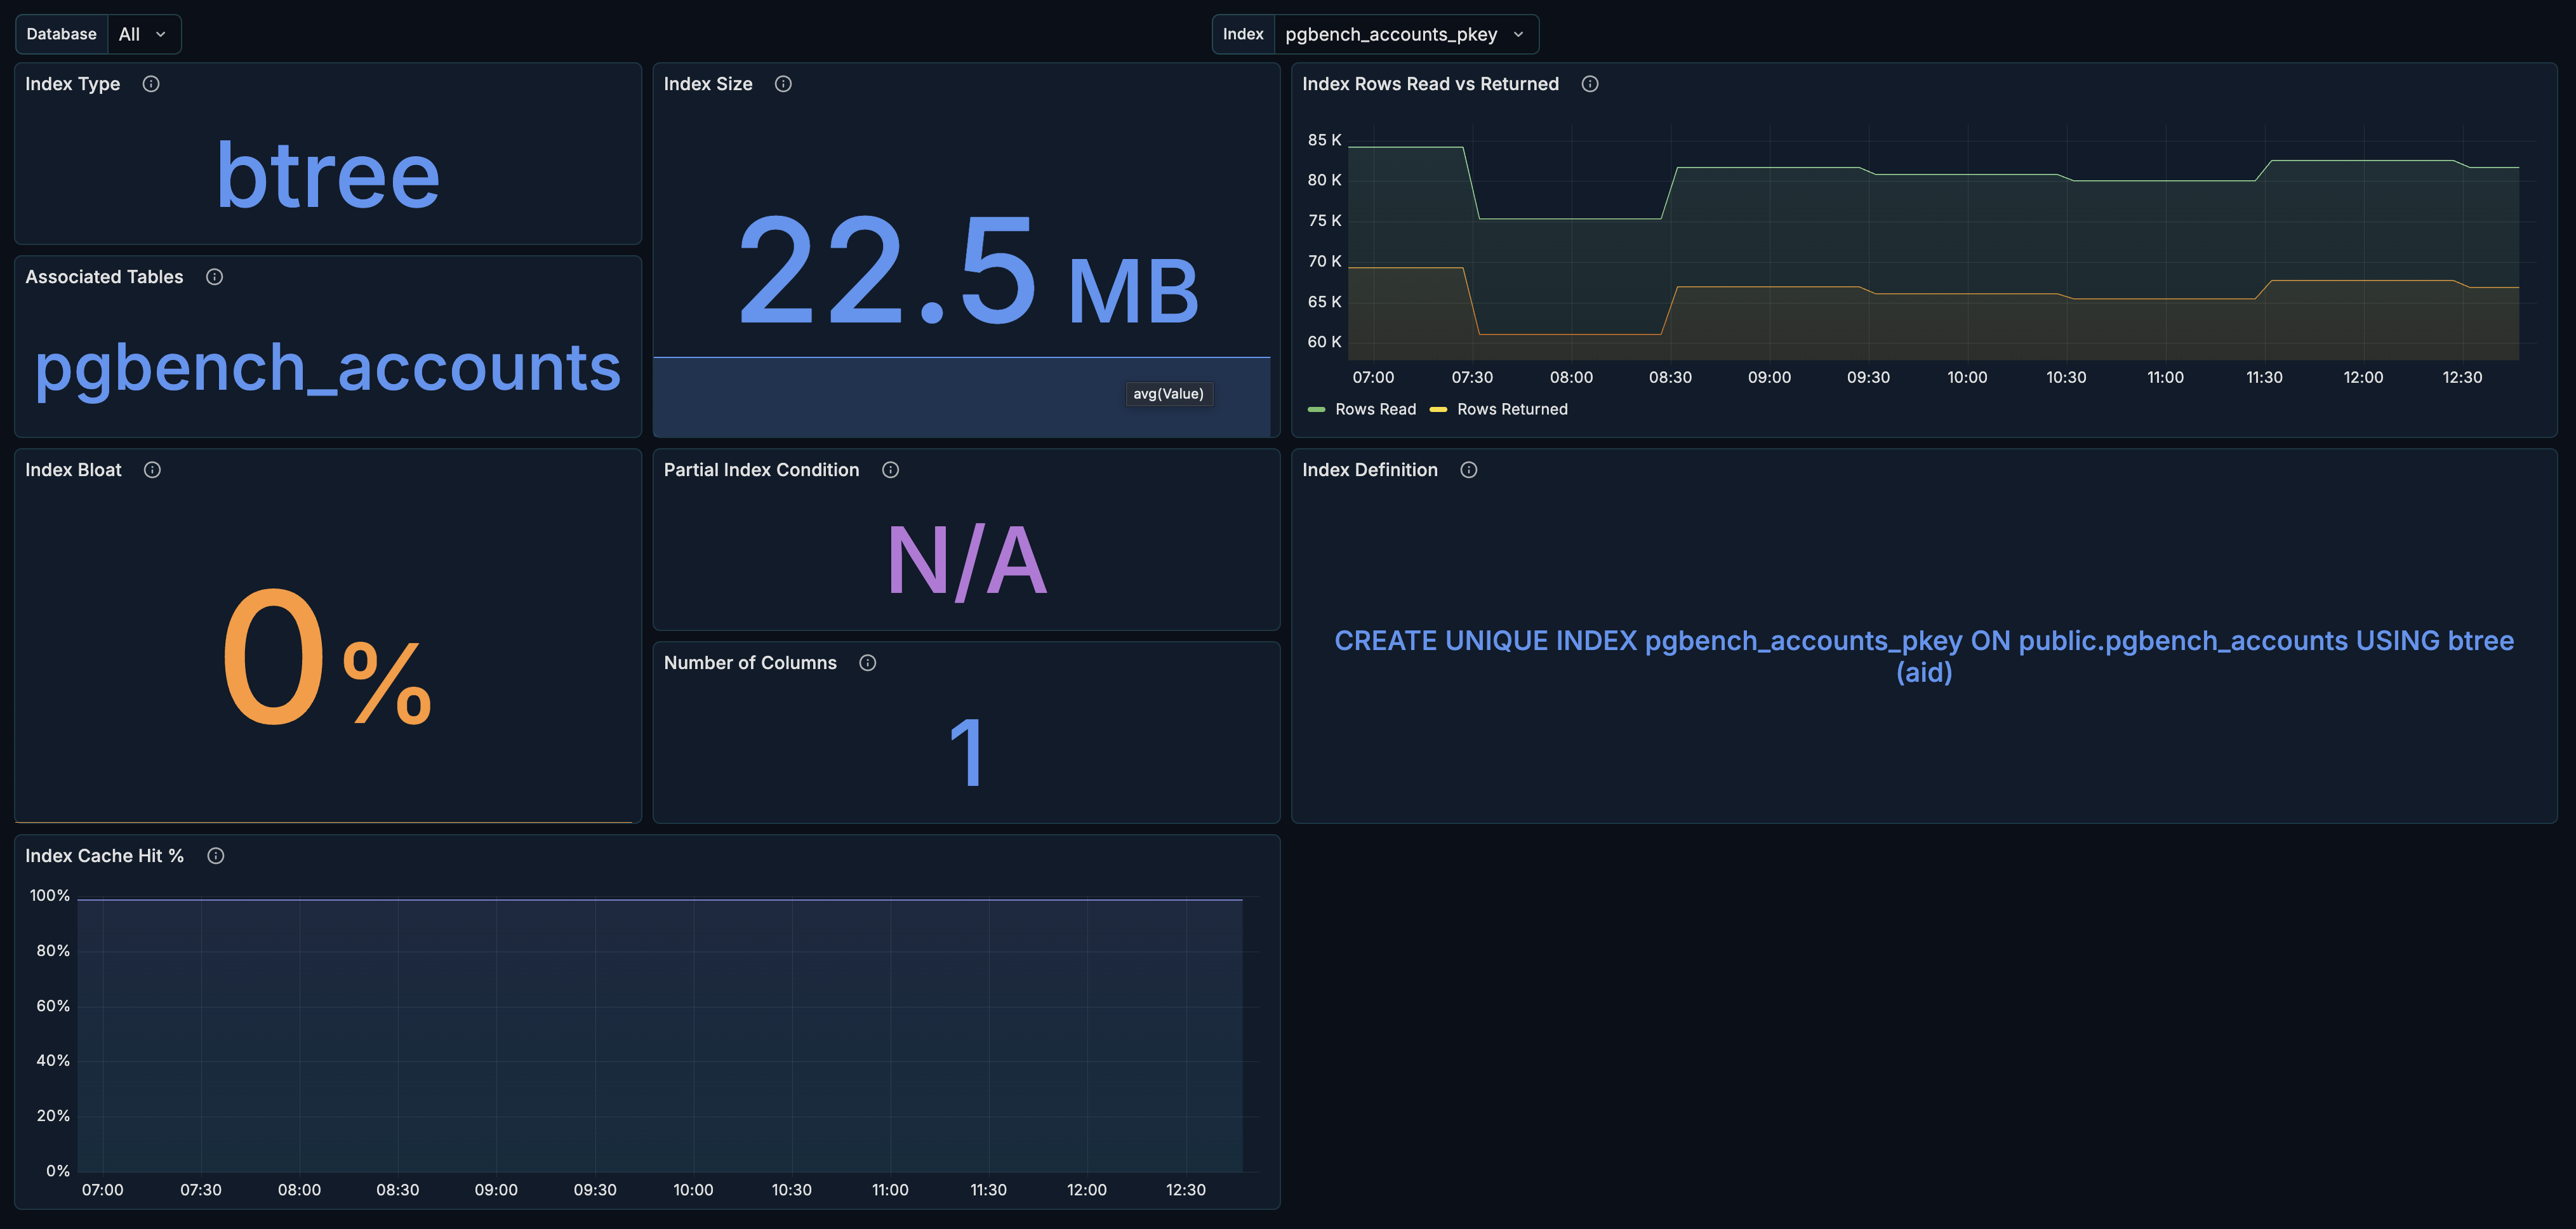
Index Explorer Section
The Index Explorer allows you to analyze individual indexes. This section is collapsed by default - click to expand.
Filters
| Filter | Description |
|---|---|
| Database | Select the database to explore |
| Index | Select the specific index to analyze |
Index Metadata
Index Type
What it shows: The index access method (btree, hash, gin, gist, etc.).
| Type | Best For |
|---|---|
| btree | General purpose, range queries, sorting |
| hash | Equality comparisons only |
| gin | Full-text search, arrays, JSONB |
| gist | Geometric data, full-text search |
| brin | Very large tables with natural ordering |
Table Association
What it shows: The table this index belongs to.
Index Size
What it shows: Current index size.
How to use it:
- Monitor index growth
- Identify oversized indexes
- Plan storage capacity
Index Performance
Rows Read vs Returned
What it shows: Index efficiency over time.
How to interpret:
- Rows read ≈ rows returned = efficient index
- High read/low return = index scanning too much data
- Consider more selective indexes
Index Bloat Percentage
What it shows: Estimated wasted space in the index.
Healthy range: < 30% for most indexes.
When to investigate:
- Bloat > 30% - consider REINDEX
- Bloat > 50% - definite reindex needed
- Rapidly increasing bloat
Index Cache Hit Percentage
What it shows: Cache hit ratio for this specific index.
Healthy range: > 99% for frequently used indexes.
Index Definition
Partial Index Condition
What it shows: The WHERE clause for partial indexes.
Why it matters:
- Partial indexes are smaller and more efficient
- Verify the condition matches your query patterns
Number of Columns
What it shows: How many columns the index covers.
Why it matters:
- Single-column vs multi-column index strategy
- Covering indexes reduce table lookups
Index Definition
What it shows: The full CREATE INDEX statement.
How to use it:
- Understand index structure
- Copy for documentation or recreation
- Verify index configuration
Use Cases
Finding Bloated Tables
- Open the Tables & Indexes section
- Expand Table Explorer
- Check Bloat Percentage for each table
- Tables > 20% bloat need attention
- Schedule VACUUM or VACUUM FULL as needed
Identifying Missing Indexes
- Open Table Explorer for a table
- Check Table Scan Activity
- High sequential scans on large tables = missing index
- Review query patterns for that table
- Create appropriate indexes
Index Health Check
- Open Index Explorer
- Review each index:
- Is it being used? (Rows Read > 0)
- Is it bloated? (< 30% bloat)
- Is it cached? (> 99% cache hit)
- Consider dropping unused indexes
- Rebuild bloated indexes
Vacuum Scheduling
- Check Vacuum Stats across tables
- Identify tables with stale vacuums
- Review Row Activity for high-churn tables
- Adjust autovacuum settings or schedule manual vacuums
Related Metrics
The Tables & Indexes section uses these metrics from the Metrics Reference:
| Panel | Primary Metrics |
|---|---|
| Schema Size | pg_table_stats.size_bytes |
| Table/Index Count | pg_table_info, pg_index_info |
| Cache Hit Ratios | pg_table_stats.heap_blks_hit, pg_table_stats.heap_blks_read |
| Bloat | pg_table_stats.bloat_bytes, pg_index_stats.bloat_bytes |
| Row Counts | pg_table_stats.n_live_tup, pg_table_stats.n_dead_tup |
| Scan Activity | pg_table_stats.seq_scan, pg_table_stats.idx_scan |
| Vacuum Stats | pg_table_stats.last_vacuum, pg_table_stats.last_autovacuum |
| Row Activity | pg_table_stats.n_tup_ins, pg_table_stats.n_tup_upd, pg_table_stats.n_tup_del |
| HOT Updates | pg_table_stats.n_tup_hot_upd |
| Index Stats | pg_index_stats.*, pg_index_info, pg_index_extended_info |
Related Guides
- Maintenance - Vacuum and maintenance tracking
- Performance - Query performance analysis
- Queries - Identify queries needing indexes