Overview
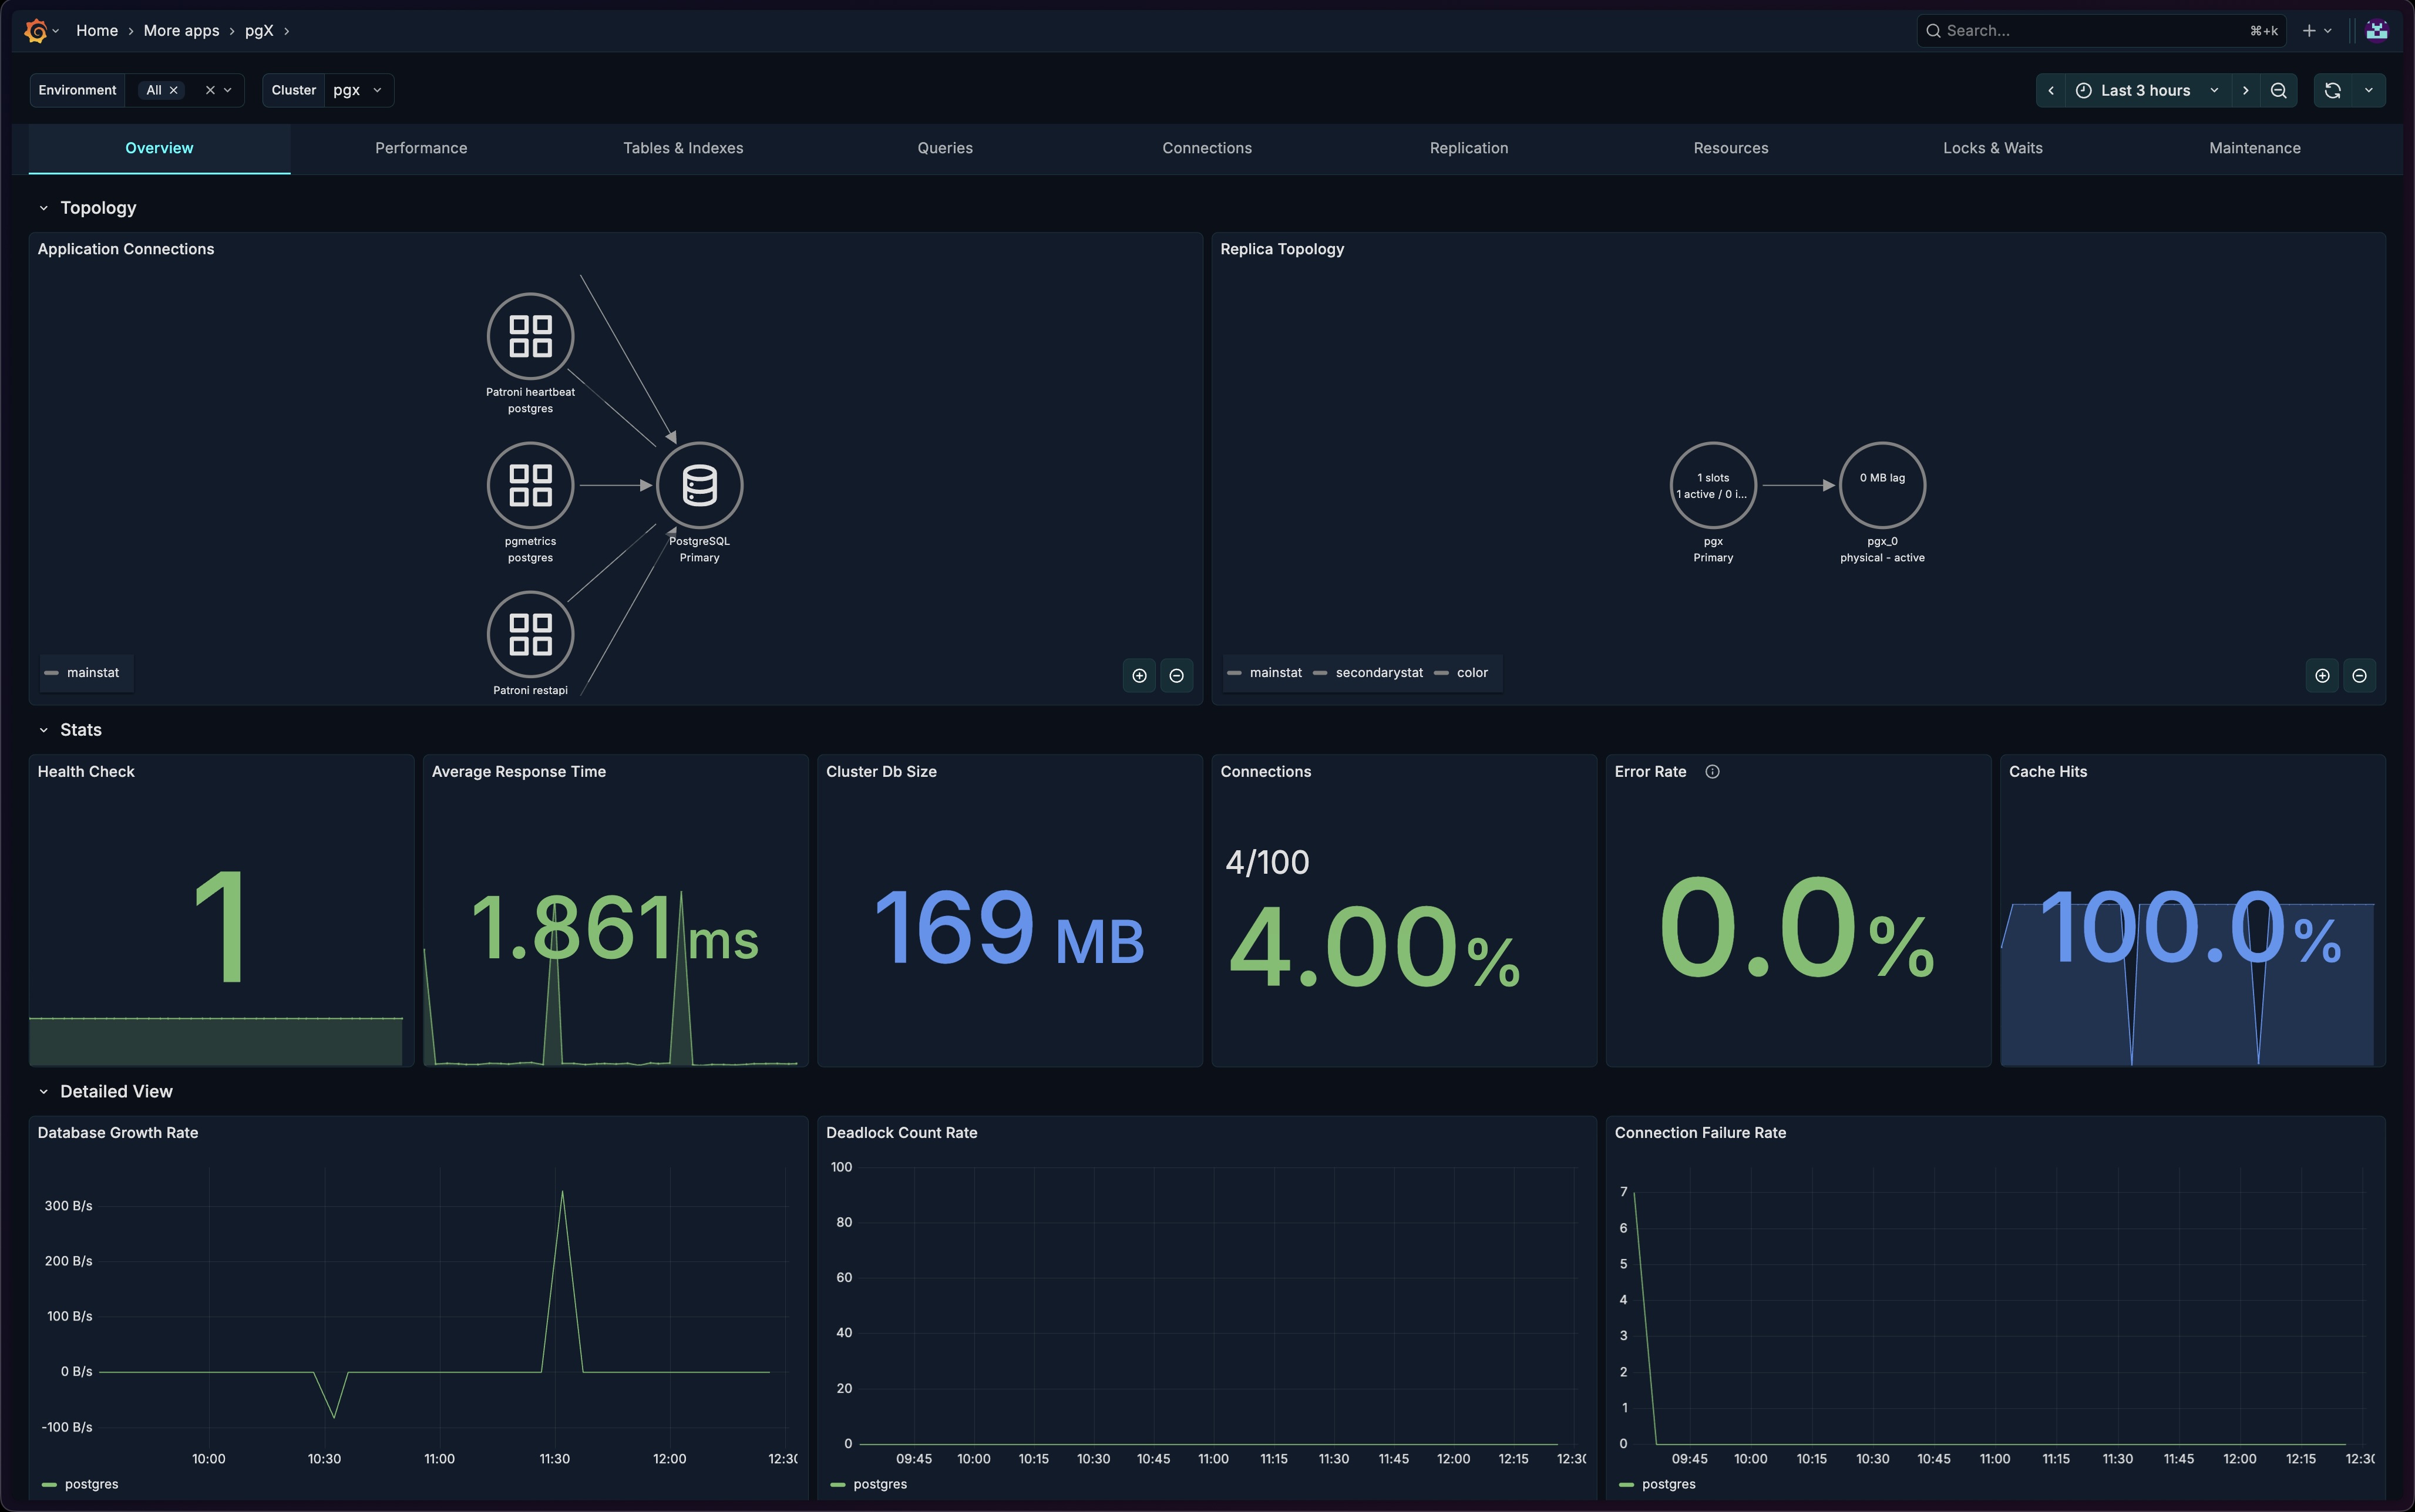
The Overview tab provides a high-level view of your PostgreSQL cluster's health and performance. It's designed to give you immediate visibility into the most critical metrics at a glance.
Sections
The Overview tab is organized into three main sections:
- Topology - Visual representation of connections and replication
- Stats - Key health metrics as stat panels
- Detailed View - Time-series charts for trend analysis
Topology Section
The Topology section provides visual graphs showing how your applications and replicas are connected.
Application Connections
A node graph visualization showing which applications are connected to your PostgreSQL cluster.

What it shows:
- Connected applications by name
- Connection distribution across the cluster
- Active connection paths
How to use it:
- Identify which applications are consuming connections
- Spot unexpected connection sources
- Verify application connectivity after deployments
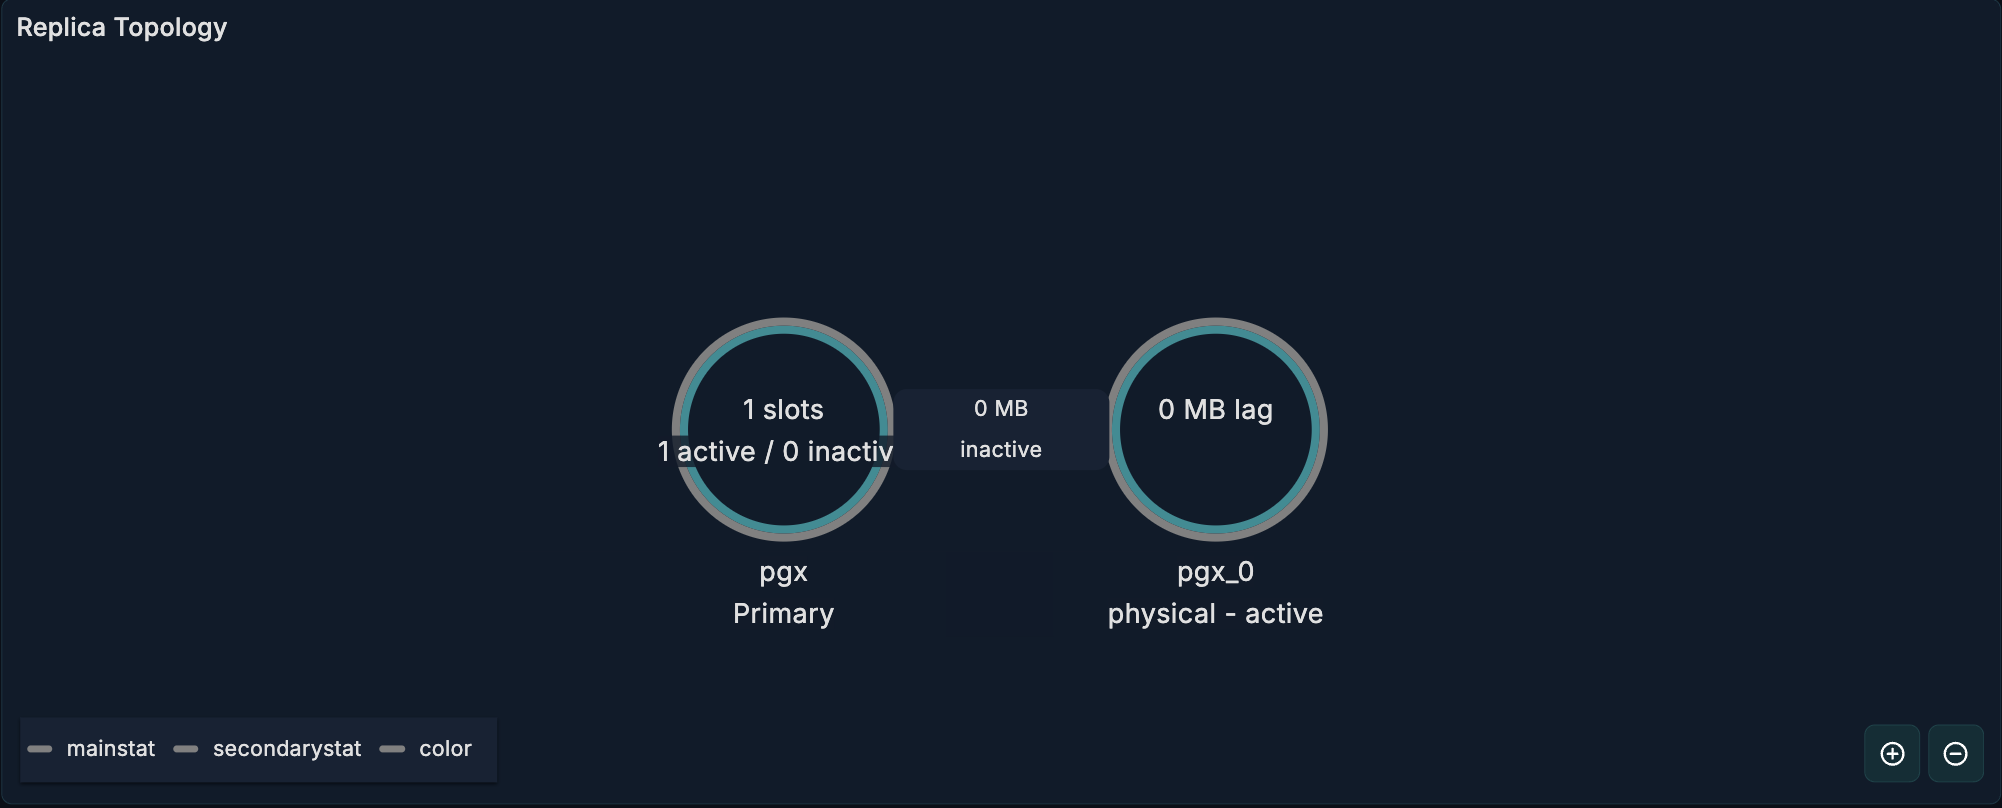
Replica Topology
A node graph showing the replication structure of your cluster.
What it shows:
- Primary and standby nodes
- Replication relationships
- Synchronous vs asynchronous replicas
How to use it:
- Verify replication topology is as expected
- Identify replication chain structure
- Spot disconnected standbys quickly
Stats Section
Six stat panels displaying the most critical health indicators.
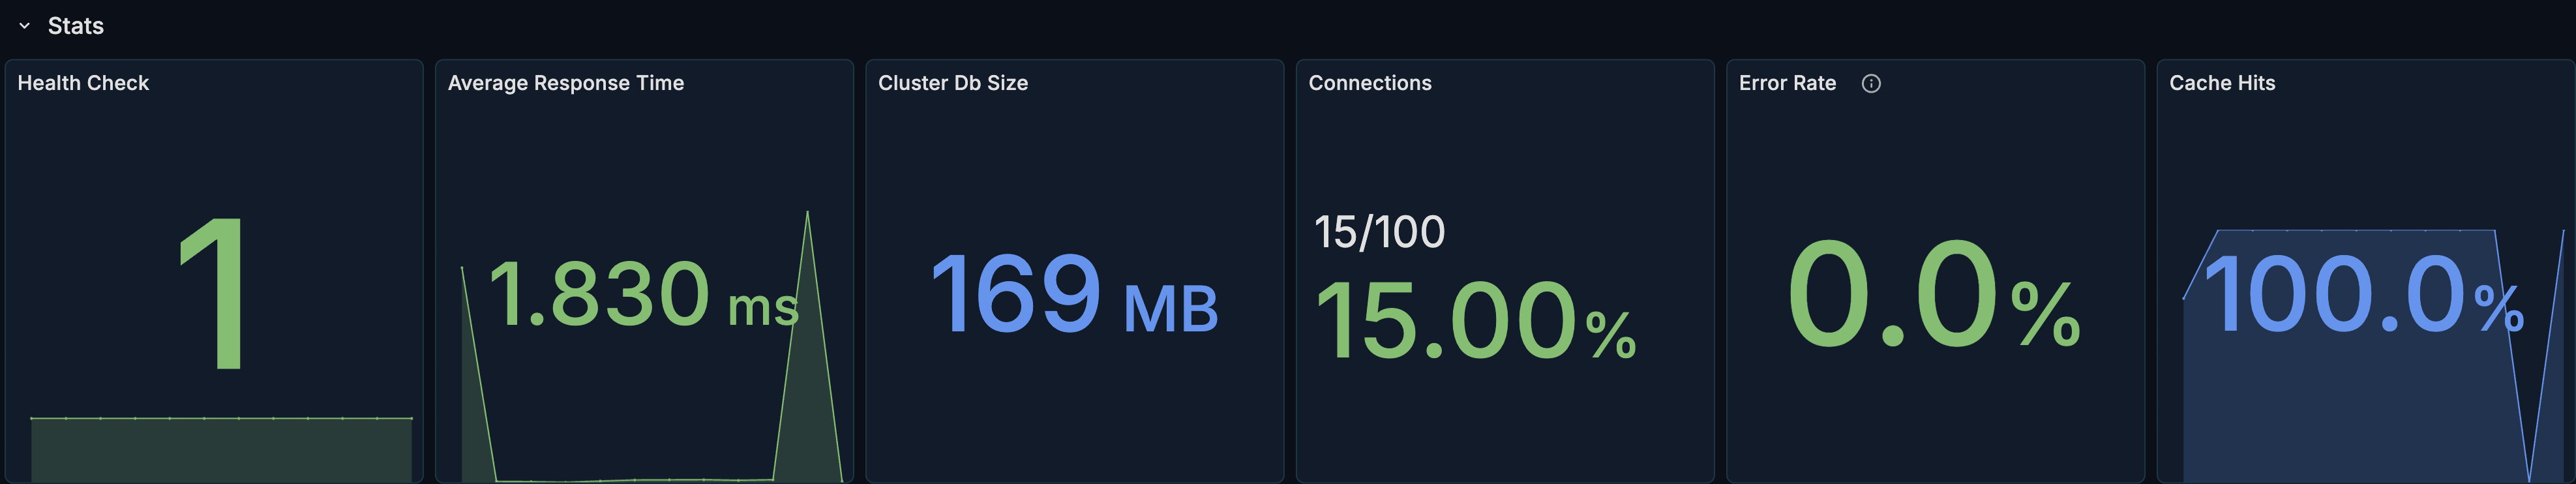
Health Check
What it shows: Whether PostgreSQL is up and responding.
| Value | Meaning |
|---|---|
| UP | PostgreSQL is responding to connections |
| DOWN | PostgreSQL is not reachable |
When to investigate: Immediately if showing DOWN.
Average Response Time
What it shows: The average query response time across the cluster.
Healthy range: Depends on your workload, but typically < 100ms for OLTP.
When to investigate:
- Sudden increases in response time
- Response times exceeding your SLA thresholds
Cluster Database Size
What it shows: The total size of all databases in the cluster.
How to use it:
- Monitor storage growth
- Plan capacity upgrades
- Detect unexpected growth
Current Connections
What it shows: The number of active connections to PostgreSQL.
When to investigate:
- Approaching
max_connectionslimit - Sudden spikes in connection count
- Unusually low connections (may indicate application issues)
Transaction Error Rate
What it shows: The percentage of transactions that resulted in errors (rollbacks).
Healthy range: Typically < 1% for most workloads.
When to investigate:
- Error rate exceeding normal baseline
- Sudden spikes in errors
- Sustained elevated error rates
Cache Hit Ratio
What it shows: The percentage of data reads served from the buffer cache vs disk.
Healthy range: > 99% for most OLTP workloads.
When to investigate:
- Cache hit ratio below 95%
- Declining trend over time
- After significant schema or query changes
Detailed View Section
The Detailed View section provides time-series panels for trend analysis. This section is collapsed by default - click to expand.
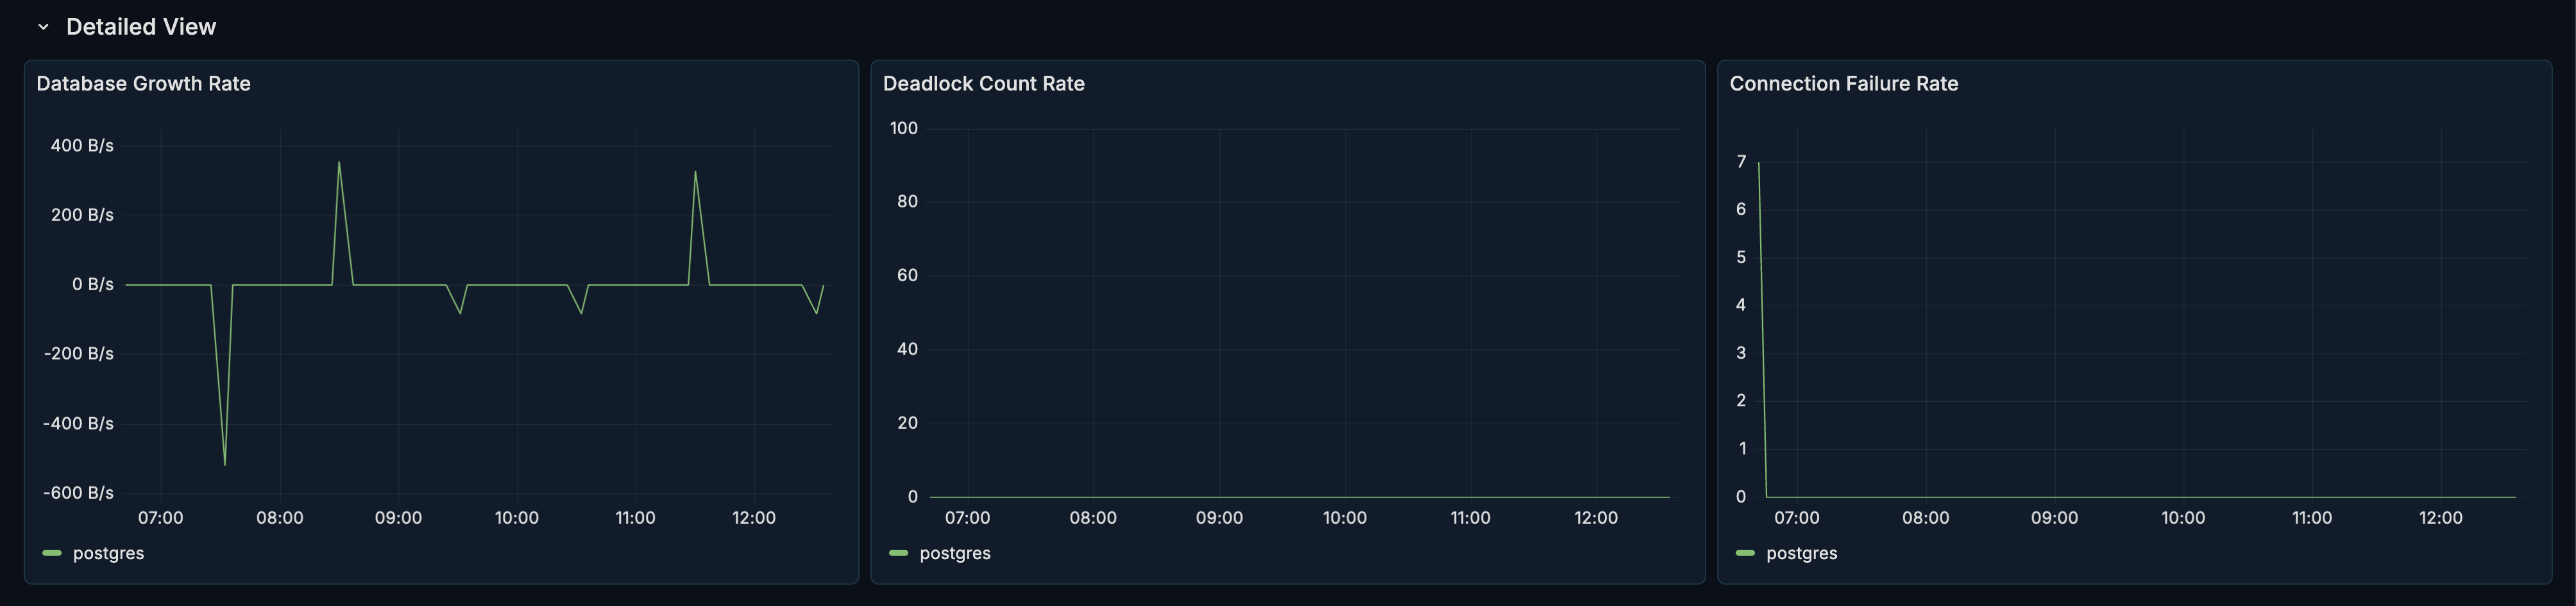
Database Growth Rate
What it shows: The rate at which your database size is growing over time.
How to use it:
- Forecast storage needs
- Identify periods of high data ingestion
- Detect data growth anomalies
Deadlock Count
What it shows: The number of deadlocks occurring over time.
Healthy range: Zero or near-zero for most workloads.
When to investigate:
- Any deadlocks occurring
- Increasing trend in deadlock frequency
- Deadlocks correlating with specific time periods
Connection Failure Rate
What it shows: The rate of failed connection attempts.
Healthy range: Zero for healthy systems.
When to investigate:
- Any connection failures
- Correlation with application errors
- Spikes during high-traffic periods
Use Cases
Morning Health Check
Start your day by reviewing the Overview dashboard:
- Verify Health Check shows UP
- Check Cache Hit Ratio is in healthy range (> 99%)
- Confirm Transaction Error Rate is normal
- Review Current Connections for expected levels
Post-Deployment Monitoring
After deploying application changes:
- Watch Average Response Time for degradation
- Monitor Transaction Error Rate for increased errors
- Check Application Connections topology for expected patterns
- Review Connection Count for proper scaling
Capacity Planning
Use the Overview dashboard for capacity planning:
- Track Cluster Database Size growth
- Monitor Database Growth Rate trends
- Watch Current Connections vs
max_connections - Review patterns over time in the Detailed View
Related Metrics
The Overview section uses these metrics from the Metrics Reference:
| Panel | Primary Metrics |
|---|---|
| Health Check | pg_up |
| Response Time | pg_statement_stats |
| Database Size | pg_database_size_bytes |
| Connections | pg_connections, pg_database_stats.num_backends |
| Error Rate | pg_database_stats.xact_rollback, pg_database_stats.xact_commit |
| Cache Hit Ratio | pg_database_stats.blks_hit, pg_database_stats.blks_read |
| Growth Rate | pg_database_size_bytes |
| Deadlocks | pg_database_stats.deadlocks |
Related Guides
- Performance - Dive deeper into query performance
- Connections - Detailed connection analysis
- Replication - Full replication monitoring