Replication
The Replication tab provides comprehensive monitoring of PostgreSQL streaming replication. Use it to track replication lag, monitor standby health, and troubleshoot replication issues.
Note: This tab is available for self-hosted and AWS RDS deployments.
Sections
The Replication tab is organized into four sections:
- Overview - Topology and health at a glance
- Primary Metrics - WAL and slot monitoring
- Replica Metrics - Standby-specific metrics
- Replication Debugging - Detailed troubleshooting data
Overview Section
The Overview section provides immediate visibility into replication health.
Replica Topology
A node graph visualization showing your replication topology.
What it shows:
- Primary server
- Standby replicas
- Replication relationships
- Synchronous vs asynchronous replicas
How to use it:
- Verify topology matches expected configuration
- Identify disconnected standbys
- Visualize cascading replication chains
Replication Lag
What it shows: Time-series of replication lag for each standby.
Healthy range: Depends on requirements, typically < 1 second for hot standby.
Types of lag:
- Write lag - Time for WAL to reach standby
- Flush lag - Time for WAL to be flushed on standby
- Replay lag - Time for WAL to be applied on standby
When to investigate:
- Lag exceeding SLA thresholds
- Increasing lag trend
- Sudden spikes in lag
- Divergence between standbys
Replication Health Board
A table showing health status of all replication connections.
Columns:
| Column | Description |
|---|---|
| Standby | Standby identifier |
| State | Connection state (streaming, catchup, etc.) |
| Sync State | async, sync, or quorum |
| Sent LSN | WAL position sent |
| Write LSN | WAL position written on standby |
| Flush LSN | WAL position flushed on standby |
| Replay LSN | WAL position replayed on standby |
Healthy indicators:
- State = "streaming"
- LSN positions close together
- Recent reply times
Primary Metrics Section
The Primary Metrics section focuses on the primary server's replication workload. This section is collapsed by default - click to expand.
Replication Slot Status
What it shows: Status of all replication slots.
| Column | Description |
|---|---|
| Slot Name | Name of the replication slot |
| Slot Type | physical or logical |
| Active | Whether slot is in use |
| WAL Status | reserved, extended, unreserved, lost |
| Restart LSN | LSN to restart from |
| Lag | How far behind the slot is |
When to investigate:
- Inactive slots - may be holding WAL unnecessarily
- "lost" WAL status - slot fell behind, needs recreation
- Large lag - consumer is falling behind
Warning: Inactive slots can cause WAL accumulation and disk space issues.
WAL Generation Rate
What it shows: Rate of Write-Ahead Log generation over time.
How to use it:
- Understand write workload
- Correlate with replication lag
- Plan network bandwidth for replication
High WAL generation causes:
- Heavy write workload
- Full page writes after checkpoint
- Large transactions
- Bulk operations
Archive Lag
What it shows: Lag in WAL archiving over time.
Healthy range: Near zero for healthy archiving.
When to investigate:
- Growing archive lag
- Archive failures
- Disk space issues on archive destination
Standby Replica List
What it shows: Count and list of connected standby replicas.
How to use it:
- Verify expected standby count
- Quick health check
Replica Metrics Section
The Replica Metrics section shows standby-specific data. This section is collapsed by default - click to expand.
Recovery Progress
What it shows: Recovery state on standby replicas.
| Metric | Description |
|---|---|
| Last WAL Receive LSN | Latest WAL position received |
| Last WAL Replay LSN | Latest WAL position applied |
| Last Transaction Replay | Timestamp of last replayed transaction |
When to investigate:
- Large gap between receive and replay LSN
- Old last transaction replay timestamp
- Paused recovery
Conflicts Over Time
What it shows: Replication conflicts on standby replicas.
Conflict types:
- tablespace - Tablespace being dropped
- lock - Lock conflicts with recovery
- snapshot - Snapshot too old
- bufferpin - Buffer pinned during recovery
- deadlock - Deadlock between recovery and queries
Healthy range: Zero conflicts ideally.
When to investigate:
- Any conflicts occurring
- Increasing conflict rate
- Specific conflict types recurring
Mitigation:
- Increase
max_standby_streaming_delay - Adjust
hot_standby_feedback - Review query patterns on standby
Replication Debugging Section
The Debugging section provides detailed data for troubleshooting. This section is collapsed by default - click to expand.
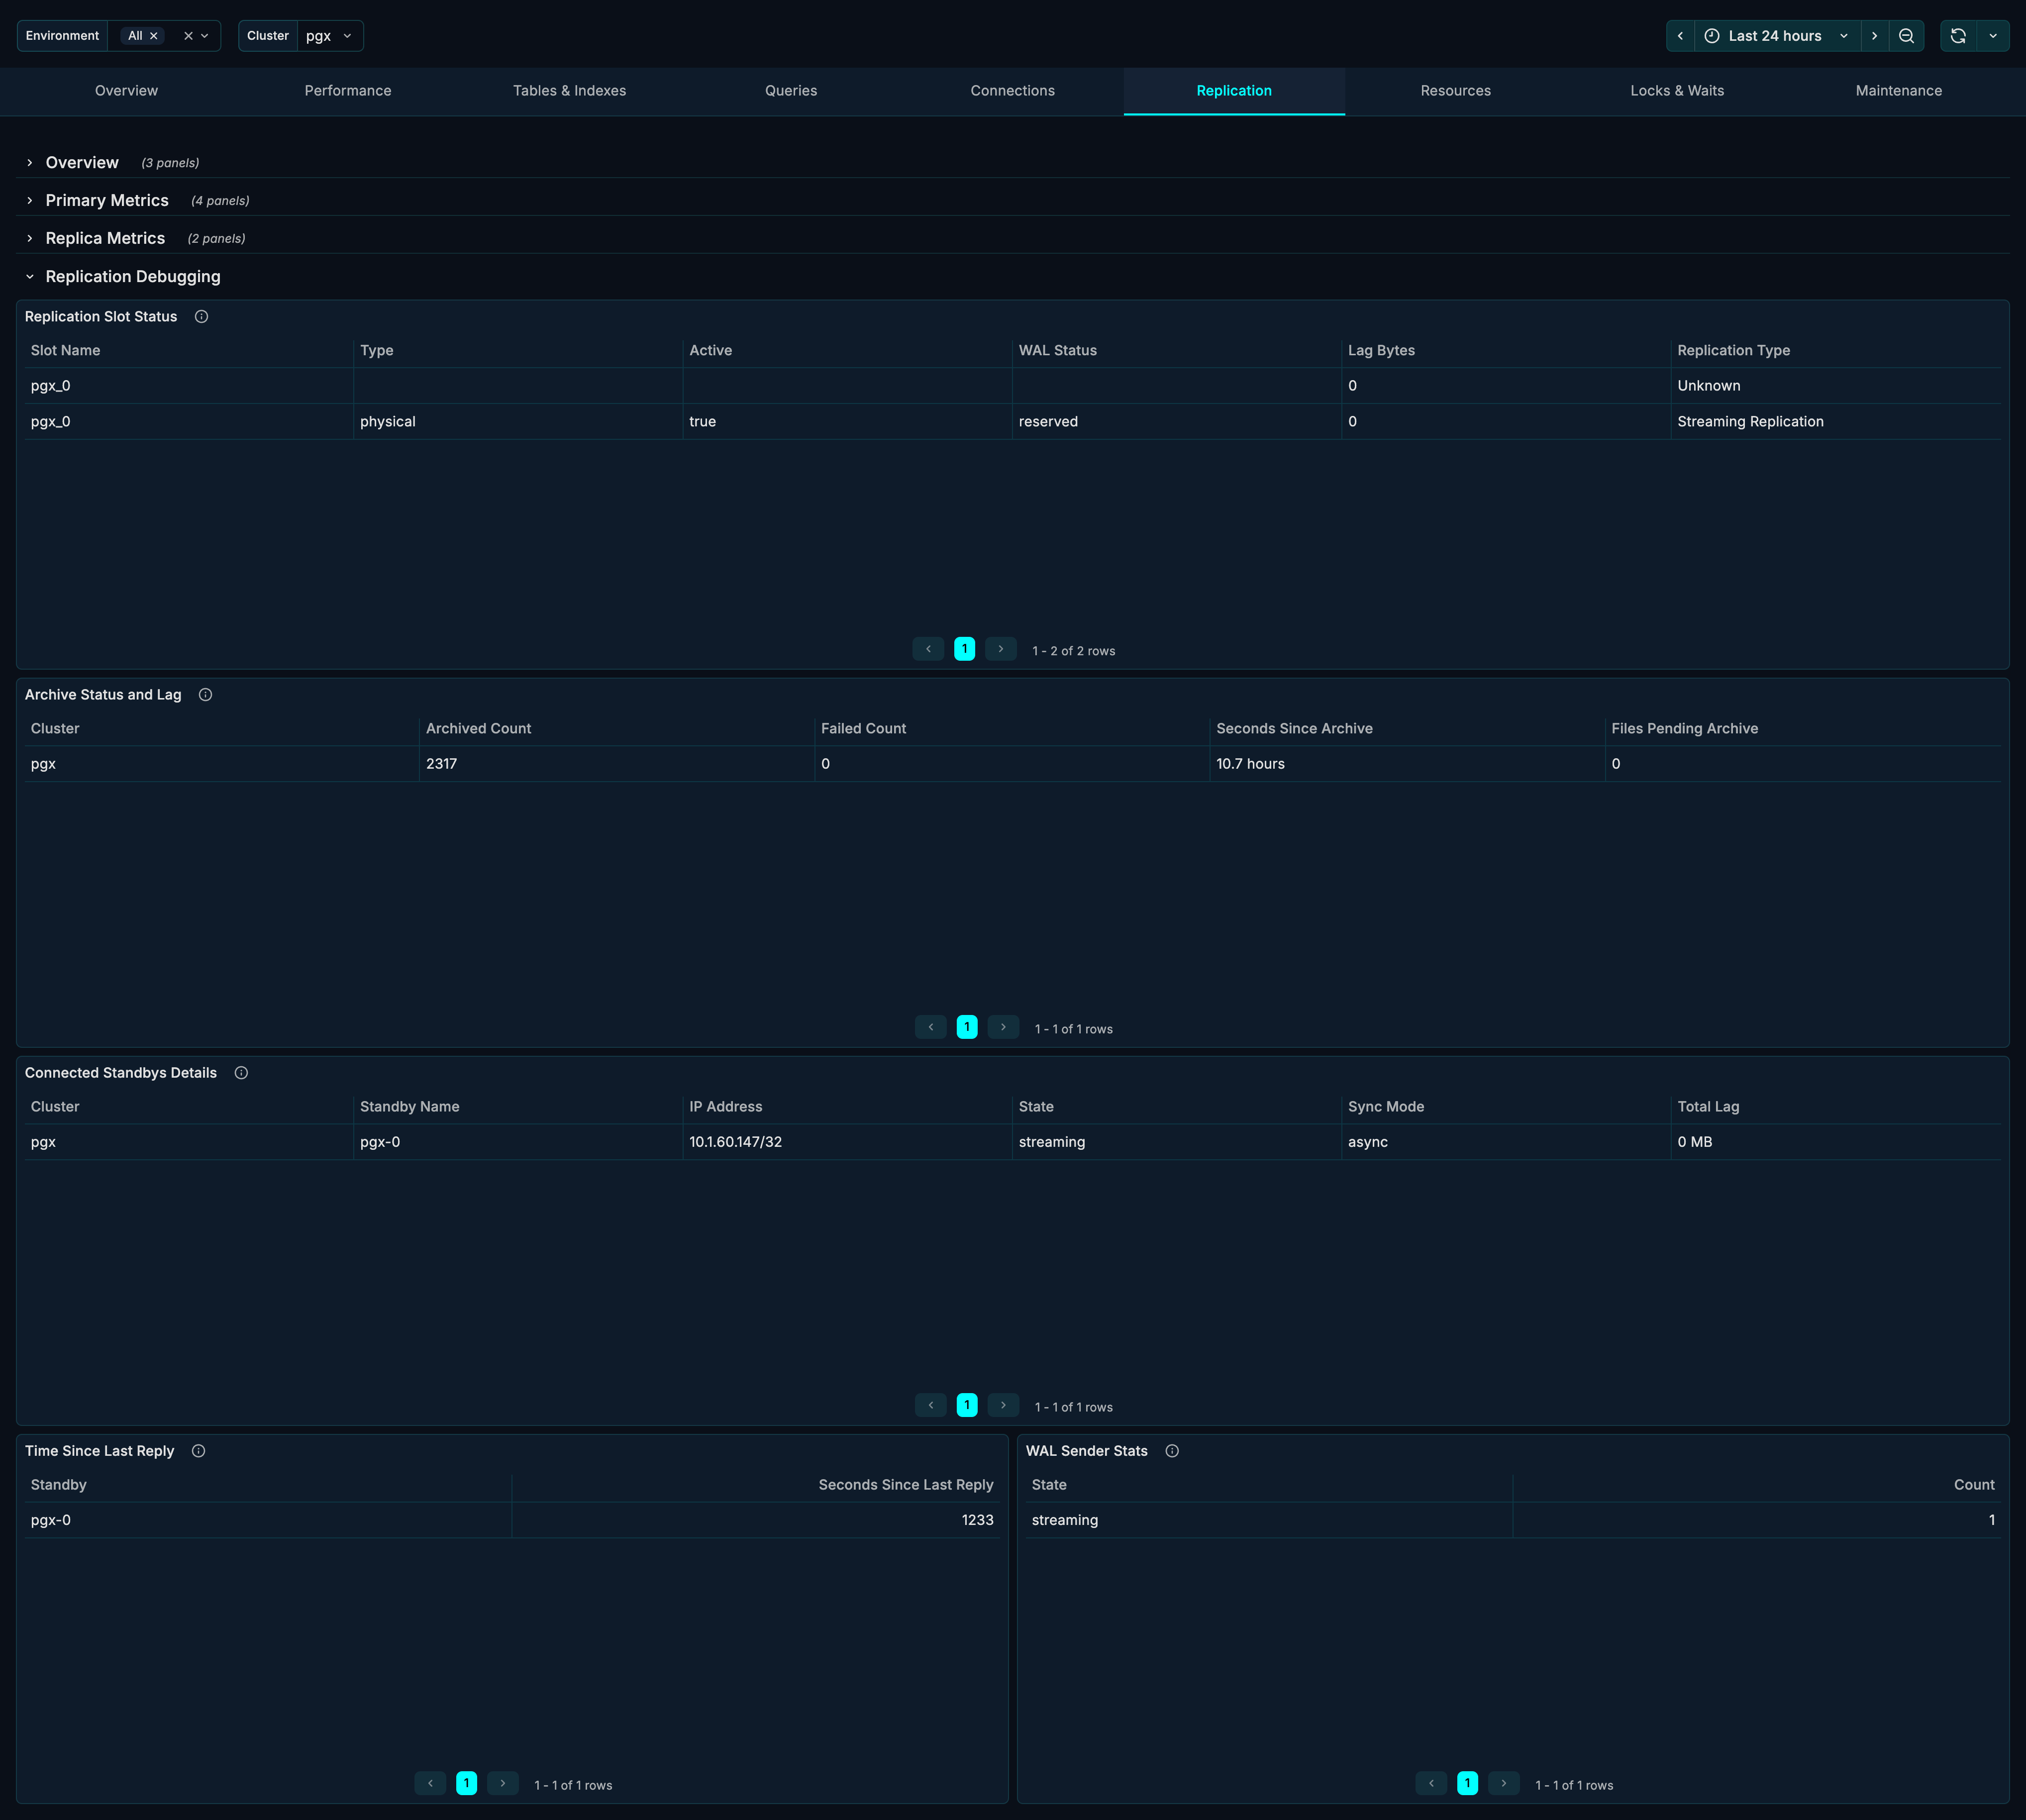
Replication Slot Status (Detailed)
Extended view of replication slots with additional metrics.
Archive Status and Lag
What it shows: Detailed WAL archiving status.
| Metric | Description |
|---|---|
| Archived Count | Number of WAL files archived |
| Failed Count | Number of archive failures |
| Last Archived WAL | Most recently archived file |
| Last Archived Time | When last archive completed |
| Last Failed WAL | Most recent failed archive |
| Last Failed Time | When last failure occurred |
Connected Standbys Details
What it shows: Detailed information about each standby connection.
| Column | Description |
|---|---|
| PID | Backend process ID |
| Client Address | Standby IP address |
| User | Replication user |
| Application Name | Standby identifier |
| State | Connection state |
| Sync State | Synchronization mode |
| Backend Start | When connection started |
Time Since Last Reply
What it shows: How recently each standby has communicated.
Healthy range: Seconds or less.
When to investigate:
- Reply times > 30 seconds
- Growing reply times
- Standbys not responding
WAL Sender Stats
What it shows: Statistics for WAL sender processes.
| Metric | Description |
|---|---|
| Sent LSN | WAL position sent |
| Write LSN | WAL written on standby |
| Flush LSN | WAL flushed on standby |
| Replay LSN | WAL replayed on standby |
Use Cases
Monitoring Replication Health
Daily health check:
- Review Replica Topology for expected structure
- Check Replication Lag is within thresholds
- Verify all standbys showing "streaming" in Health Board
- Confirm Time Since Last Reply is recent
Troubleshooting Replication Lag
When experiencing high replication lag:
- Check WAL Generation Rate - is it unusually high?
- Review Replication Health Board for affected standbys
- Check Conflicts Over Time for recovery conflicts
- Review network bandwidth and latency
- Check standby resources (CPU, I/O)
Common causes:
- Heavy write workload on primary
- Network issues
- Slow standby storage
- Queries blocking recovery (hot standby)
Managing Replication Slots
- Review Replication Slot Status regularly
- Identify inactive slots
- Check slot lag for growing values
- Drop unused slots to prevent WAL accumulation
-- View slot status
SELECT * FROM pg_replication_slots;

-- Drop unused slot
SELECT pg_drop_replication_slot('slot_name');
Investigating Replication Conflicts
When standbys report conflicts:
- Check Conflicts Over Time for patterns
- Identify conflict types
- Review queries running on standby during conflicts
- Adjust configuration:
-- Increase standby delay tolerance
ALTER SYSTEM SET max_standby_streaming_delay = '60s';

-- Enable hot standby feedback
ALTER SYSTEM SET hot_standby_feedback = on;
Failover Readiness Check
Before planned failover:
- Verify Replication Lag is near zero
- Confirm Sync State matches expectations
- Check Time Since Last Reply is recent
- Review Recovery Progress on target standby
Related Metrics
The Replication section uses these metrics from the Metrics Reference:
| Panel | Primary Metrics |
|---|---|
| Replica Topology | pg_replication_outgoing, pg_replication_incoming |
| Replication Lag | pg_replication_lag_milliseconds |
| Health Board | pg_replication_outgoing |
| Slot Status | pg_replication_slot_info, pg_replication_slot_lag_bytes |
| WAL Generation | pg_wal.bytes |
| Archive Lag | pg_wal_archiving |
| Standby List | pg_replication_outgoing_info |
| Recovery Progress | pg_recovery_detail |
| Conflicts | pg_database_stats.conflicts |
| Archive Status | pg_wal_archiving |
| WAL Sender Stats | pg_replication_outgoing |
Related Guides
- Overview - Cluster health overview
- Performance - Query performance analysis
- Resources - Server resource monitoring