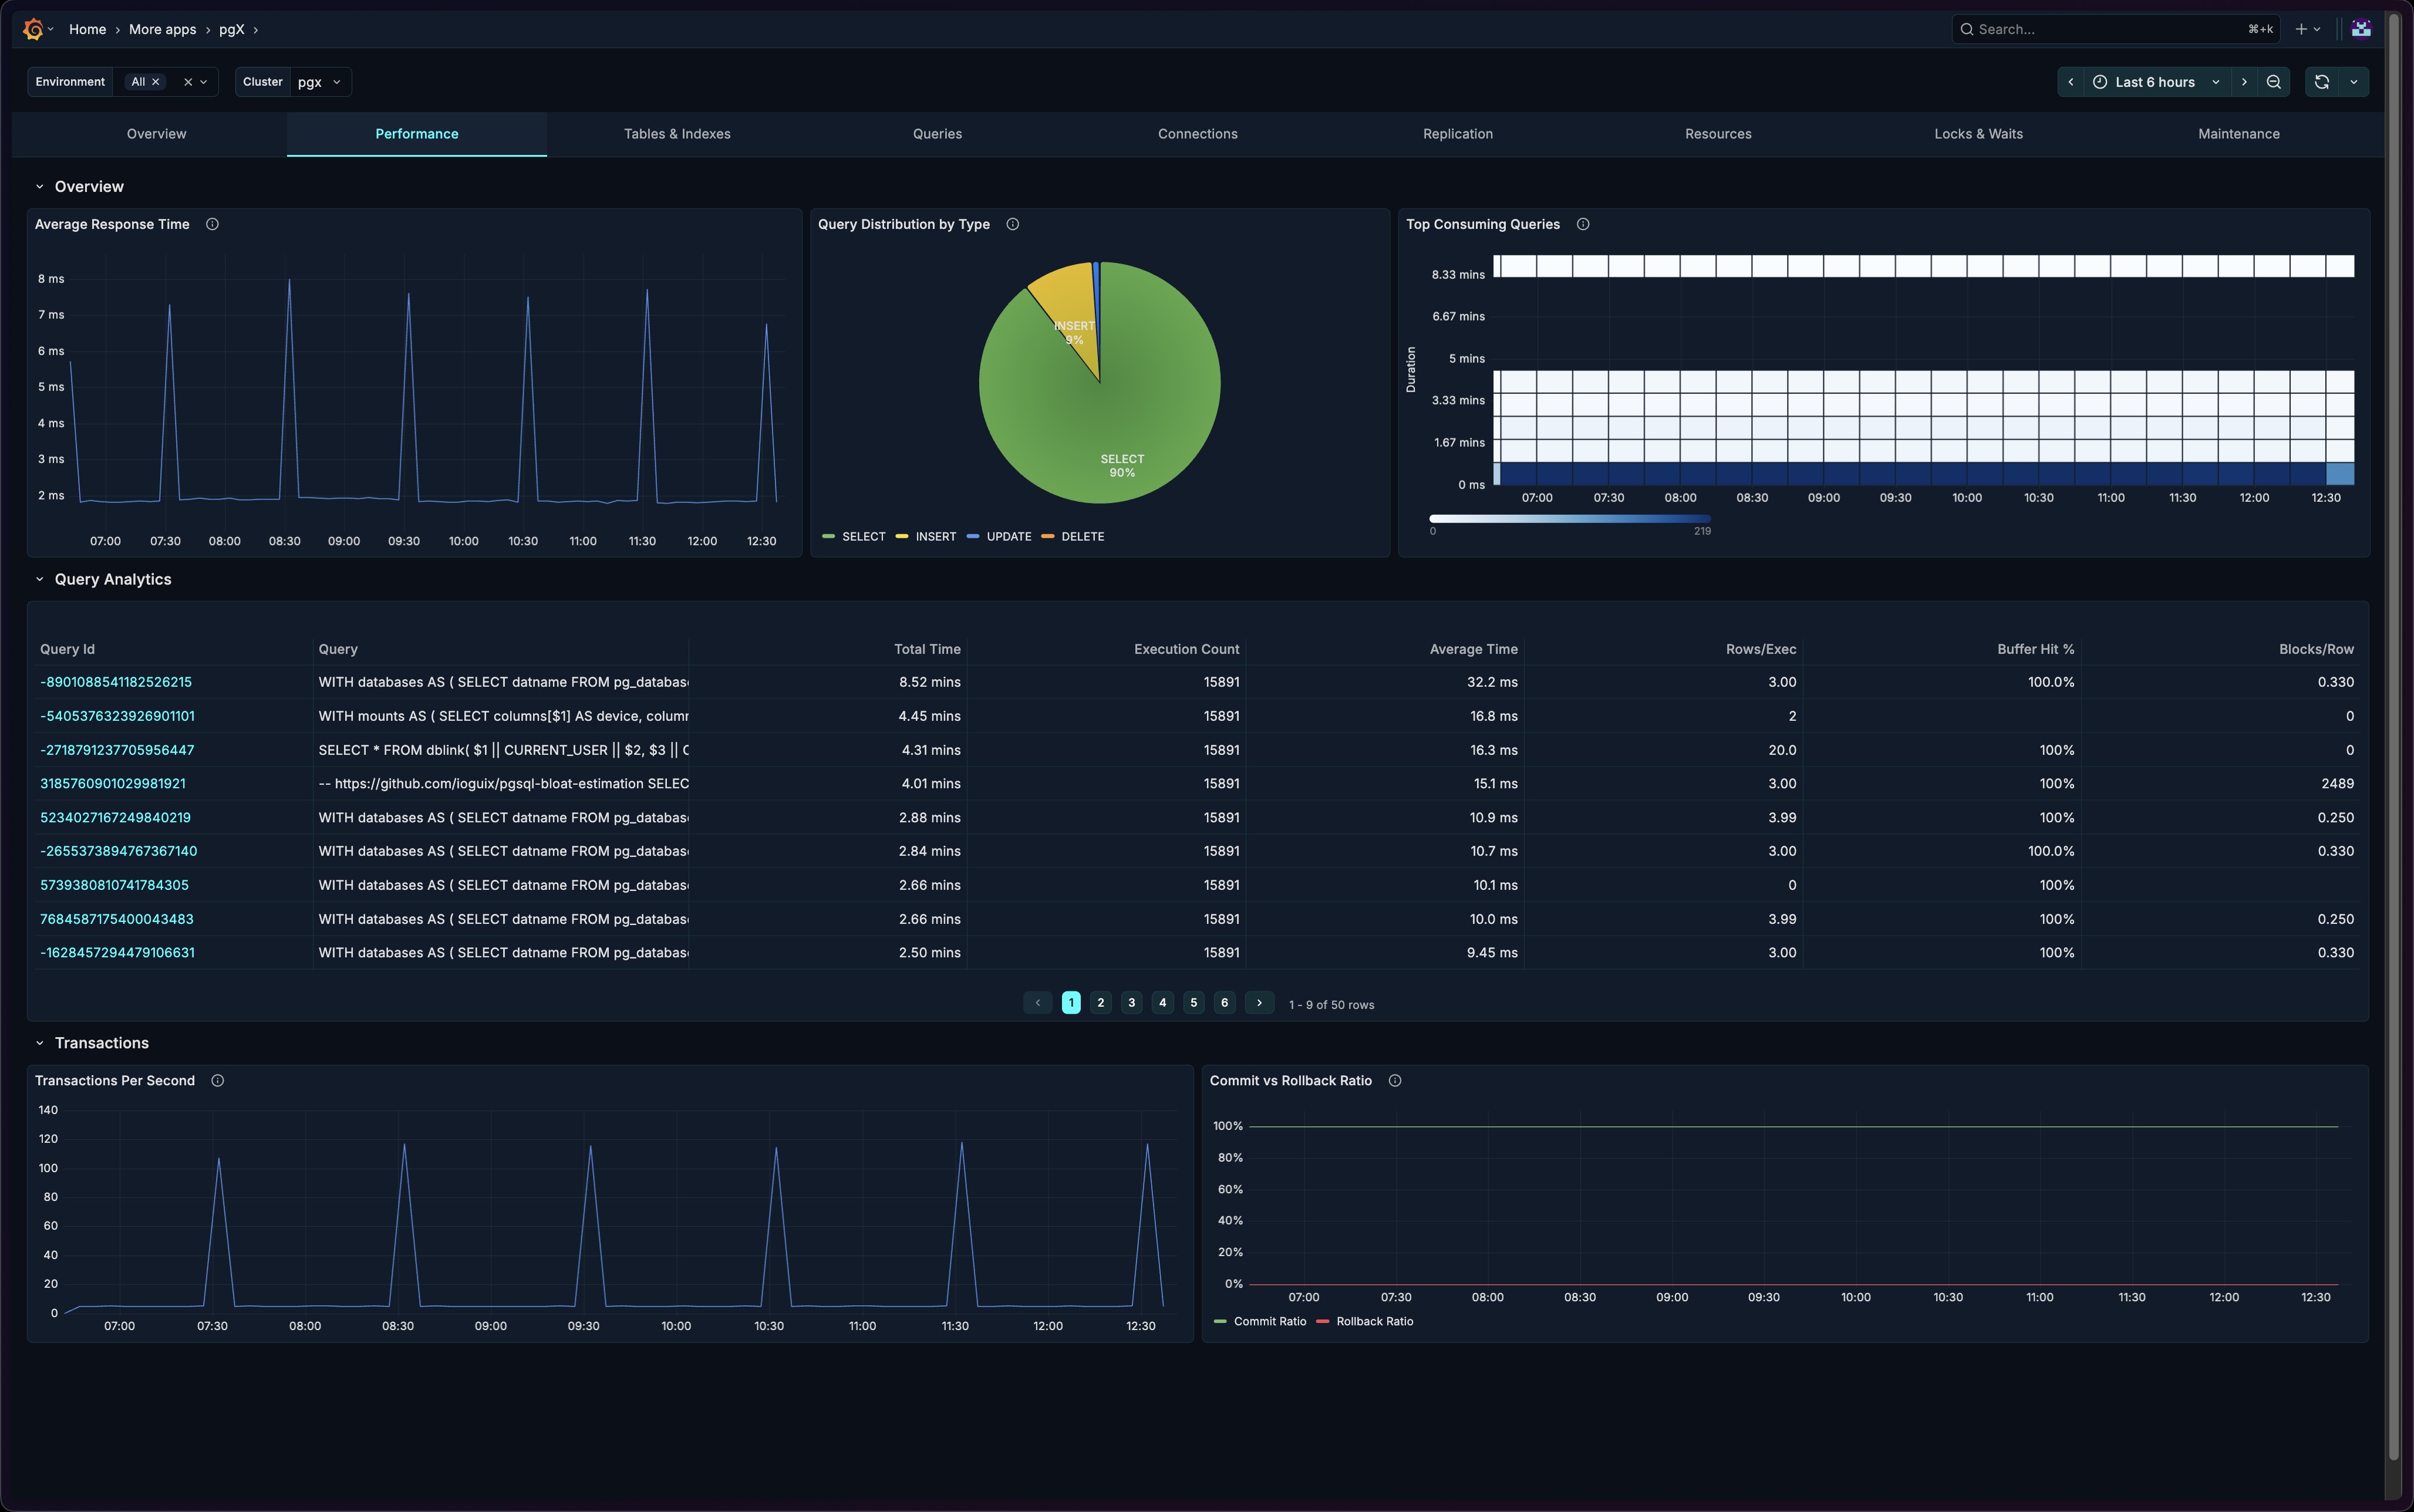
Performance
The Performance tab provides detailed insights into query and transaction performance. Use it to identify slow queries, analyze execution patterns, and optimize your database workload.
Sections
The Performance tab is organized into three sections:
- Overview - Key performance visualizations
- Query Analytics - Detailed query analysis table
- Transactions - Transaction throughput and health
Overview Section
The Overview section provides immediate visibility into query performance and distribution.
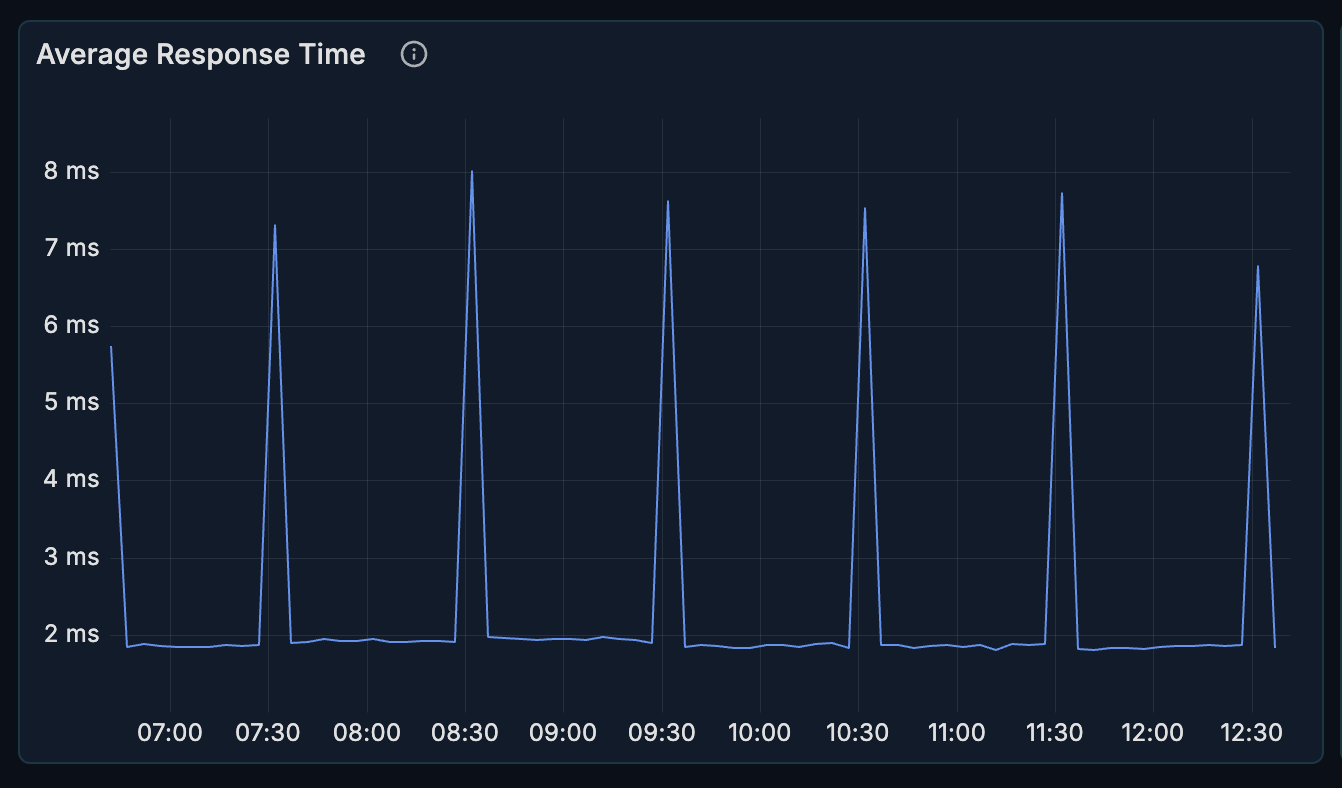
Average Response Time
A time-series chart showing query response times over the selected period.
What it shows:
- Average query execution time
- Trends over time
- Response time variations
How to interpret:
- Flat line at low values = healthy, consistent performance
- Spikes = potential issues (locks, resource contention, complex queries)
- Gradual increase = possible index degradation or data growth issues
When to investigate:
- Response times exceeding baseline by > 20%
- Sudden spikes correlating with errors
- Sustained elevated response times
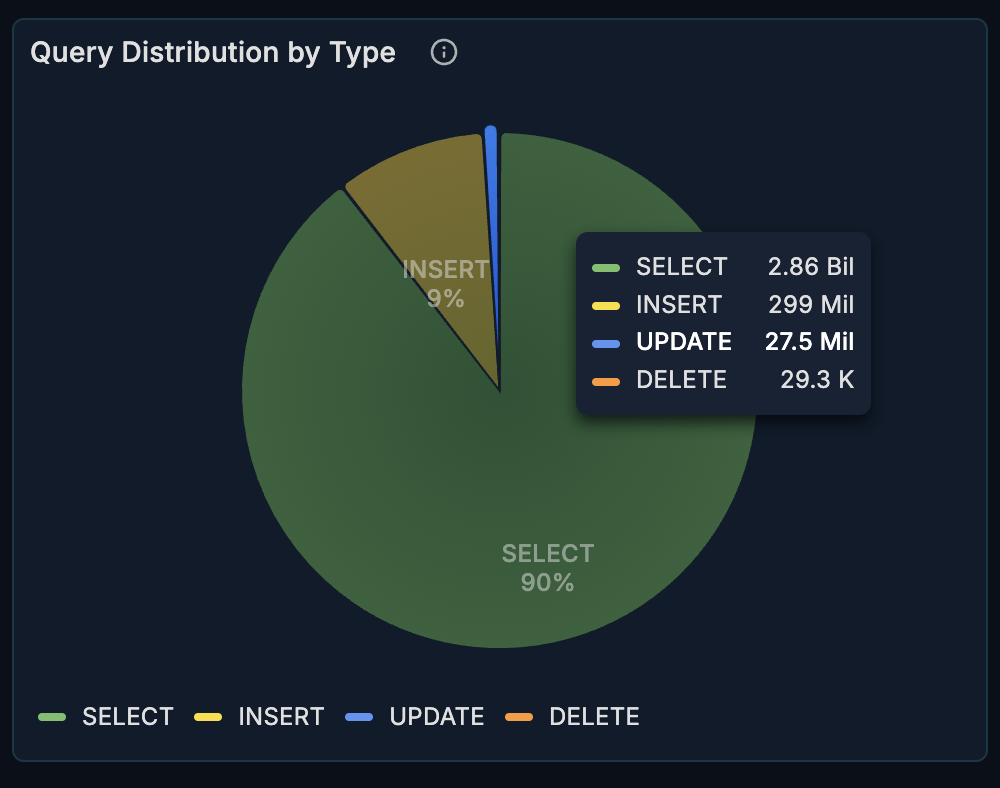
Query Distribution
A pie chart showing the breakdown of query types.
What it shows:
- Proportion of SELECT, INSERT, UPDATE, DELETE operations
- Overall query mix
How to interpret:
- Most OLTP systems are read-heavy (SELECT > 70%)
- Write-heavy patterns may indicate bulk operations or data ingestion
- Unexpected changes may indicate application behavior changes
When to investigate:
- Sudden shift in query type distribution
- Unexpected write-heavy patterns
- High proportion of DELETE operations (may indicate cleanup jobs)
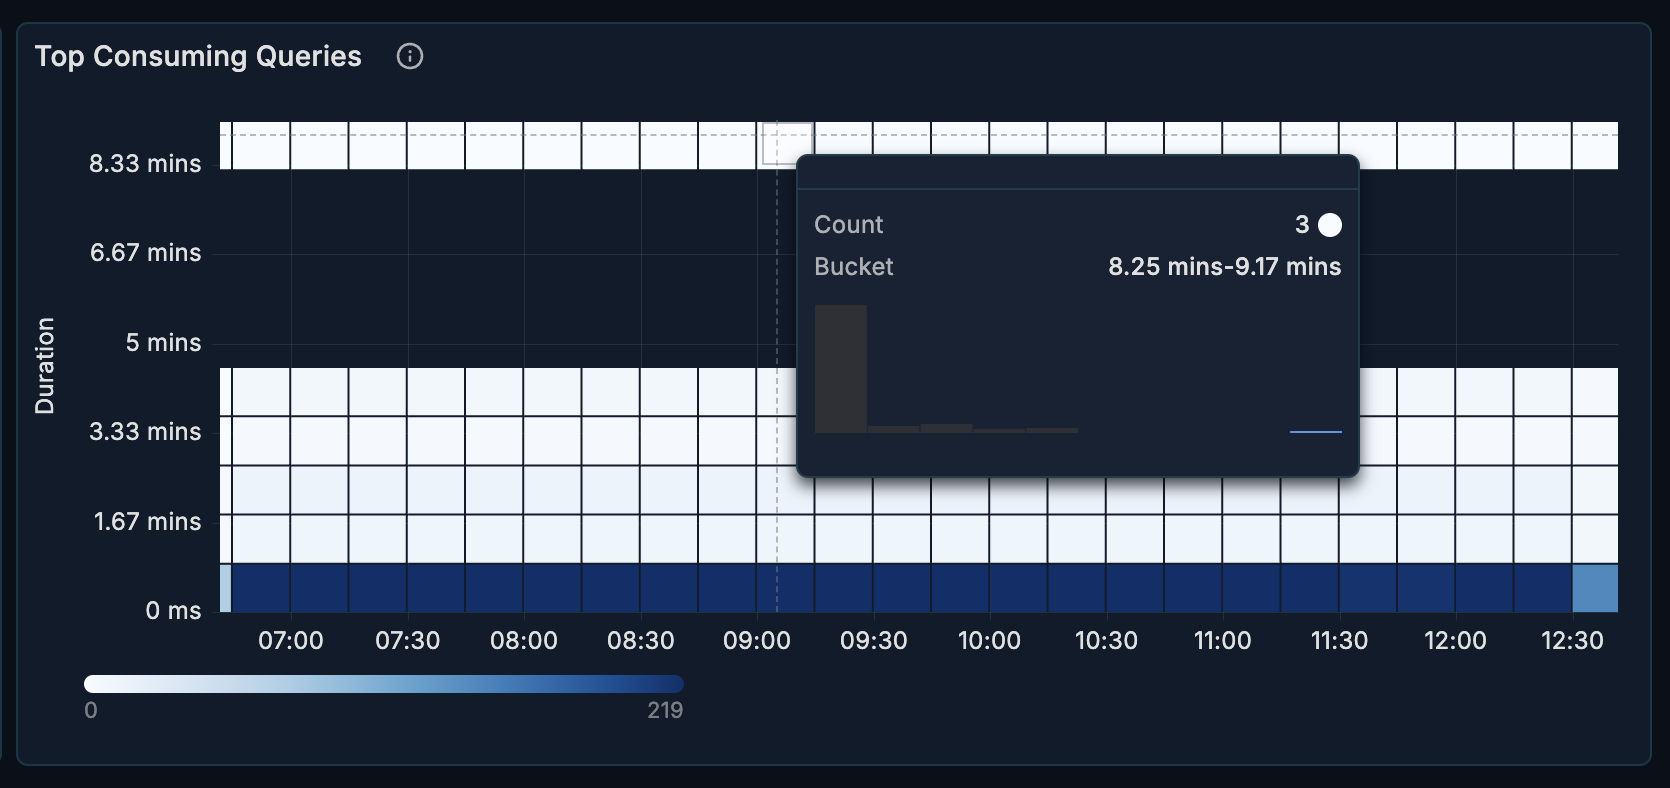
Top Consuming Queries
A heatmap visualization showing which queries consume the most resources.
What it shows:
- Query execution time distribution
- Resource-intensive queries highlighted
- Time-based patterns
How to interpret:
- Darker cells = higher resource consumption
- Horizontal patterns = consistently expensive queries
- Vertical patterns = time-based load spikes
How to use it:
- Identify your most expensive queries
- Spot queries that need optimization
- Correlate with deployment or traffic patterns
Query Analytics Section
A detailed table showing performance metrics for individual queries. This section is collapsed by default - click to expand.
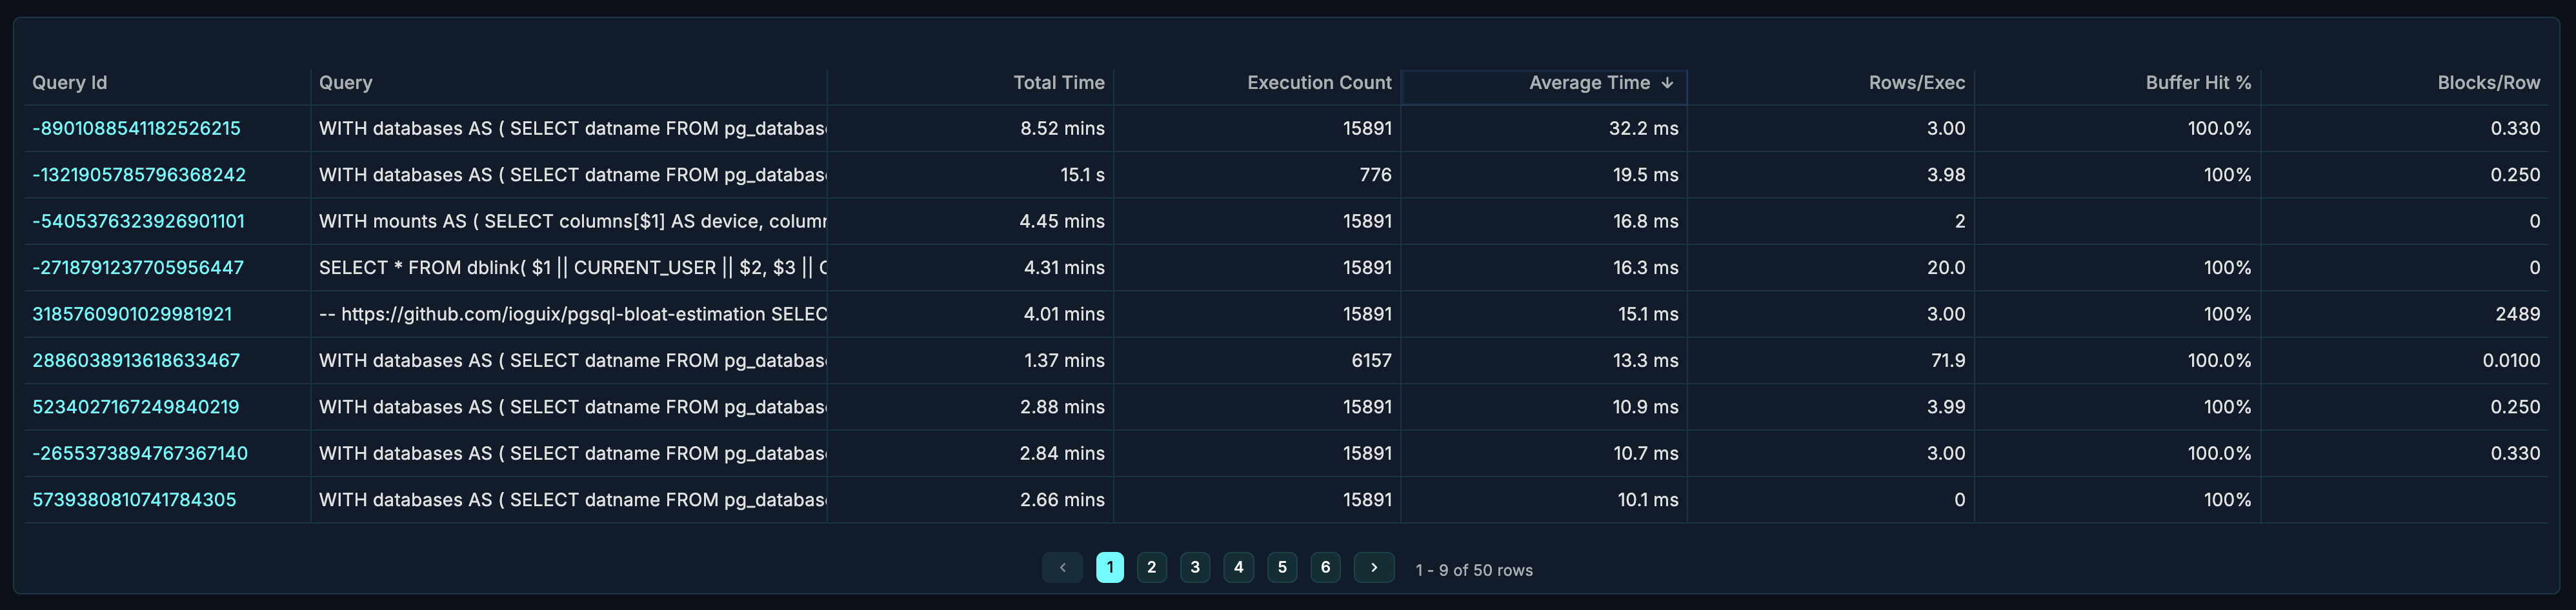
Table Columns
| Column | Description |
|---|---|
| Query | The SQL query text (normalized) |
| Calls | Number of times the query was executed |
| Total Time | Cumulative execution time |
| Mean Time | Average execution time per call |
| Min Time | Fastest execution |
| Max Time | Slowest execution |
| Rows | Total rows returned/affected |
| Shared Blks Hit | Buffer cache hits |
| Shared Blks Read | Disk reads required |
How to Use
Find slow queries:
- Sort by "Mean Time" descending
- Identify queries with high average execution time
- Focus optimization efforts on high-call-count slow queries
Find resource-intensive queries:
- Sort by "Total Time" descending
- These queries consume the most cumulative resources
- Even fast queries with high call counts can dominate
Identify caching issues:
- Compare "Shared Blks Hit" vs "Shared Blks Read"
- High read ratio = poor cache utilization
- Consider index improvements or memory tuning
Transactions Section
The Transactions section shows throughput and transaction health. This section is collapsed by default - click to expand.
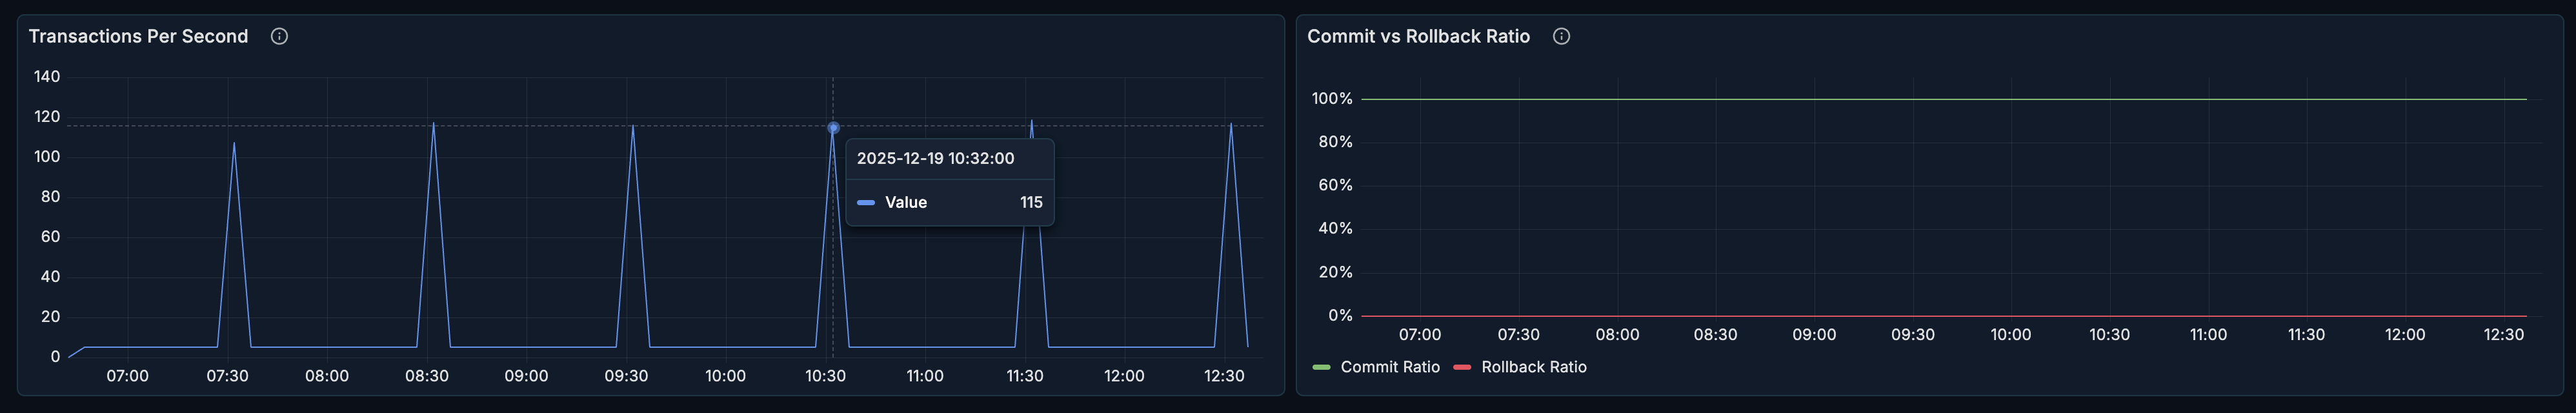
Transactions Per Second (TPS)
What it shows:
- Number of committed transactions per second
- Throughput trends over time
How to interpret:
- Stable TPS = consistent workload
- Drops in TPS = potential bottlenecks or issues
- Spikes = batch operations or traffic surges
Benchmarking:
- Establish baseline TPS for your workload
- Set alerts for significant deviations
- Use for capacity planning
Commit/Rollback Ratio
What it shows:
- Ratio of successful commits to rollbacks
- Transaction success rate over time
Healthy range: > 99% commits for most workloads.
When to investigate:
- Rollback rate exceeding 1%
- Sudden increase in rollbacks
- Correlation with application errors
Common causes of high rollbacks:
- Application errors
- Constraint violations
- Deadlocks
- Lock timeouts
Use Cases
Query Optimization Workflow
- Open the Performance section
- Identify expensive queries in the heatmap
- Expand Query Analytics for details
- Sort by "Total Time" to find biggest impact queries
- Analyze query patterns (missing indexes, full table scans)
- Implement optimizations
- Monitor response time improvements
Post-Deployment Performance Check
After deploying application changes:
- Compare Average Response Time before/after
- Check Query Distribution for unexpected changes
- Review Top Consuming Queries for new expensive queries
- Verify TPS hasn't degraded
- Confirm Commit/Rollback Ratio is healthy
Performance Baseline Establishment
To establish performance baselines:
- Monitor during typical load periods
- Record normal Average Response Time range
- Document typical TPS patterns
- Note expected Query Distribution
- Use these as reference for anomaly detection
Troubleshooting Slow Application
When users report slow application performance:
- Check Average Response Time for database-level latency
- Look for spikes correlating with reported issues
- Identify slow queries in Query Analytics
- Check Commit/Rollback Ratio for transaction failures
- Review TPS for throughput bottlenecks
Related Metrics
The Performance section uses these metrics from the Metrics Reference:
| Panel | Primary Metrics |
|---|---|
| Average Response Time | pg_statement_stats.avg_time_ms |
| Query Distribution | pg_statement_stats.calls |
| Top Consuming Queries | pg_statement_stats.total_time_ms, pg_statement_stats.calls |
| Query Analytics | pg_statement_stats.* |
| TPS | pg_database_stats.xact_commit |
| Commit/Rollback | pg_database_stats.xact_commit, pg_database_stats.xact_rollback |
Related Guides
- Queries - Deep query analysis with filtering
- Tables & Indexes - Index and table optimization
- Locks & Waits - Investigate transaction blocking