Configuration Reference
This document provides a complete reference of all pgX configuration options.
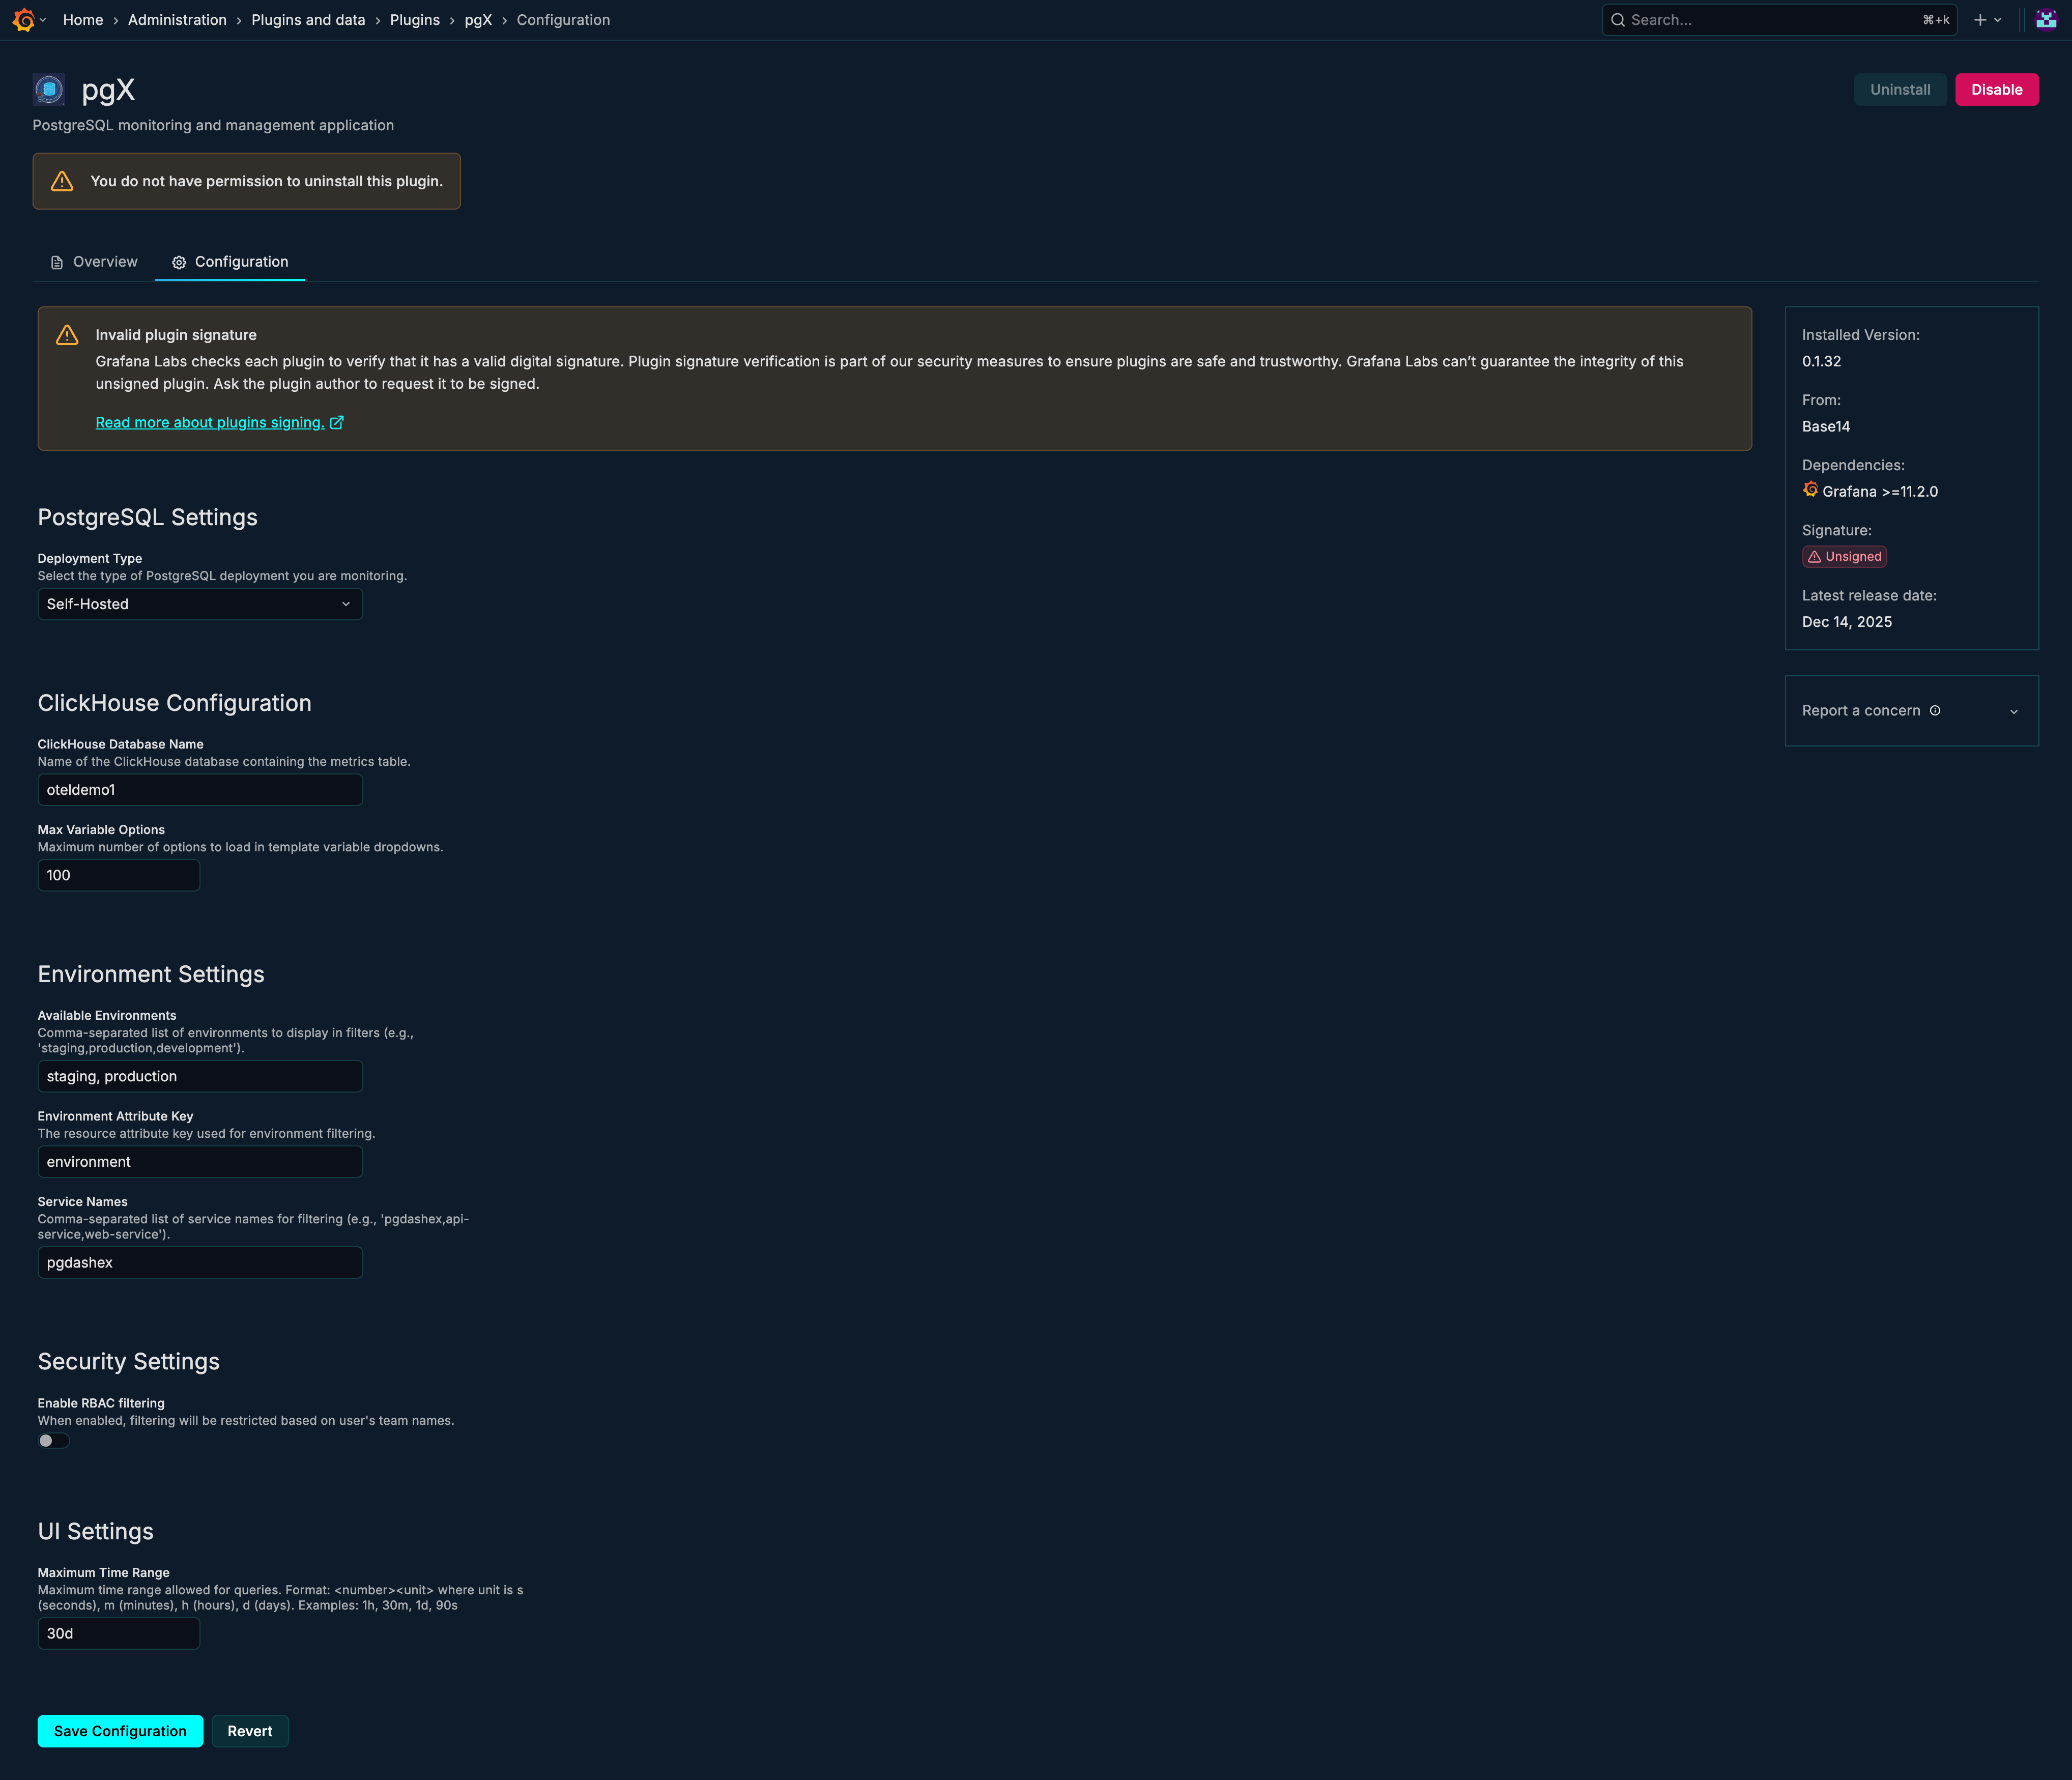
Accessing Configuration
- Navigate to Administration → Plugins in Grafana
- Search for "pgX"
- Click on the plugin
- Select the Configuration tab
Configuration Options
Data Source Settings
Datasource UID
| Property | Value |
|---|---|
| Setting | clickhouseDataSourceUid |
| Type | String |
| Required | Yes |
| Default | - |
The UID of your Scout Telemetry Data Lake datasource in Grafana. This datasource must be configured and working before pgX can display metrics.
How to find:
- Go to Connections → Data Sources
- Click on your Scout Telemetry Data Lake datasource
- The UID is in the URL or datasource settings
Database Name
| Property | Value |
|---|---|
| Setting | clickhouseDatabaseName |
| Type | String |
| Required | No |
| Default | default |
The database containing your PostgreSQL metrics tables.
Metrics Table Name
| Property | Value |
|---|---|
| Setting | metricsTableName |
| Type | String |
| Required | No |
| Default | otel_metrics_gauge |
The name of the table containing PostgreSQL metrics in OpenTelemetry format.
Environment Settings
Environments
| Property | Value |
|---|---|
| Setting | environments |
| Type | String (comma-separated) |
| Required | No |
| Default | staging,production |
Comma-separated list of environment names to show in the environment dropdown.
Examples:
staging,productiondev,staging,produs-east,us-west,eu-west
Environment Attribute Key
| Property | Value |
|---|---|
| Setting | environmentAttributeKey |
| Type | String |
| Required | No |
| Default | environment |
The resource attribute key used to filter metrics by environment. This should match the attribute used when collecting metrics.
Common values:
environmentenvdeployment.environment
Service Names
| Property | Value |
|---|---|
| Setting | serviceNames |
| Type | String (comma-separated) |
| Required | No |
| Default | pgdashex |
Comma-separated list of service names that identify your PostgreSQL metrics collector.
Query Settings
Max Time Range
| Property | Value |
|---|---|
| Setting | maxTimeRange |
| Type | String (duration) |
| Required | No |
| Default | 1h |
Maximum time range allowed for queries. Limits how far back users can query to prevent expensive queries.
Format: Duration string (e.g., 30m, 1h, 6h, 1d)
Examples:
30m- 30 minutes1h- 1 hour6h- 6 hours1d- 1 day
Max Variable Options
| Property | Value |
|---|---|
| Setting | maxVariableOptions |
| Type | Number |
| Required | No |
| Default | 100 |
Maximum number of options to load in template variable dropdowns. Increase if you have many databases/tables/indexes.
Access Control
Enable RBAC Service Name Filtering
| Property | Value |
|---|---|
| Setting | enableRBACServiceNameFiltering |
| Type | Boolean |
| Required | No |
| Default | false |
When enabled, filters metrics based on service names the user has access to. Requires Grafana Enterprise RBAC configuration.
Deployment Type
PostgreSQL Deployment Type
| Property | Value |
|---|---|
| Setting | postgresDeploymentType |
| Type | Enum |
| Required | No |
| Default | self-hosted |
The type of PostgreSQL deployment being monitored.
| Value | Description | Features |
|---|---|---|
self-hosted | PostgreSQL on your own infrastructure | All features |
rds | Amazon RDS for PostgreSQL | Includes Resources dashboard |
cloud-sql | Google Cloud SQL for PostgreSQL | Coming soon |
Impact:
self-hosted: Standard metrics, no cloud resource metricsrds: Enables AWS CloudWatch metrics in Resources dashboardcloud-sql: Future support for GCP metrics
RDS Settings
These settings only apply when postgresDeploymentType is set to rds.
RDS Service Name
| Property | Value |
|---|---|
| Setting | rdsServiceName |
| Type | String |
| Required | No (for RDS) |
| Default | aws-cloudwatch-stream |
The service name used for CloudWatch metrics collection.
RDS Metrics Prefix
| Property | Value |
|---|---|
| Setting | rdsMetricsPrefix |
| Type | String |
| Required | No (for RDS) |
| Default | amazonaws.com/AWS/RDS/ |
The prefix used for CloudWatch RDS metric names.
RDS Metrics Table Name
| Property | Value |
|---|---|
| Setting | rdsMetricsTableName |
| Type | String |
| Required | No (for RDS) |
| Default | otel_metrics_summary |
The table containing CloudWatch metrics.
RDS Attribute Format
| Property | Value |
|---|---|
| Setting | rdsAttributeFormat |
| Type | Enum |
| Required | No (for RDS) |
| Default | nested |
How CloudWatch dimension attributes are stored in the data lake.
| Value | Description |
|---|---|
nested | Attributes stored as nested JSON objects. Access via JSONExtract. Example: Attributes['Dimensions'] contains '{"DBInstanceIdentifier": "prod-db"}' |
flat | Attributes stored with dot-notation keys. Direct access. Example: Attributes['Dimensions.DBInstanceIdentifier'] contains 'prod-db' |
Configuration Examples
Basic Self-Hosted Configuration
{
  "clickhouseDataSourceUid": "your-clickhouse-uid",
  "clickhouseDatabaseName": "default",
  "metricsTableName": "otel_metrics_gauge",
  "environments": "staging,production",
  "postgresDeploymentType": "self-hosted"
}
AWS RDS Configuration
{
  "clickhouseDataSourceUid": "your-clickhouse-uid",
  "clickhouseDatabaseName": "metrics",
  "metricsTableName": "otel_metrics_gauge",
  "environments": "staging,production",
  "postgresDeploymentType": "rds",
  "rdsServiceName": "aws-cloudwatch-stream",
  "rdsMetricsPrefix": "amazonaws.com/AWS/RDS/",
  "rdsMetricsTableName": "otel_metrics_summary",
  "rdsAttributeFormat": "nested"
}
Multi-Region Configuration
{
  "clickhouseDataSourceUid": "your-clickhouse-uid",
  "clickhouseDatabaseName": "default",
  "metricsTableName": "otel_metrics_gauge",
  "environments": "us-east-1,us-west-2,eu-west-1",
  "environmentAttributeKey": "aws.region",
  "maxTimeRange": "6h",
  "maxVariableOptions": 200,
  "postgresDeploymentType": "rds"
}
Enterprise Configuration with RBAC
{
  "clickhouseDataSourceUid": "your-clickhouse-uid",
  "clickhouseDatabaseName": "metrics",
  "metricsTableName": "otel_metrics_gauge",
  "environments": "dev,staging,production",
  "enableRBACServiceNameFiltering": true,
  "serviceNames": "pgdashex-dev,pgdashex-staging,pgdashex-prod",
  "maxTimeRange": "1h",
  "postgresDeploymentType": "self-hosted"
}
Default Values Reference
| Setting | Default Value |
|---|---|
clickhouseDatabaseName | default |
metricsTableName | otel_metrics_gauge |
maxVariableOptions | 100 |
environments | staging,production |
environmentAttributeKey | environment |
enableRBACServiceNameFiltering | false |
maxTimeRange | 1h |
serviceNames | pgdashex |
postgresDeploymentType | self-hosted |
rdsServiceName | aws-cloudwatch-stream |
rdsMetricsPrefix | amazonaws.com/AWS/RDS/ |
rdsMetricsTableName | otel_metrics_summary |
rdsAttributeFormat | nested |
Troubleshooting
No Data Appearing
- Check datasource: Verify Scout Telemetry Data Lake datasource is working
- Verify table name: Ensure
metricsTableNamematches your actual table - Check service name: Ensure
serviceNamesmatches your collector - Review time range: Data may not exist in selected time range
Environment Dropdown Empty
- Check environments setting: Verify
environmentsis set correctly - Check attribute key: Ensure
environmentAttributeKeymatches your data - Verify data exists: Check the data lake for the expected attribute values
RDS Metrics Not Showing
- Check deployment type: Ensure
postgresDeploymentTypeisrds - Verify RDS table: Check
rdsMetricsTableNameis correct - Check attribute format: Ensure
rdsAttributeFormatmatches your data - Verify CloudWatch collection: Ensure metrics are being collected
Performance Issues
- Reduce time range: Lower
maxTimeRangesetting - Limit variables: Reduce
maxVariableOptions - Check query patterns: Review query performance in the data lake
Related Guides
- Getting Started - Initial setup guide
- Overview - Start using pgX
- Metrics Reference - Available metrics