CloudWatch Metrics Stream to OpenTelemetry - Setup Guide
Using Amazon CloudWatch Metric Streams and Amazon Data Firehose, you can get CloudWatch metrics into Scout Backend with only a two to three minute latency. This is significantly faster than polling approach
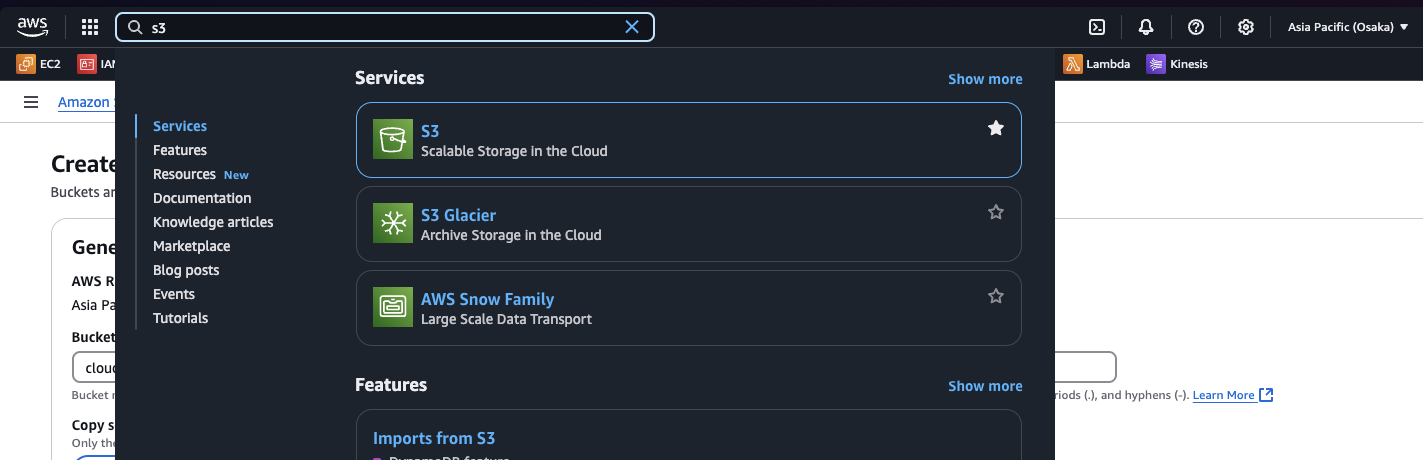
Step 1: Creating a S3 Bucket
First, we'll create an S3 bucket to store the metrics
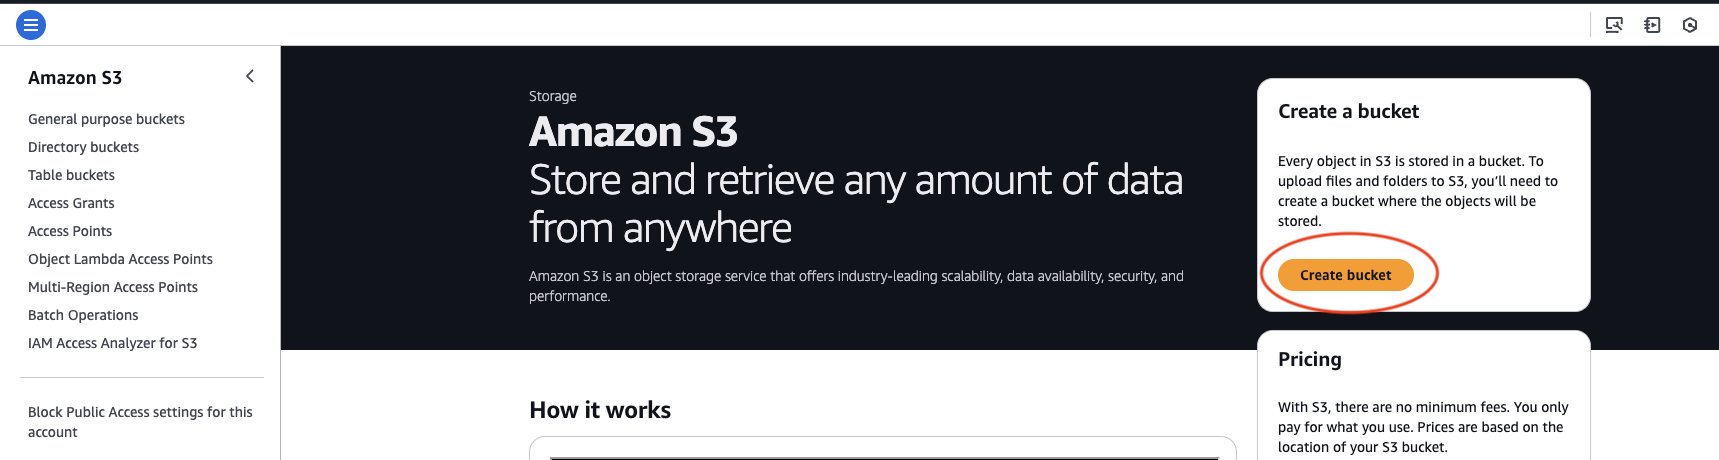
1. Go to S3 Dashboard
2. Click on Create bucket button
3. Enter the bucket name as cloudwatch-metrics-stream-bucket
leave all the other settings to default options.
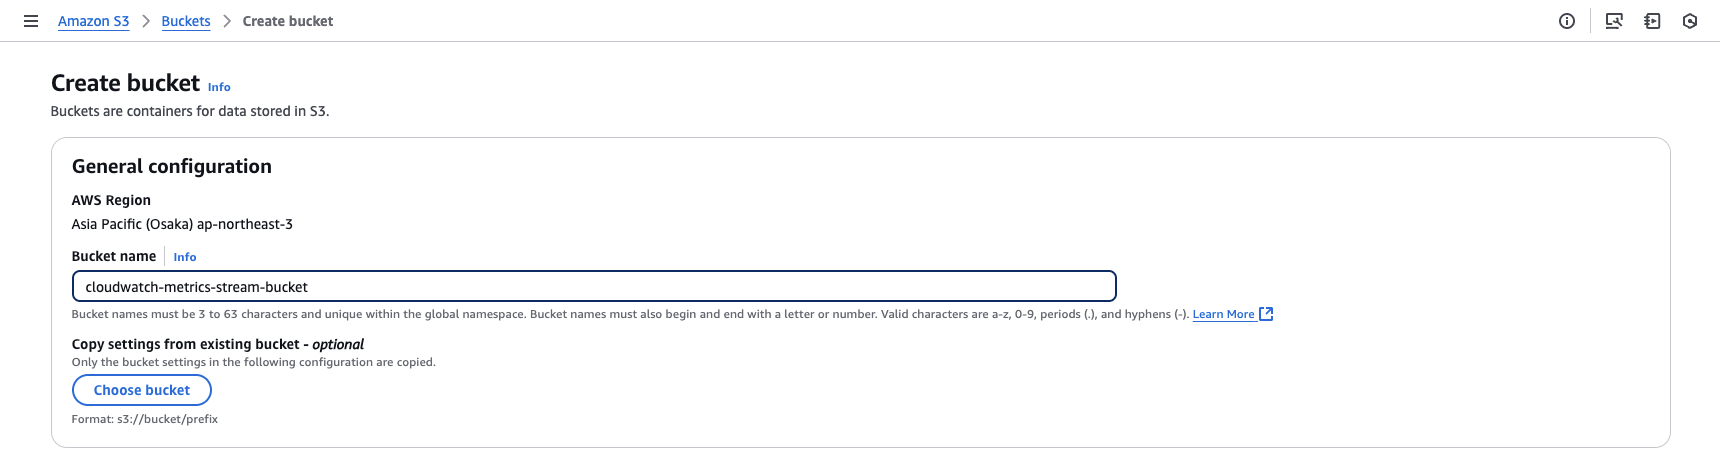
4. Scroll down and click on Create bucket
Step 2: Creating a Kinesis Firehose stream
Now, we'll create a kinesis stream which cloudwatch can use to stream metrics
1. Go to Kinsis Firehose Dashboard
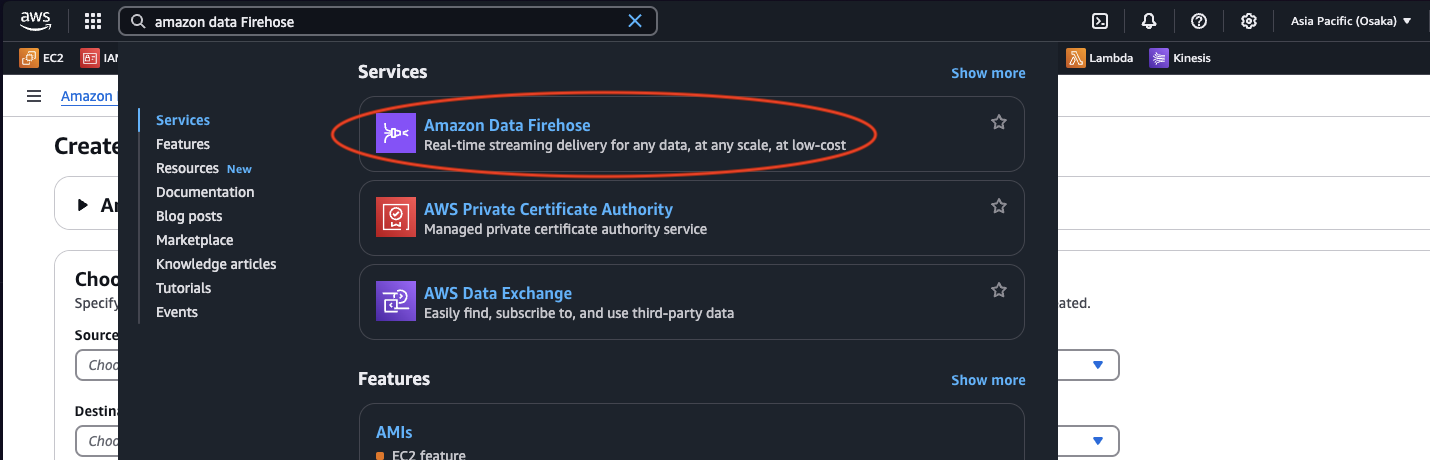
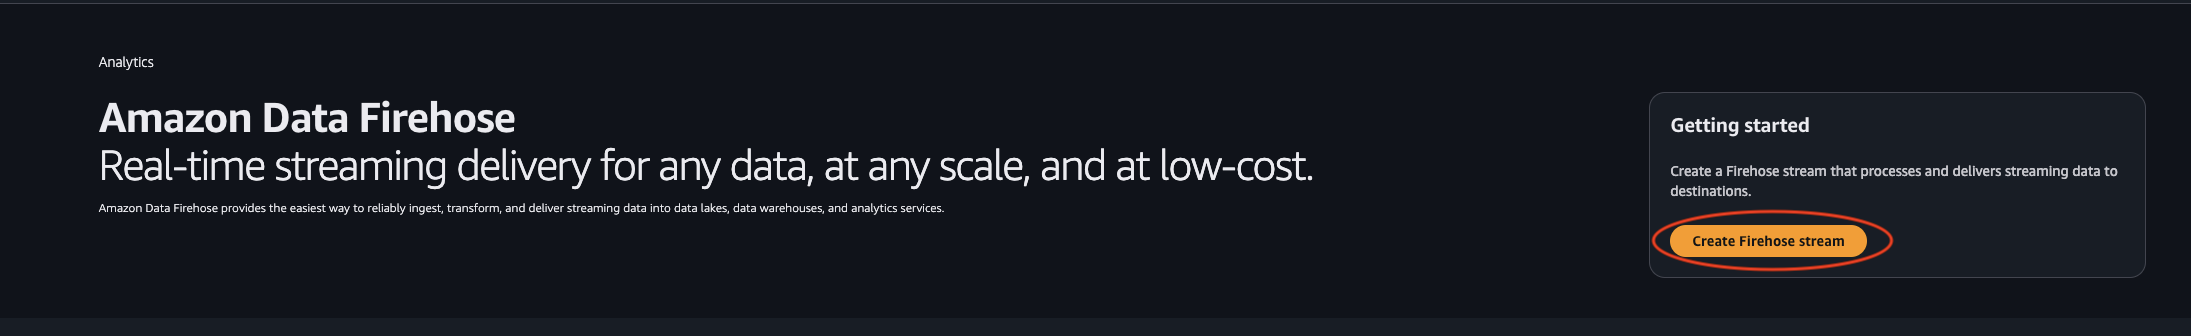
2. Click on Create Firehose Stream button
3. Set up the Sources
- Select
Direct PUTas the input source andS3as the output. - Select the S3 bucket name we created.
Format is
s3://<your-bucket-name>
- Enable
New Line Delimiterand leave everything else as default settings. - Scroll down and click on
Create Firehose Stream.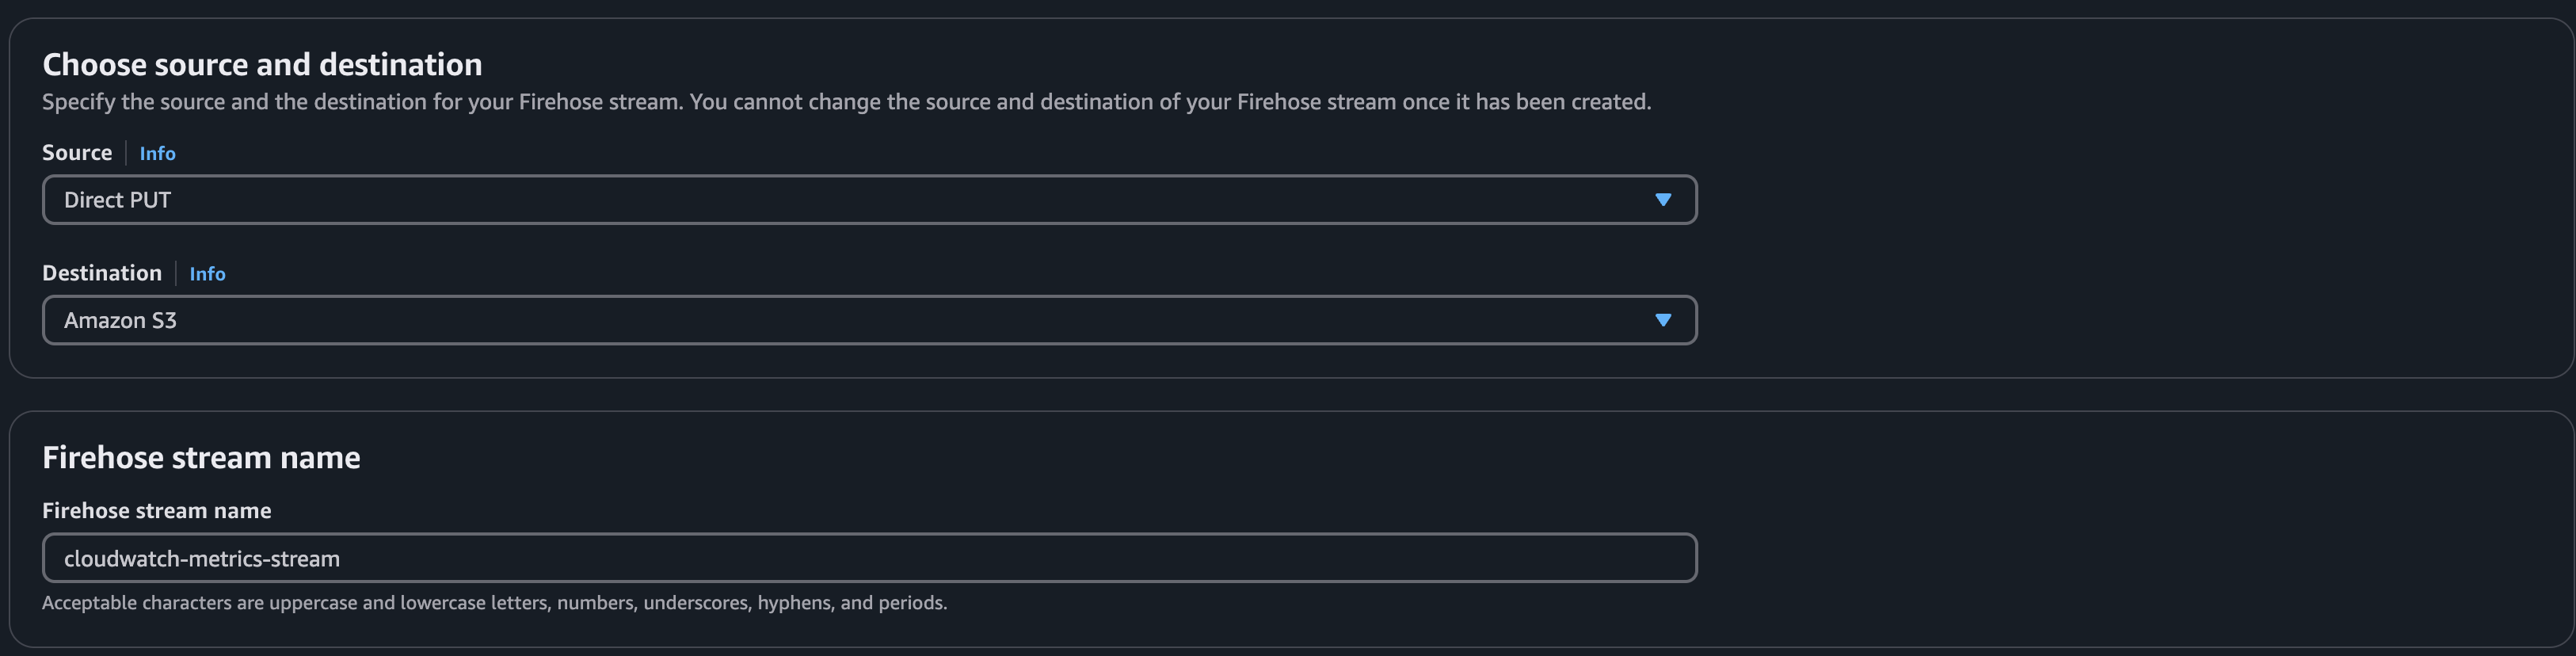
Step 3: Creating a Metrics Stream pipeline
Now, we'll configure cloudwatch to use the kinesis firehose stream to stream metrics to S3
1. Navigate to Cloudwatch dashboard and
Select streams under Metrics
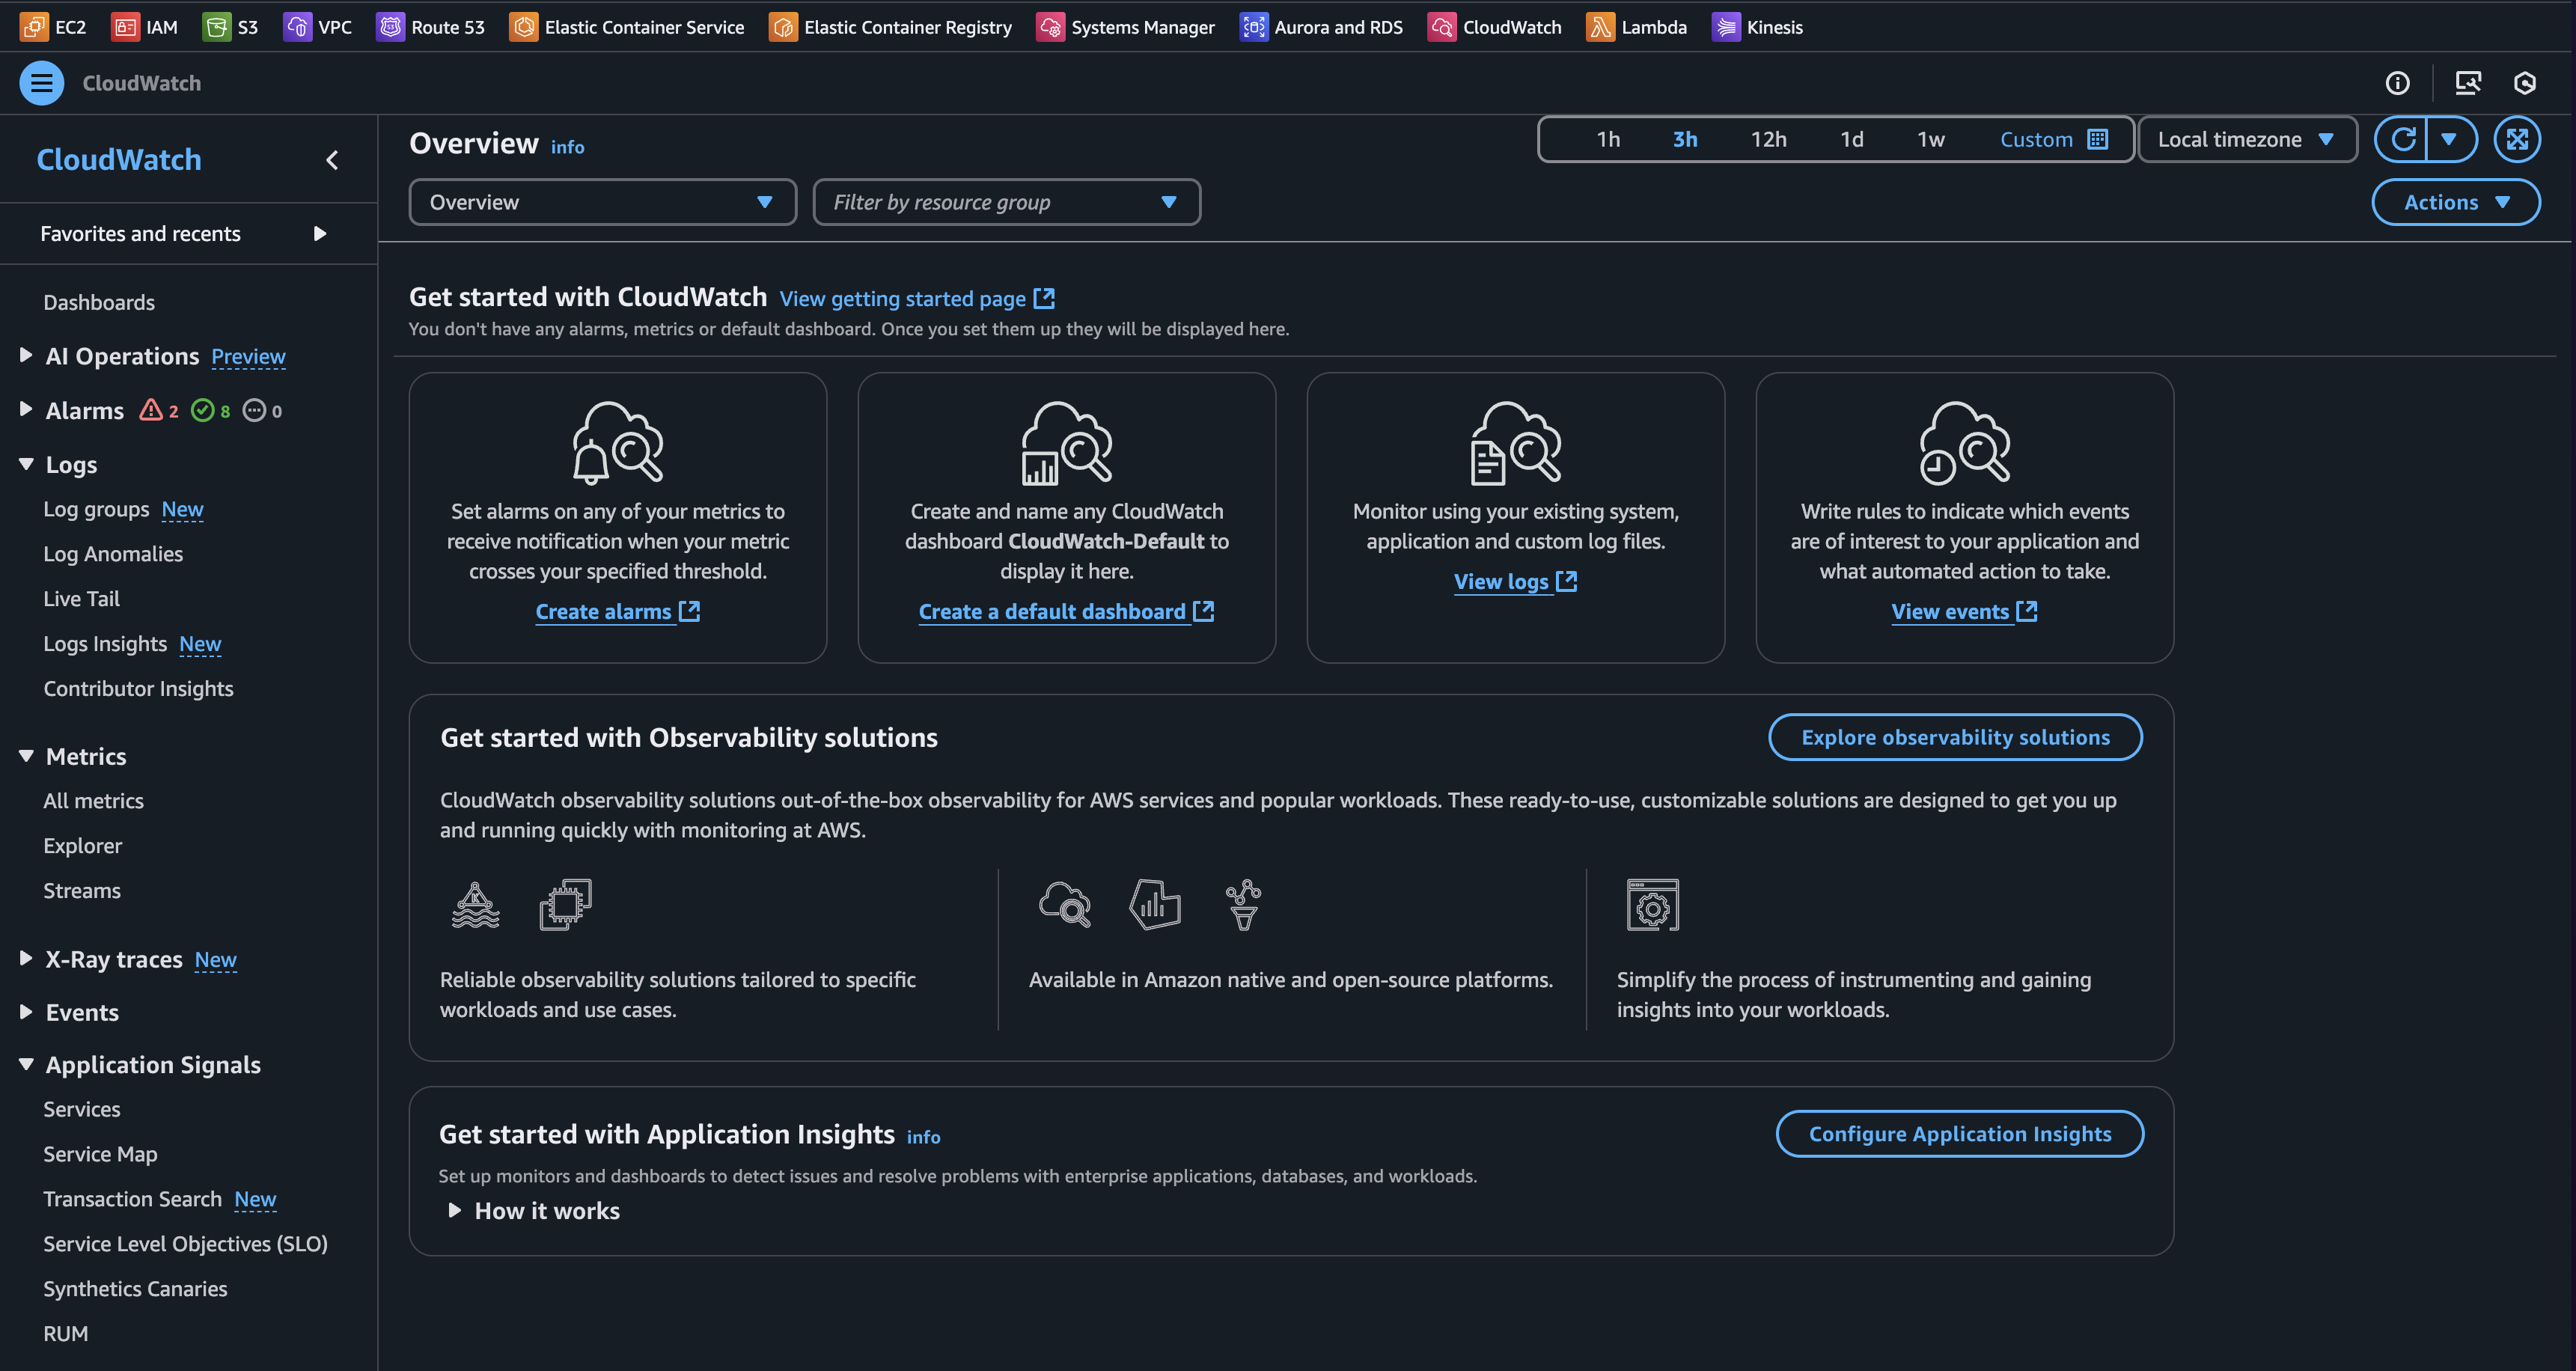
2. Click on Create Metrics Stream
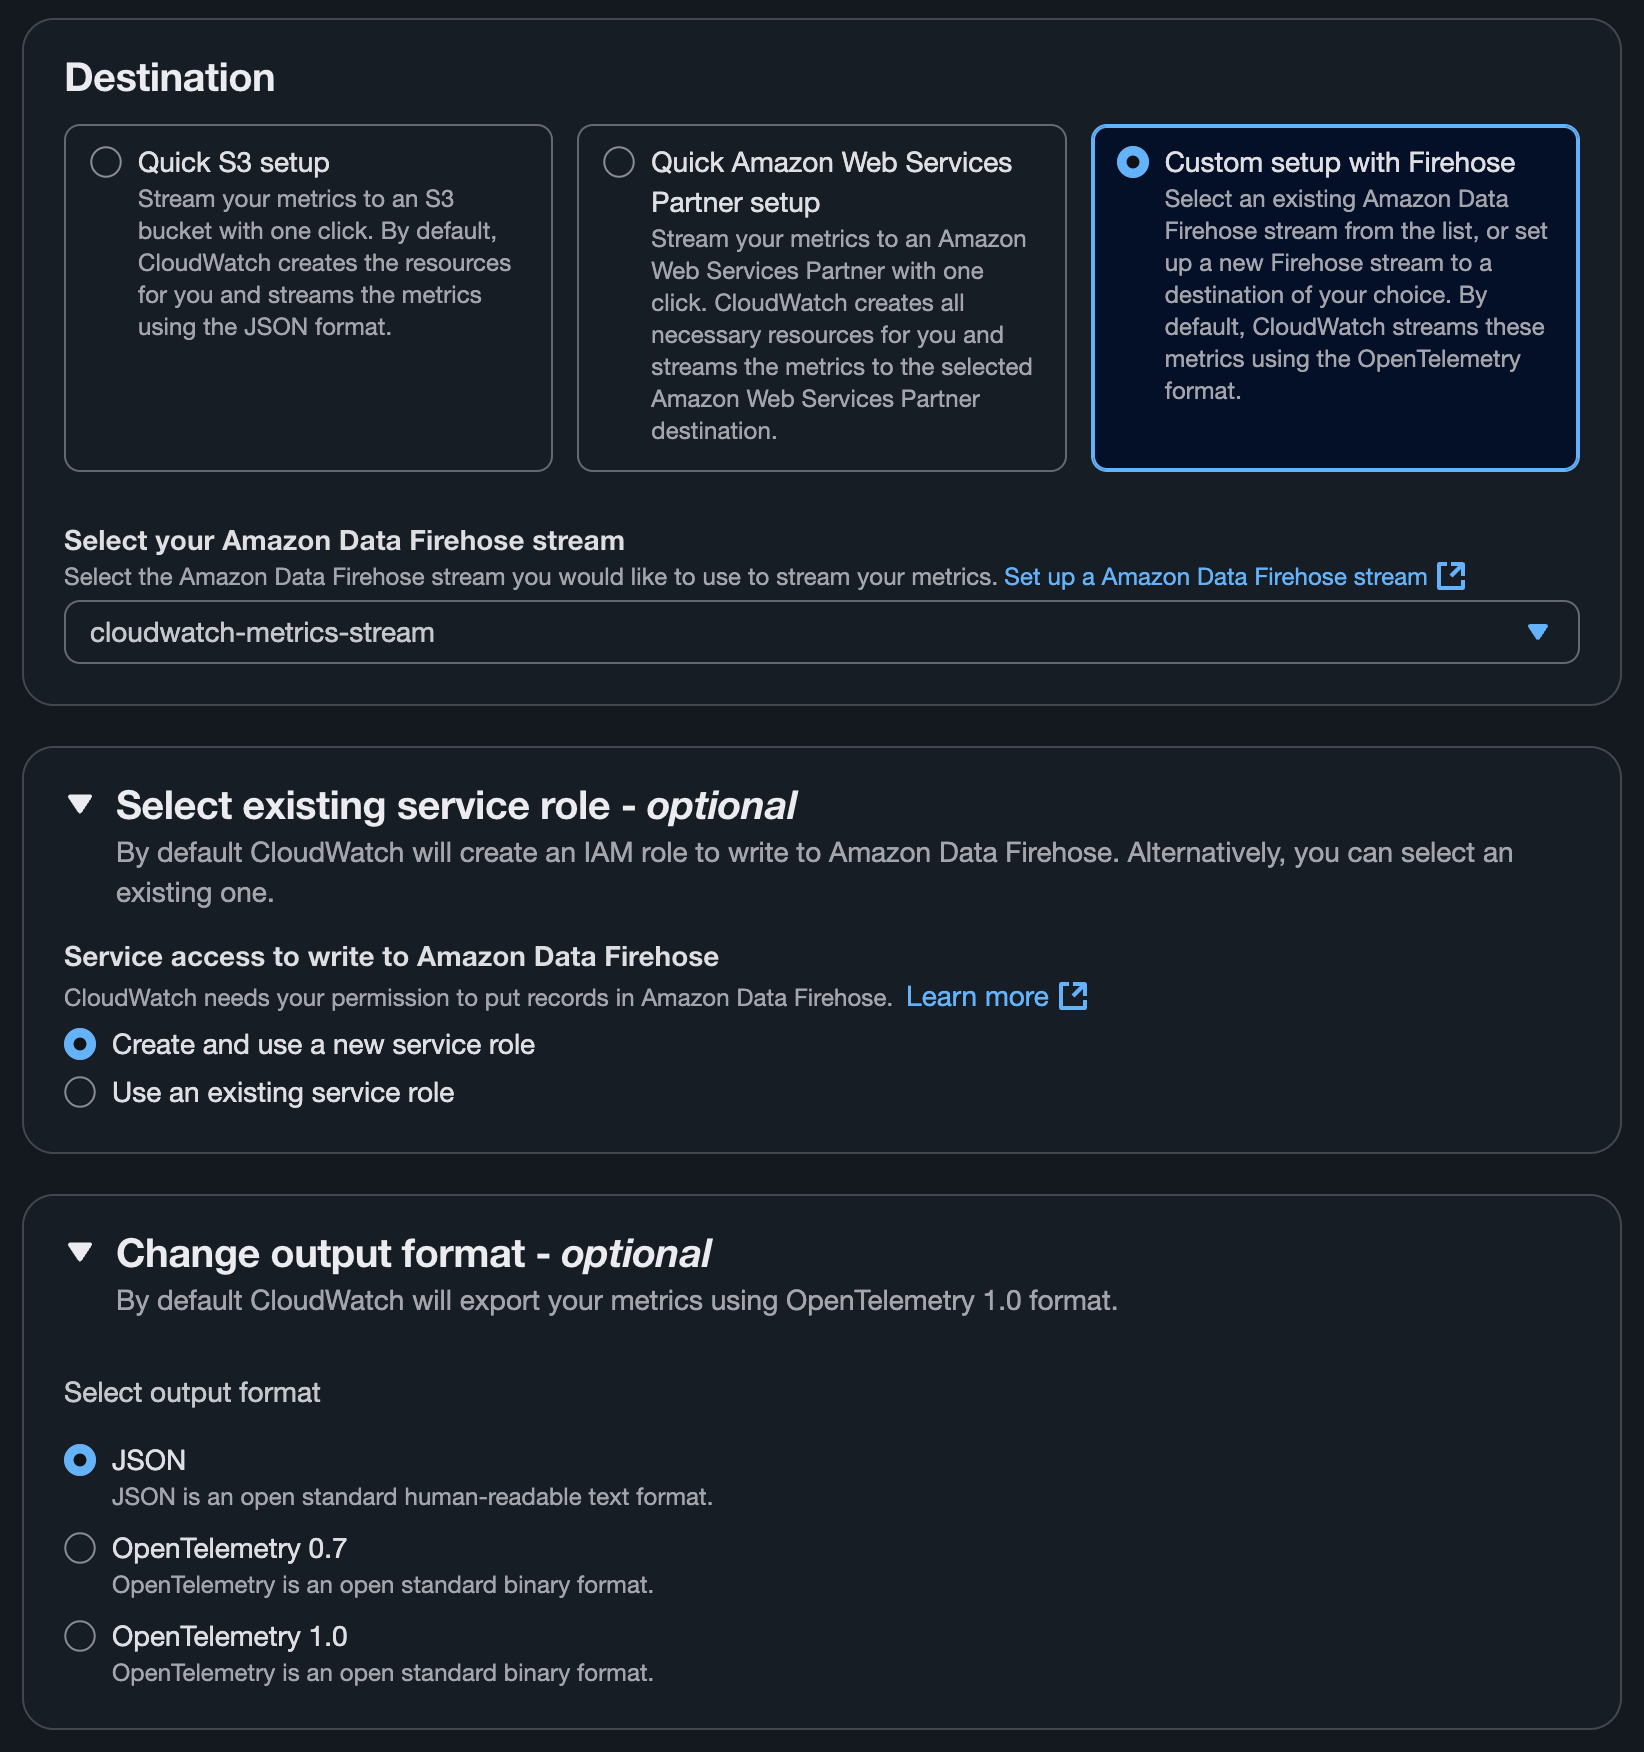
3. Configuring the Stream
- Select
Custom Setup with Firehose. - Change output format to
JSON - Select the required metrics.
- Give a name to the pipeline.
Click onCreate Metrics Stream`.
Good Job, Now the Cloudwatch metrics are streaming to a S3 bucket.
Step 4: Creating a lambda function
Now, let's create a lambda function to read from the s3 and send it to Scout Collector
1. Create a layer with all the necessary packages
mkdir python
# move into that directory
cd python

# install requests module
pip install --target . requests
# zip the contents under the name dependencies.zip
zip -r dependencies.zip ../python
2. Navigate to AWS Lambda dashboard and click on Layers
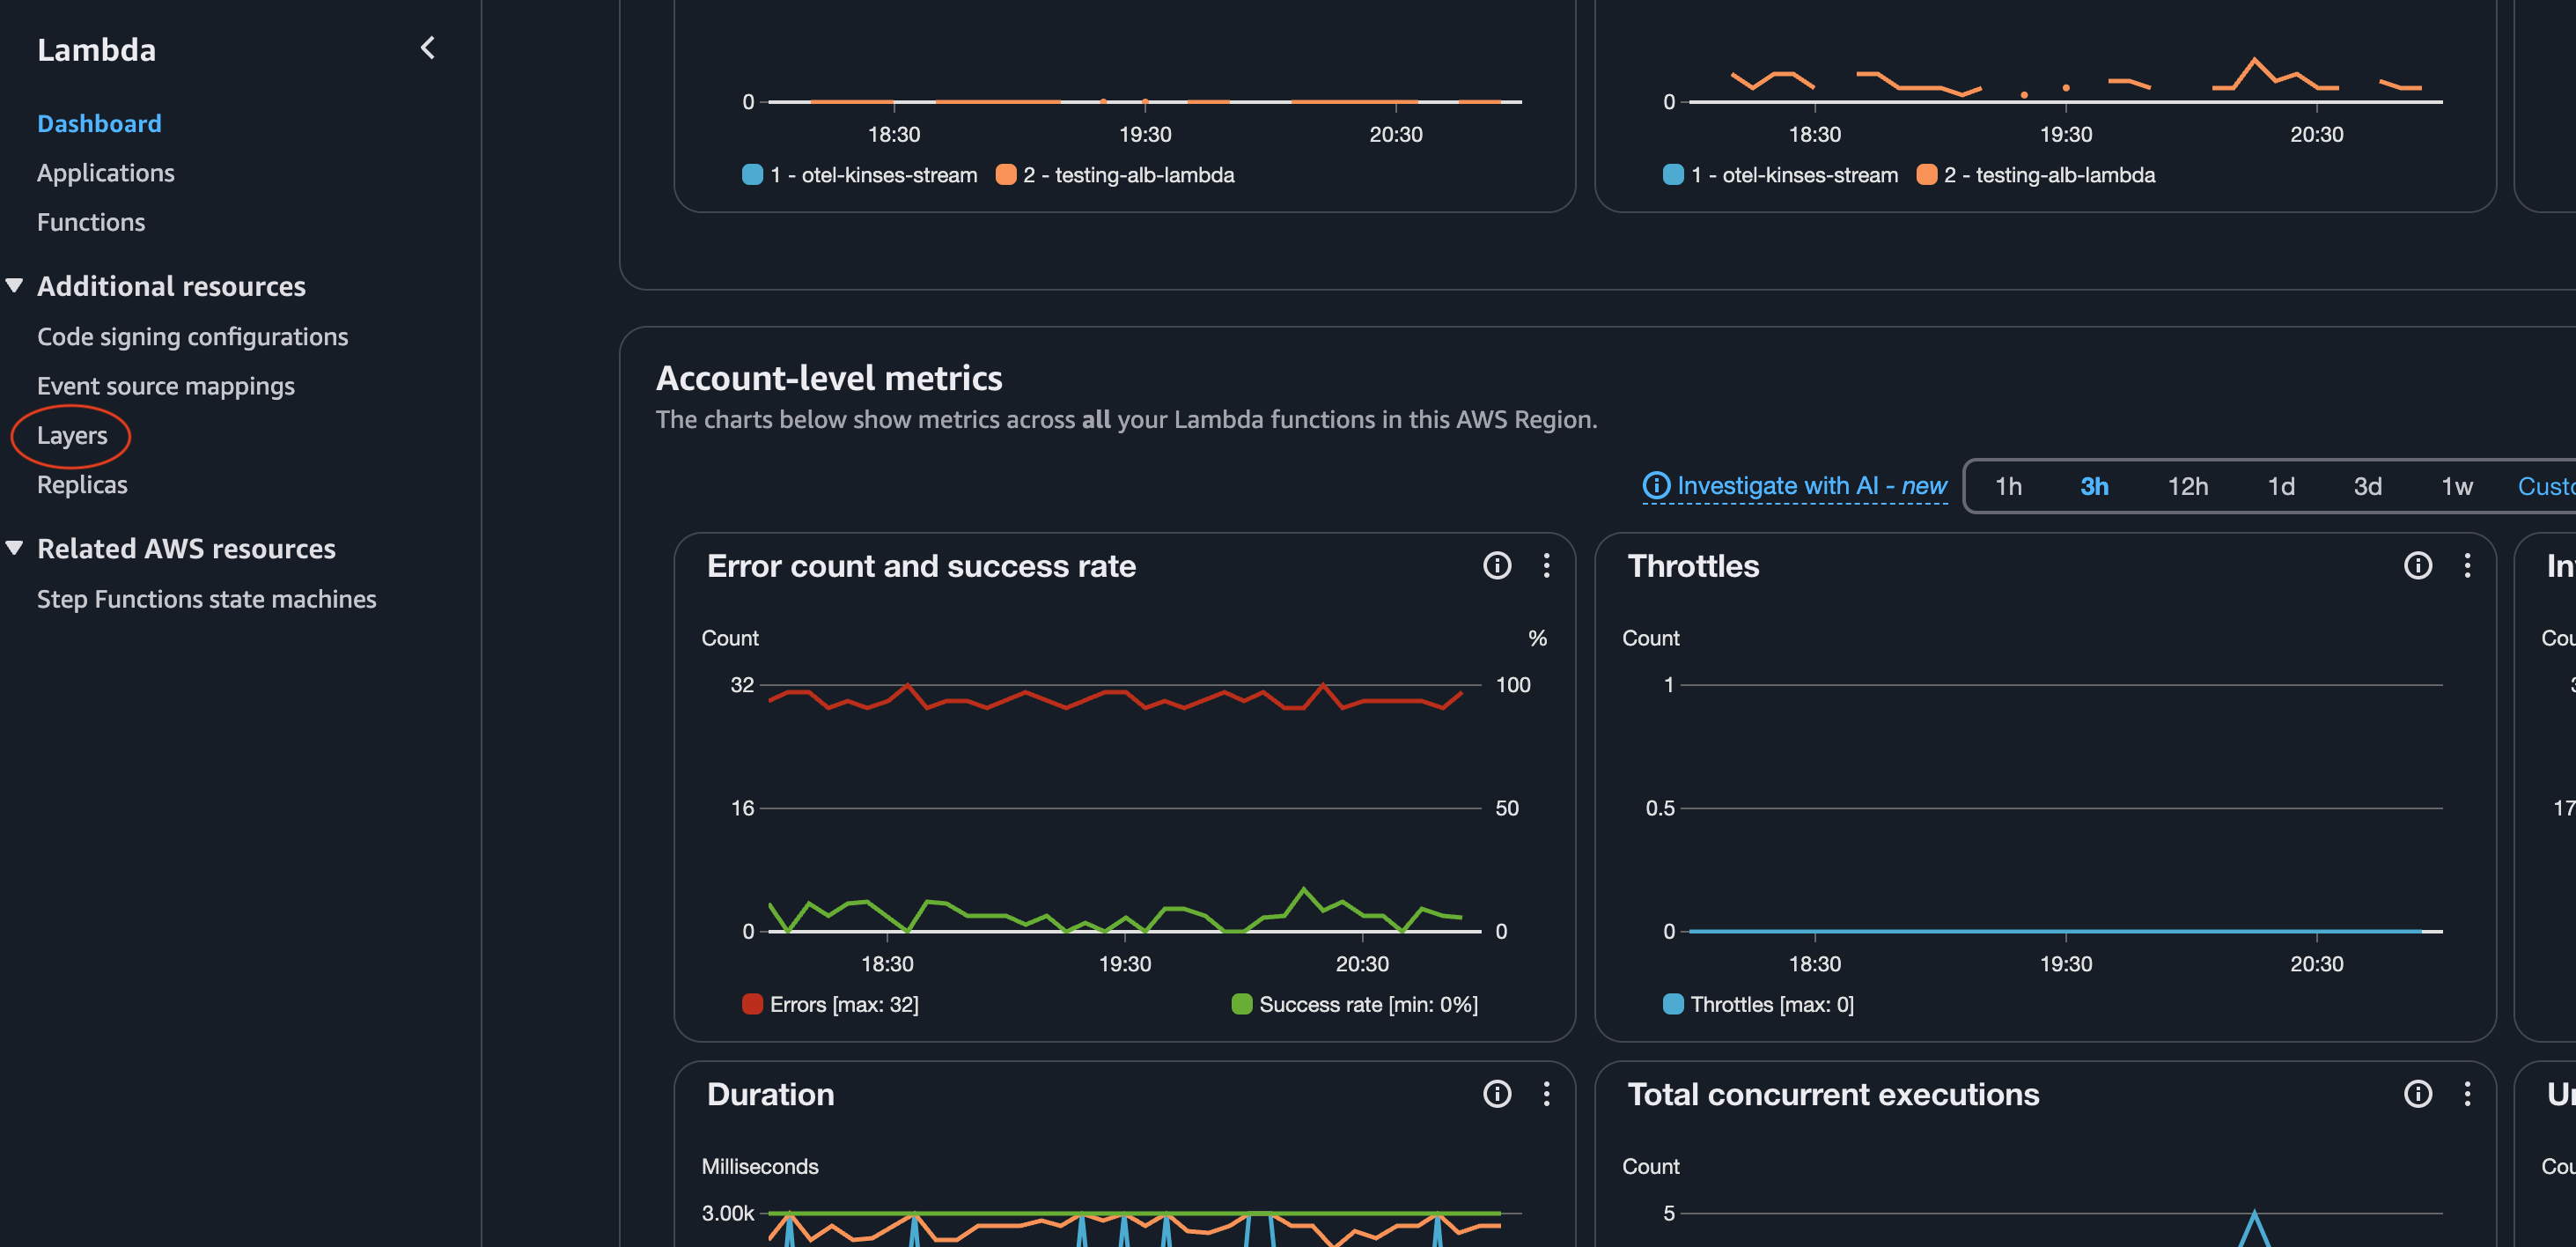
- Click on
Create layerbutton
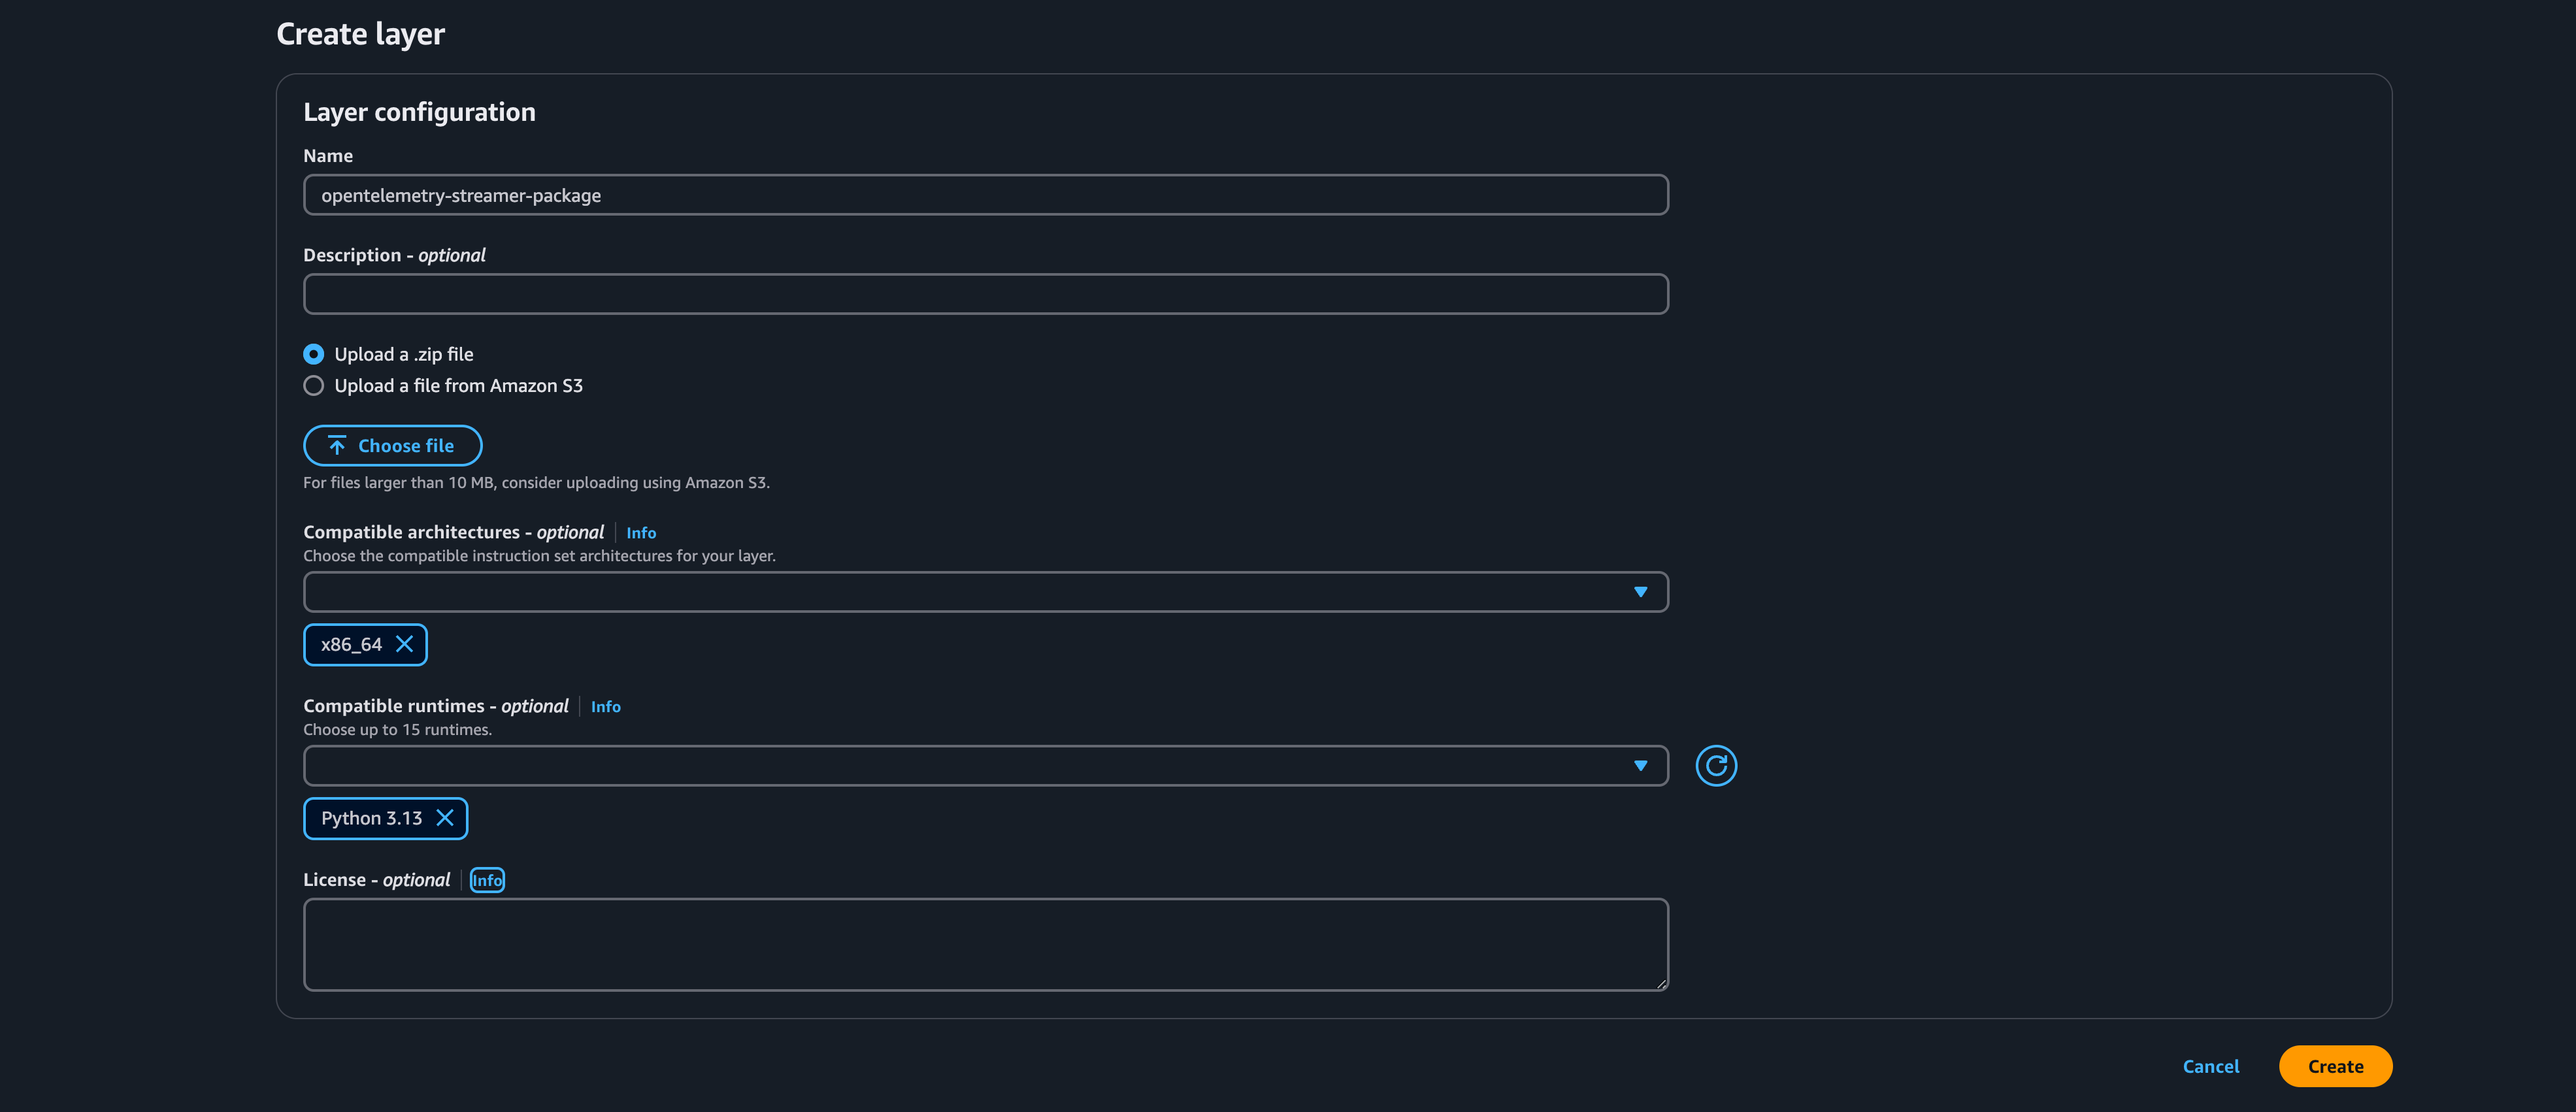
3. Fill the necessary details and upload the zip file
4. Naviagte to functions page and Click on Create function button
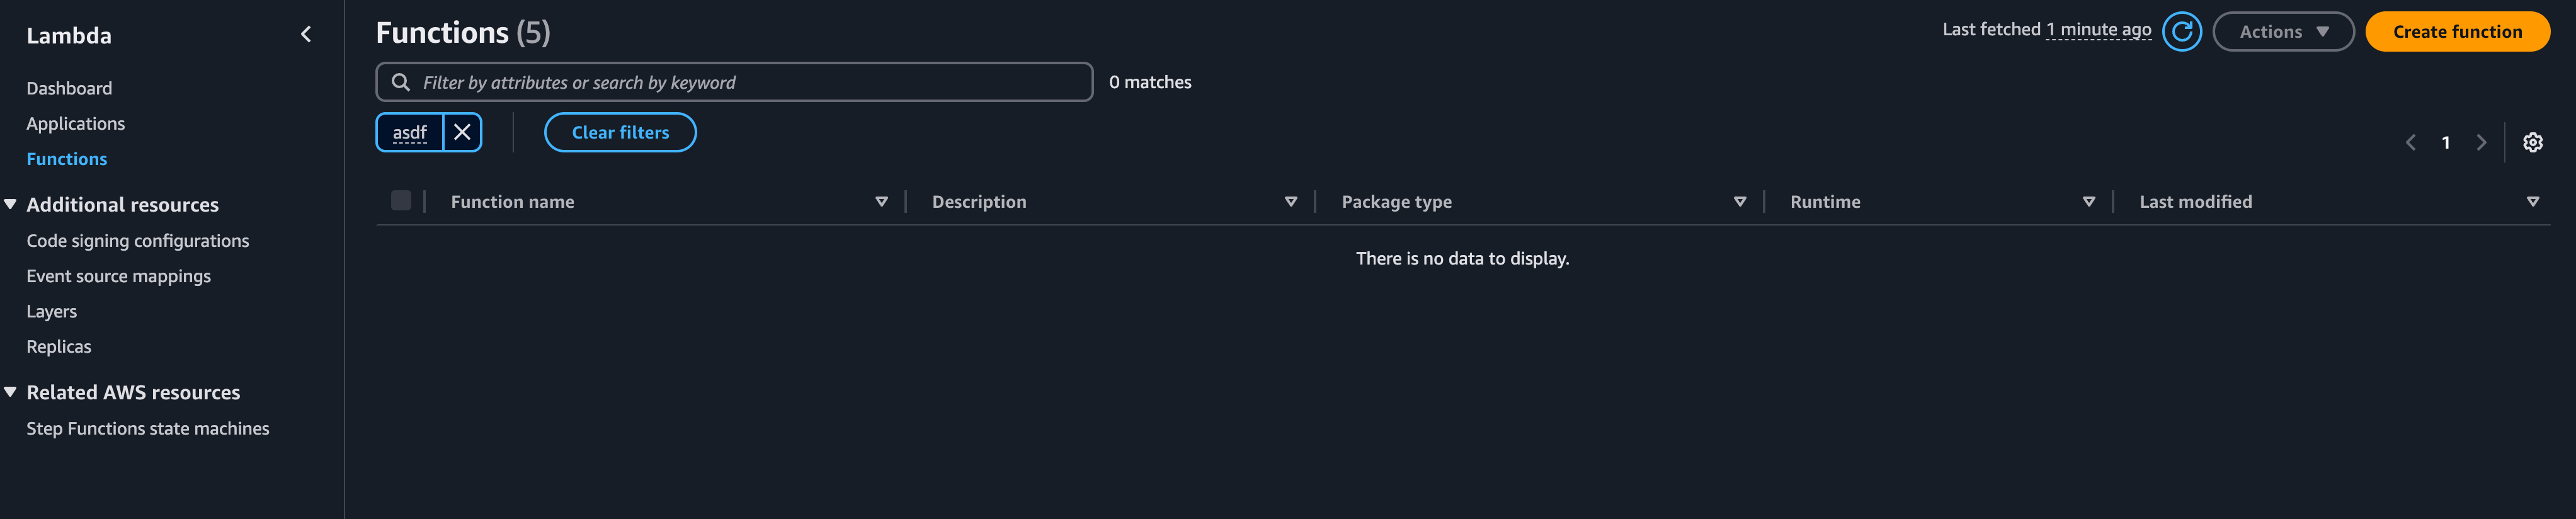
- Select
Author from scratch. - Give a function name (e.g.,
cloudwatch-metrics-to-scout). - Choose
Python 3.12as the runtime. - Select
x86_64as the Architecture. - Click
Create function.
5. Configure the Lambda function
Once the function is created, follow the steps below to configure it.
Add S3 permissions
The Lambda execution role needs access to read objects from the S3 bucket where Firehose writes metrics.
- Click on the
Configurationtab and then click onPermissions. - Click on the Role name link to open the IAM role in a new tab.
- Click
Add permissions→Create inline policy. - Switch to the
JSONtab and paste the following policy:
{
  "Version": "2012-10-17",
  "Statement": [
    {
      "Sid": "AllowListBucket",
      "Effect": "Allow",
      "Action": "s3:ListBucket",
      "Resource": "arn:aws:s3:::cloudwatch-metrics-stream-bucket"
    },
    {
      "Sid": "AllowGetObject",
      "Effect": "Allow",
      "Action": "s3:GetObject",
      "Resource": "arn:aws:s3:::cloudwatch-metrics-stream-bucket/*"
    }
  ]
}
Replace
cloudwatch-metrics-stream-bucketwith your actual bucket name if you chose a different name in Step 1.
- Click
Next, give the policy a name (e.g.,cloudwatch-stream-s3-read), and clickCreate policy.
Set the timeout
The default Lambda timeout of 3 seconds is too short for reading S3 objects and forwarding metrics over HTTP.
- In the
Configurationtab, click onGeneral configuration. - Click
Edit. - Set Timeout to
1 min 0 sec. - Click
Save.
Add the dependencies layer
- Click on
Codeand scroll down to the Layers section. - Click
Add a layer. - Select
Custom layersand choose the layer created in step 1. - Click
Add.
Add the S3 trigger
- Navigate back to the function overview and click
Add trigger. - Select
S3as the source. - Select the bucket (
cloudwatch-metrics-stream-bucket) from the dropdown. - Leave the event type as
All object create events. - Click
Add.
Set environment variables
The Lambda code reads four environment variables for authentication and endpoint configuration.
- In the
Configurationtab, click onEnvironment variables. - Click
Editand add the following variables:
| Key | Value |
|---|---|
CLIENT_ID | Your Scout OAuth client ID |
CLIENT_SECRET | Your Scout OAuth client secret |
TOKEN_URL | Your Scout token endpoint URL |
ENDPOINT_URL | Your Scout OTLP metrics endpoint (HTTP) |
- Click
Save.
Now the actual part, copy the below code into the code source in your lambda
function.
import boto3
import requests
import os
import json
from collections import defaultdict

s3 = boto3.client('s3')
client_id = os.environ.get('CLIENT_ID')
client_secret = os.environ.get('CLIENT_SECRET')
token_url = os.environ.get('TOKEN_URL')
endpoint_url = os.environ.get('ENDPOINT_URL')

def parse_cloudwatch_json_file(buffer):
    """
    Parse CloudWatch Metrics Stream JSON file (newline-delimited JSON).
    Returns a list of metric dictionaries.
    """
    metrics = []
    content = buffer.decode('utf-8')

    for line in content.strip().split('\n'):
        line = line.strip()
        if not line:
            continue
        try:
            metric = json.loads(line)
            metrics.append(metric)
        except json.JSONDecodeError as e:
            print(f"Failed to parse JSON line: {e}")
            continue

    return metrics

def convert_to_otlp_json(metrics):
    """
    Convert CloudWatch metrics to OTLP JSON format.
    Groups metrics by account/region for efficient batching.
    Preserves attribute format: Namespace, MetricName, Dimensions (as JSON string)
    """
    grouped = defaultdict(list)
    for metric in metrics:
        key = (metric.get('account_id', ''), metric.get('region', ''))
        grouped[key].append(metric)

    resource_metrics = []

    for (account_id, region), account_metrics in grouped.items():
        # Resource attributes
        resource_attributes = [
            {"key": "cloud.provider", "value": {"stringValue": "aws"}},
            {"key": "cloud.account.id", "value": {"stringValue": account_id}},
            {"key": "cloud.region", "value": {"stringValue": region}},
            {"key": "service.name", "value": {"stringValue": "aws-cloudwatch-stream"}},
            {"key": "environment", "value": {"stringValue": "production"}},
        ]

        otlp_metrics = []
        for cw_metric in account_metrics:
            metric_name = cw_metric.get('metric_name', 'unknown')
            namespace = cw_metric.get('namespace', '')
            timestamp_ms = cw_metric.get('timestamp', 0)
            timestamp_ns = timestamp_ms * 1_000_000
            value = cw_metric.get('value', {})
            unit = cw_metric.get('unit', '')
            dimensions = cw_metric.get('dimensions', {})

            datapoint_attributes = [
                {"key": "Namespace", "value": {"stringValue": namespace}},
                {"key": "MetricName", "value": {"stringValue": metric_name}},
                {"key": "Dimensions", "value": {"stringValue": json.dumps(dimensions)}},
            ]

            otlp_metrics.append({
                "name": f"amazonaws.com/{namespace}/{metric_name}",
                "unit": unit if unit != "None" else "",
                "summary": {
                    "dataPoints": [{
                        "timeUnixNano": str(timestamp_ns),
                        "count": str(int(value.get('count', 0))),
                        "sum": value.get('sum', 0.0),
                        "quantileValues": [
                            {"quantile": 0.0, "value": value.get('min', 0.0)},
                            {"quantile": 1.0, "value": value.get('max', 0.0)}
                        ],
                        "attributes": datapoint_attributes
                    }]
                }
            })

        resource_metrics.append({
            "resource": {"attributes": resource_attributes},
            "scopeMetrics": [{
                "scope": {"name": "aws.cloudwatch", "version": "1.0.0"},
                "metrics": otlp_metrics
            }]
        })

    return {"resourceMetrics": resource_metrics}


def lambda_handler(event, context):
    for record in event['Records']:
        bucket_name = record['s3']['bucket']['name']
        file_key = record['s3']['object']['key']
        print(f"Processing file: {file_key}")

        file_obj = s3.get_object(Bucket=bucket_name, Key=file_key)
        buffer = file_obj['Body'].read()

        try:
            metrics = parse_cloudwatch_json_file(buffer)
            print(f"Parsed {len(metrics)} metrics from file")
        except Exception as e:
            print(f"Error parsing file: {e}")
            raise

        if not metrics:
            print("No metrics found in file")
            continue

        try:
            otlp_payload = convert_to_otlp_json(metrics)
            print(f"Converted to OTLP format with {len(otlp_payload['resourceMetrics'])} resource groups")
        except Exception as e:
            print(f"Error converting to OTLP: {e}")
            raise

        try:
            token_response = requests.post(
                token_url,
                data={
                    "grant_type": "client_credentials",
                    "audience": "b14collector",
                },
                auth=(client_id, client_secret),
                verify=False,
            )
            token_response.raise_for_status()
            access_token = token_response.json()["access_token"]
        except Exception as e:
            print(f"Failed to get auth token: {e}")
            raise

        headers = {
            "Content-Type": "application/json",
            "Authorization": f"Bearer {access_token}"
        }

        try:
            response = requests.post(
                endpoint_url,
                json=otlp_payload,
                headers=headers,
                verify=False,
            )

            if response.status_code == 200:
                print(f"Successfully forwarded {len(metrics)} metrics to OTLP endpoint")
            else:
                print(f"Failed to send metrics. Status: {response.status_code}, Response: {response.text}")

        except Exception as e:
            print(f"Error sending to endpoint: {e}")
            raise

    return {
        'statusCode': 200,
        'body': f'Processed {len(event["Records"])} files'
    }
- Click on the
Deploy
That's it, you're done
Head back to the Scout dashboards to view all your AWS Services metrics.
Related Guides
- Application Load Balancer Monitoring - Monitor AWS ALB with CloudWatch Metrics Stream
- RDS Monitoring - Monitor AWS RDS databases
- Scout Exporter Configuration - Configure authentication and endpoints