CloudWatch Metric Streams to OpenTelemetry - Complete Setup Guide
Using Amazon CloudWatch Metric Streams and Amazon Data Firehose (formerly Kinesis Data Firehose), you can get CloudWatch metrics into base14 Scout with low latency. Firehose buffers the stream in S3, and a Lambda function converts each batch to OTLP and forwards it to Scout, so end-to-end delivery is typically three to five minutes - faster than polling the CloudWatch APIs.
Amazon Data Firehose can deliver to an HTTP endpoint directly, but base14 Scout expects OTLP over an OAuth2-authenticated endpoint, which Firehose cannot produce on its own. This pipeline uses S3 as a buffer and a Lambda to convert each batch to OTLP and attach the OAuth2 token. If you can run a public HTTPS OpenTelemetry Collector, the Firehose to the OTel Collector approach skips S3 and Lambda for lower latency.
Step 1: Creating an S3 bucket
First, we'll create an S3 bucket to store the metrics.
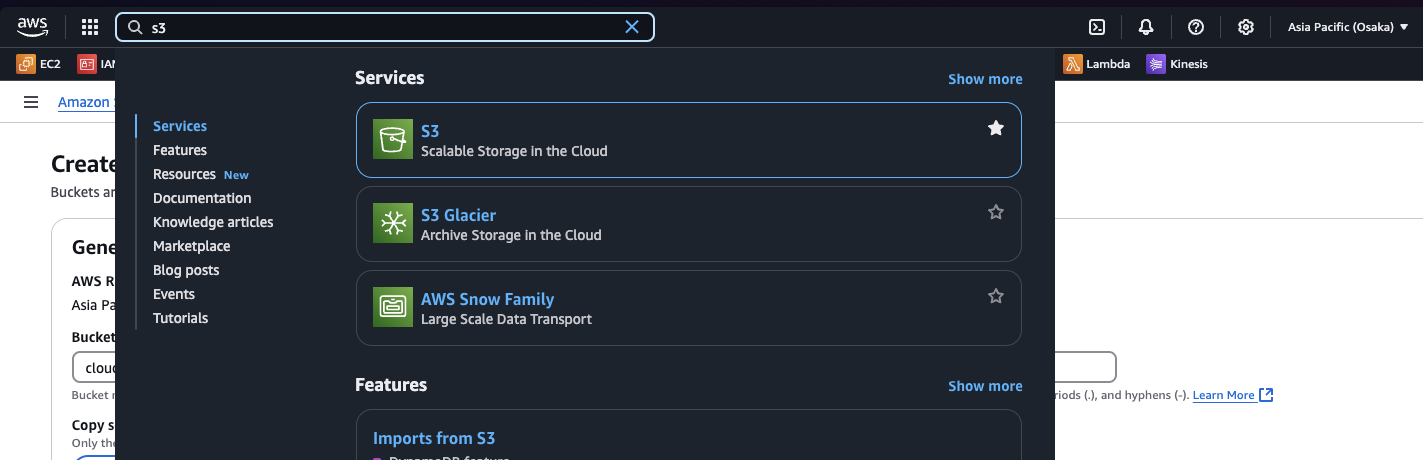
1. Go to the S3 Dashboard
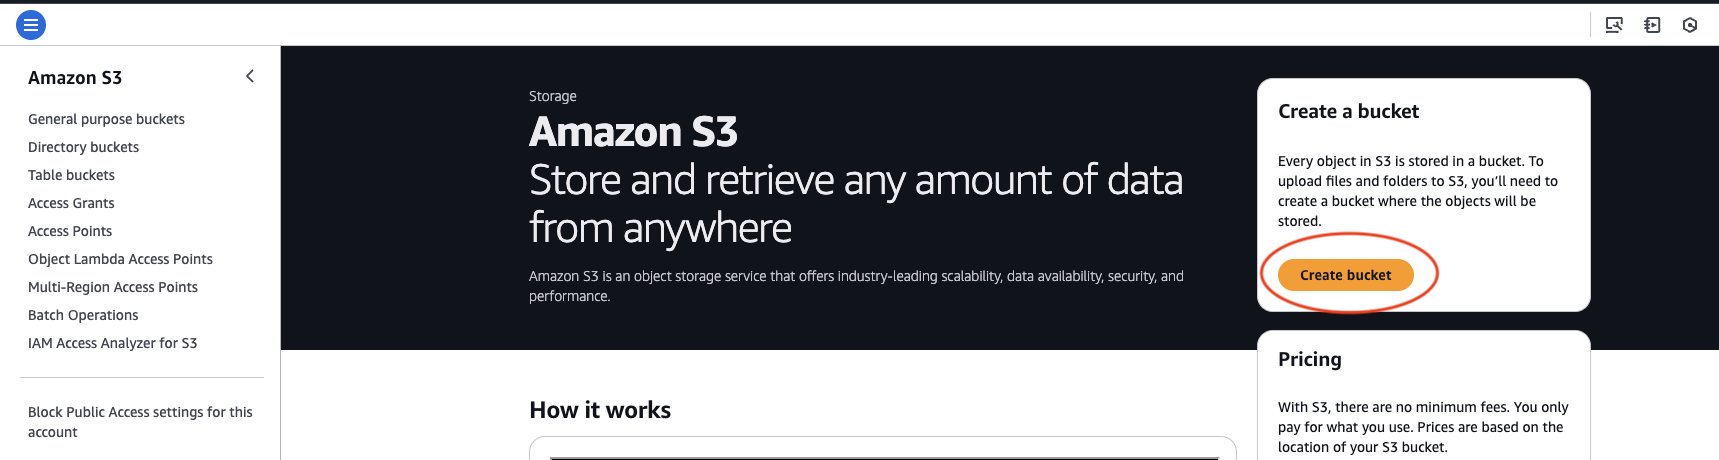
2. Click Create bucket
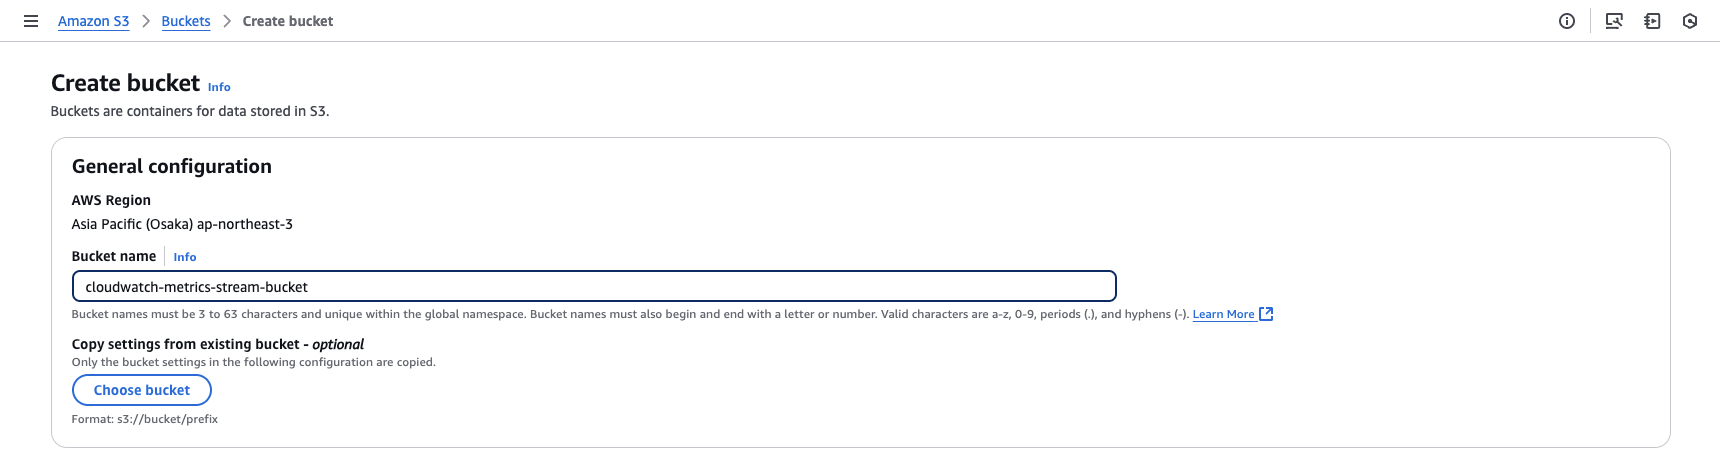
3. Enter the bucket name as cloudwatch-metrics-stream-bucket
Leave all the other settings at their default options.
4. Scroll down and click Create bucket
Step 2: Creating an Amazon Data Firehose stream
Now, we'll create an Amazon Data Firehose stream that CloudWatch can use to stream metrics.
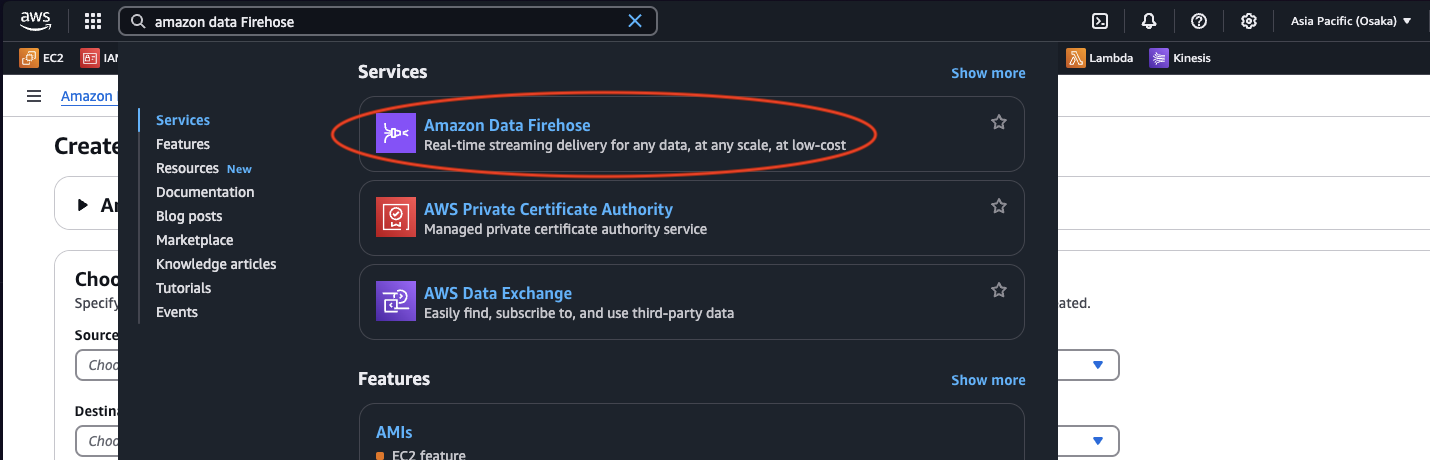
1. Go to the Amazon Data Firehose Dashboard
2. Click Create Firehose Stream

3. Set up the sources
- Select
Direct PUTas the input source andS3as the output. - Select the S3 bucket name we created.
Format is
s3://<your-bucket-name>
- Enable
New Line Delimiterand leave everything else as default settings. - Scroll down and click
Create Firehose Stream.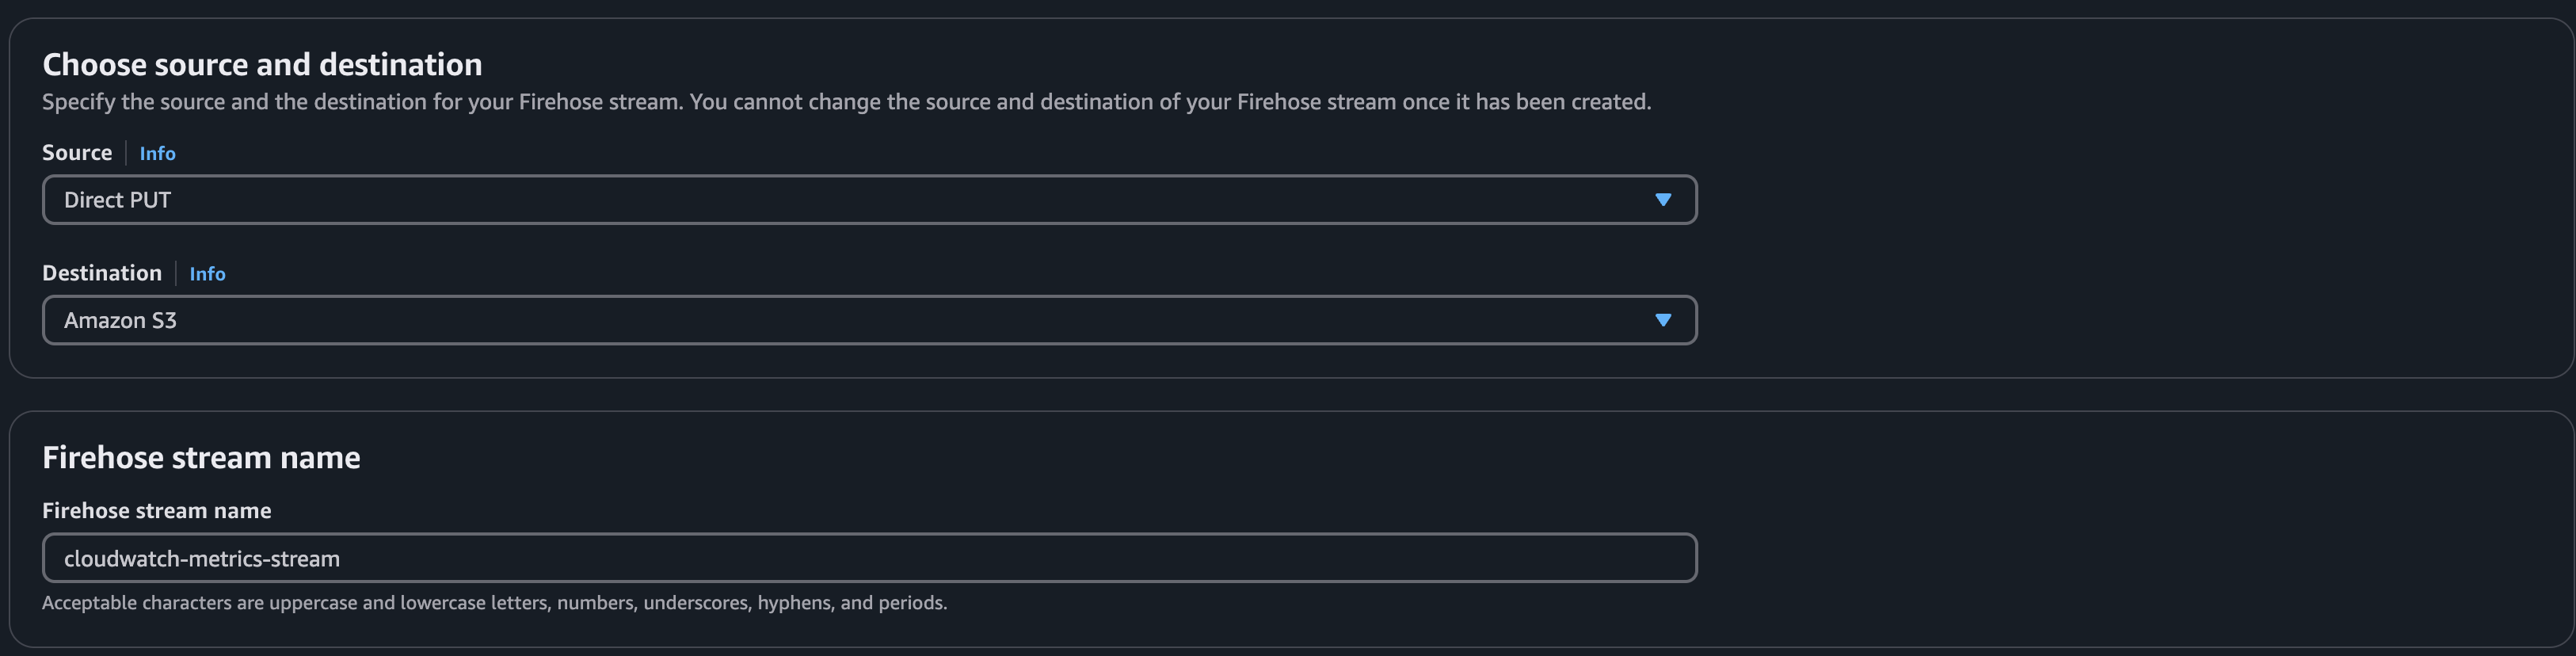
Step 3: Creating a Metric Stream pipeline
Now, we'll configure CloudWatch to use the Firehose stream to send metrics to S3.
1. Navigate to the CloudWatch dashboard and select Streams under Metrics
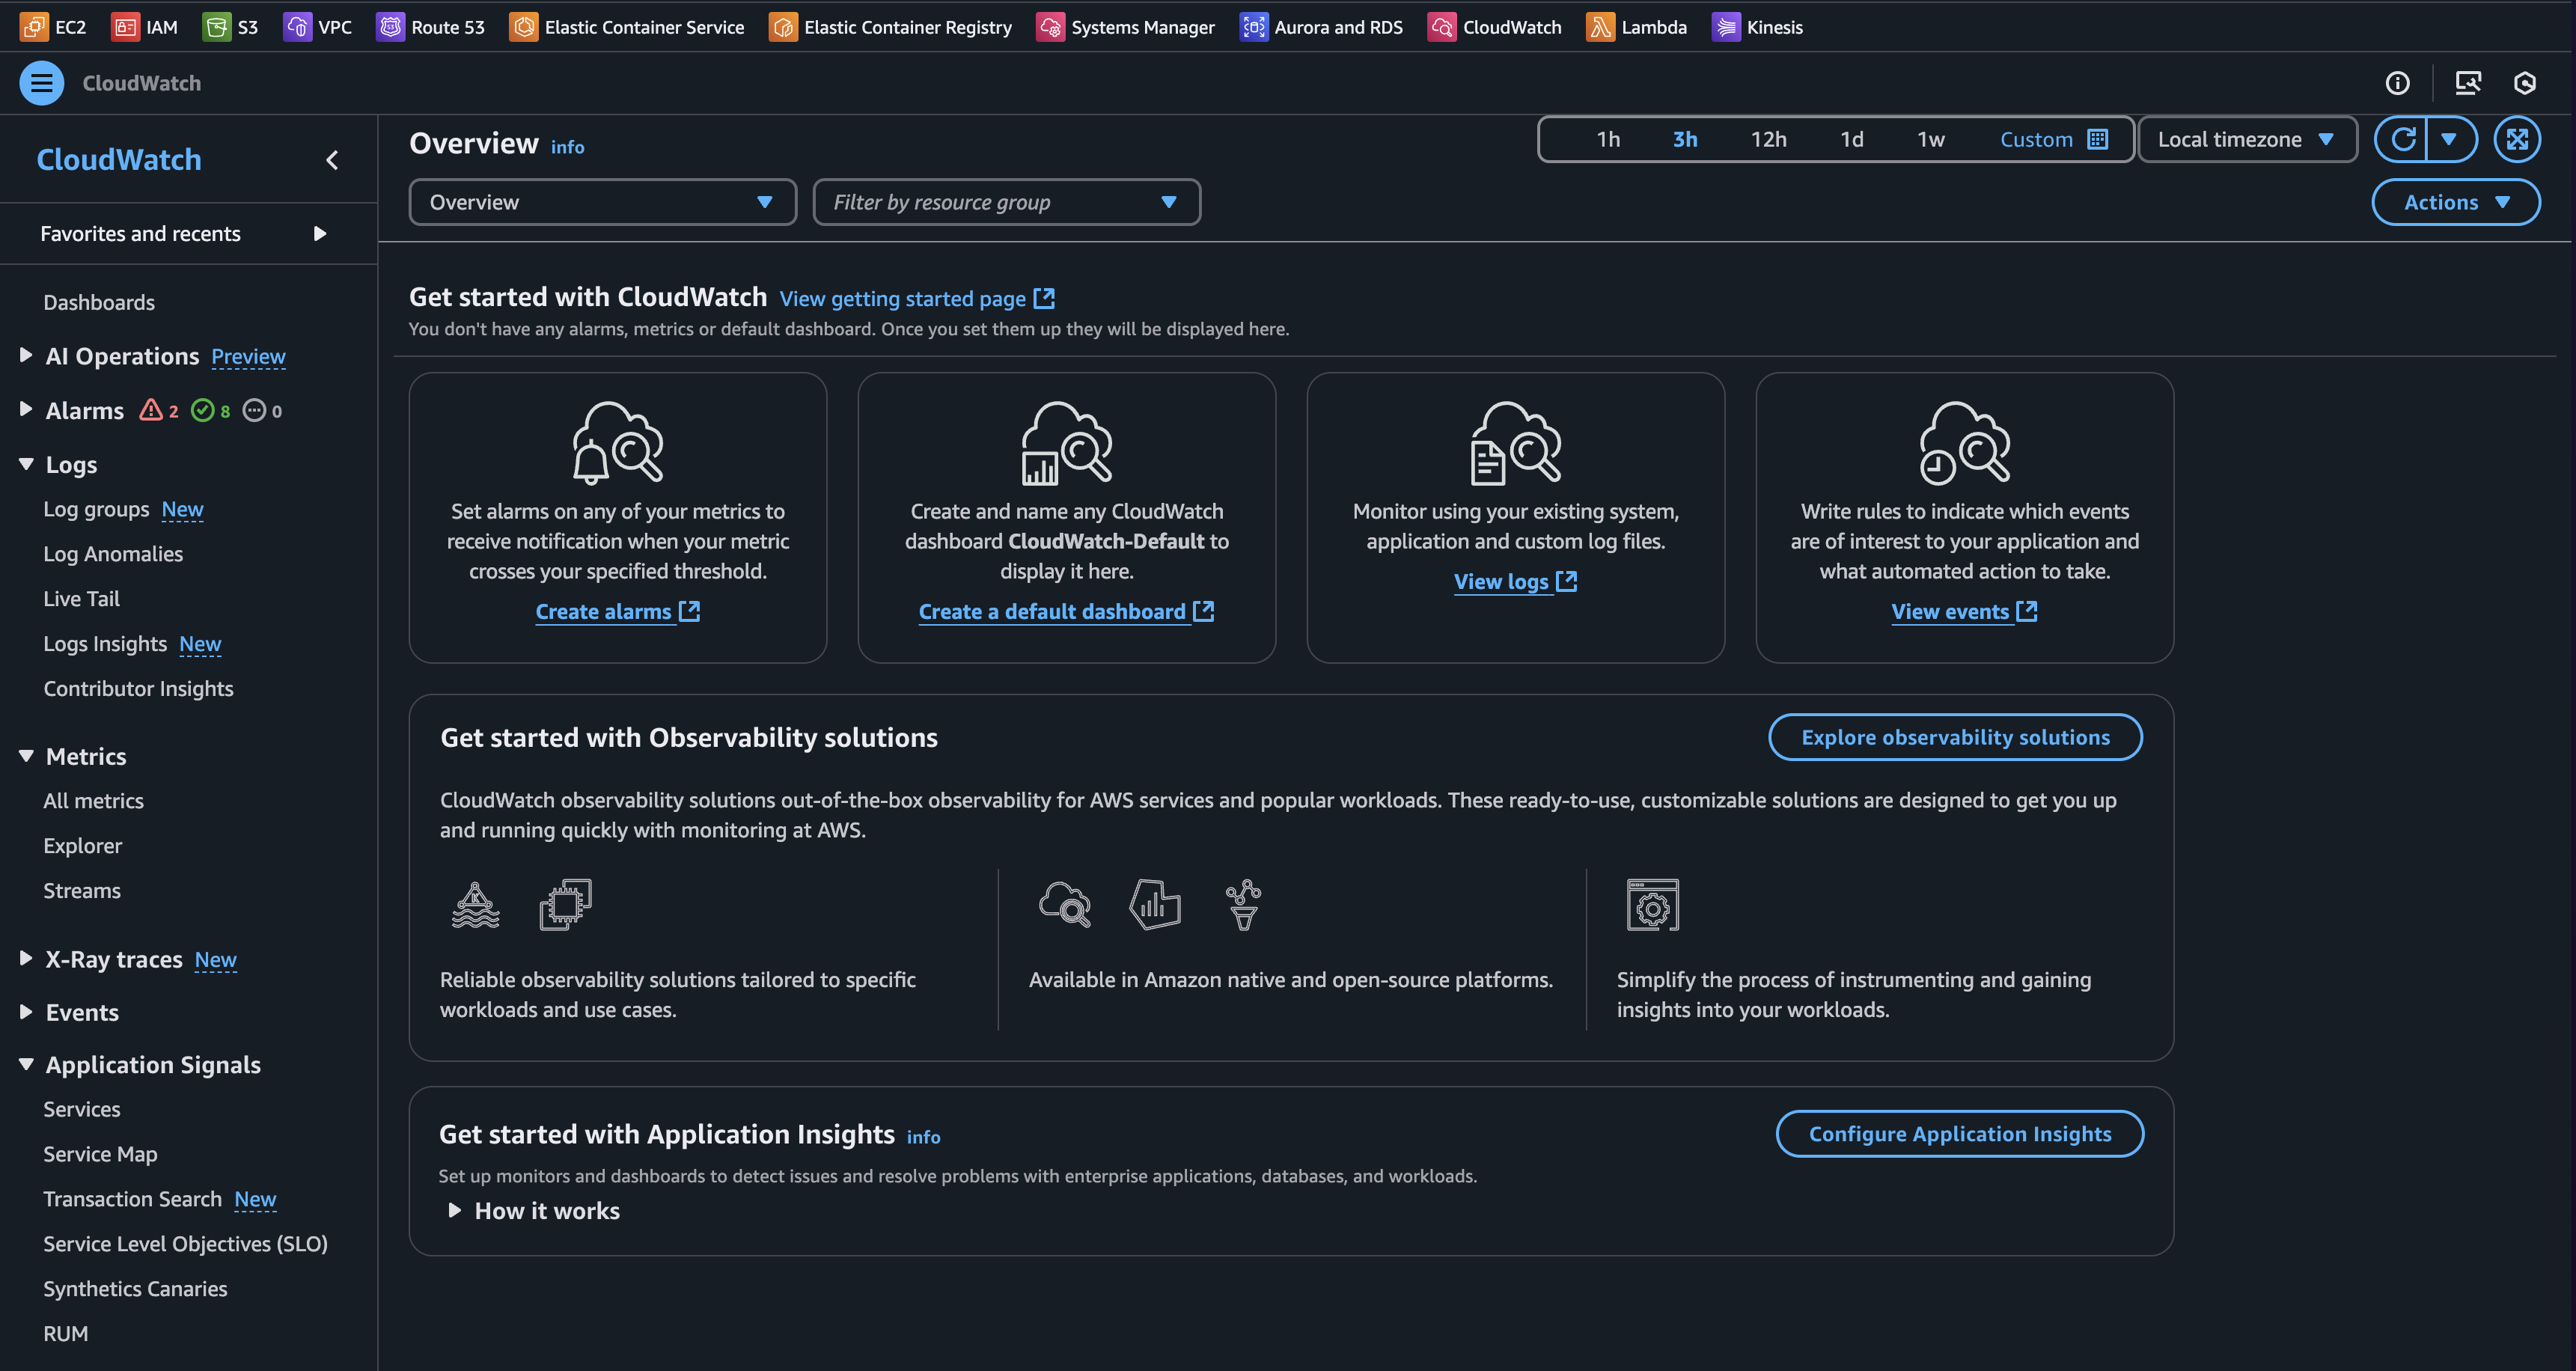
2. Click Create Metric Stream
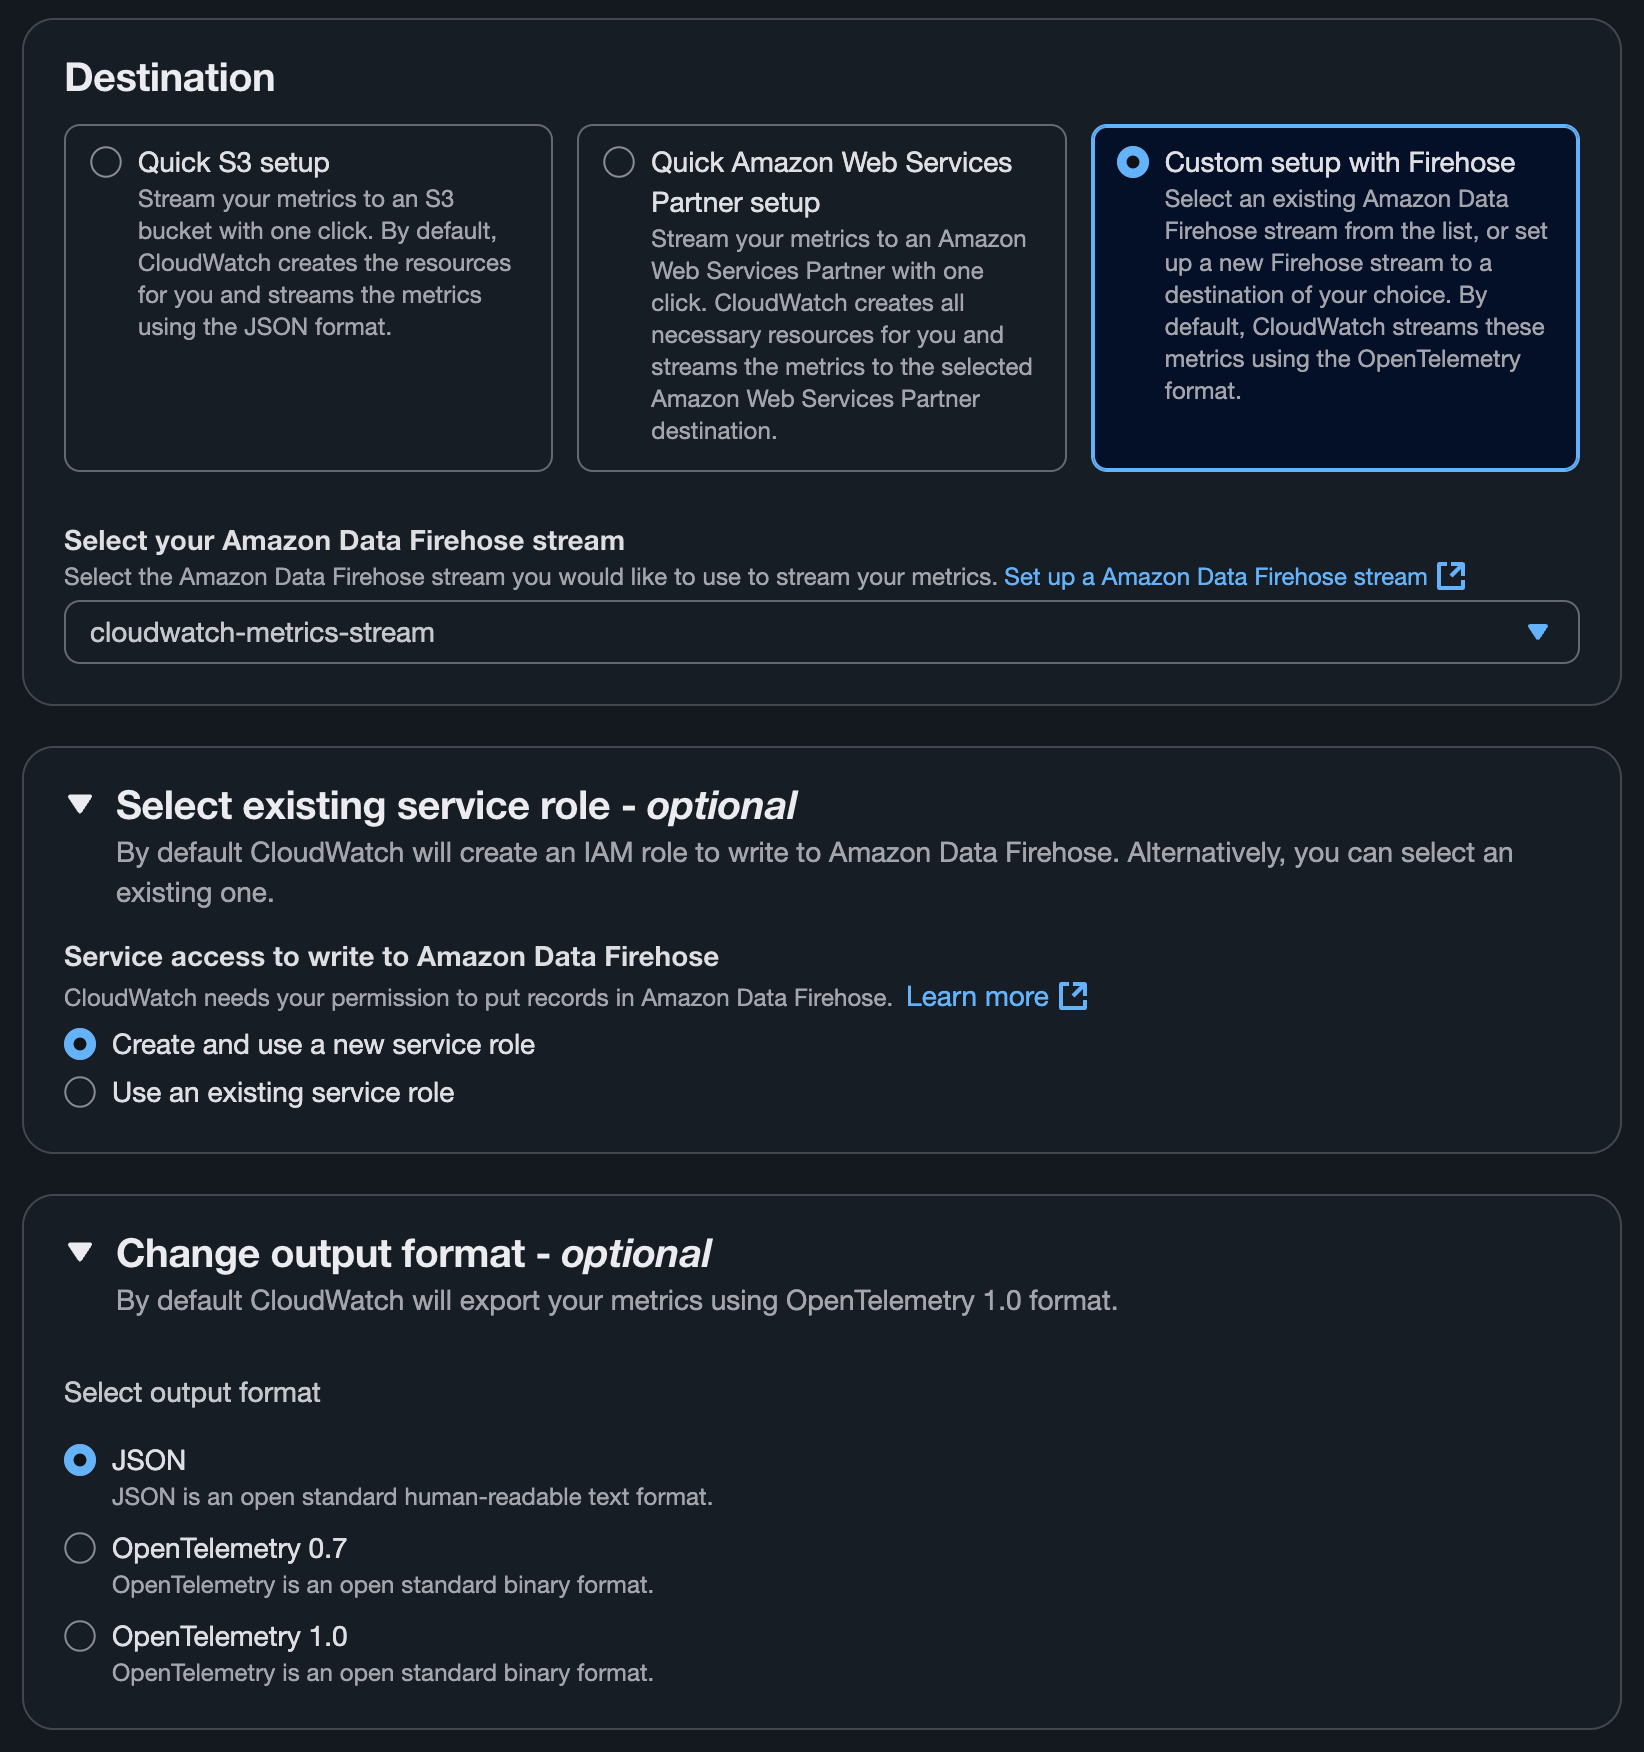
3. Configuring the stream
- Select
Custom Setup with Firehose. - Change the output format to
JSON. - Select the required metrics.
- Give the pipeline a name, then click
Create Metric Stream.
Firehose is now writing CloudWatch metric batches to the S3 bucket.
As you complete Steps 2 and 3 in the console, AWS creates two service roles
automatically: a Firehose role that can write to the destination S3 bucket
(s3:PutObject, s3:AbortMultipartUpload, s3:GetBucketLocation,
s3:ListBucket) and log delivery errors, and a CloudWatch Metric Stream role
that trusts streams.metrics.cloudwatch.amazonaws.com and can call
firehose:PutRecord and firehose:PutRecordBatch on the stream. If you
provision with Terraform or CloudFormation instead, create both roles
explicitly with those permissions. (The Lambda's own read role is configured
in Step 4.)
Step 4: Creating a Lambda function
Now, let's create a Lambda function to read from S3 and forward the metrics to base14 Scout.
1. Create a layer with all the necessary packages
mkdir python
# move into that directory
cd python

# install requests module
pip install --target . requests
# zip the contents under the name dependencies.zip
zip -r dependencies.zip ../python
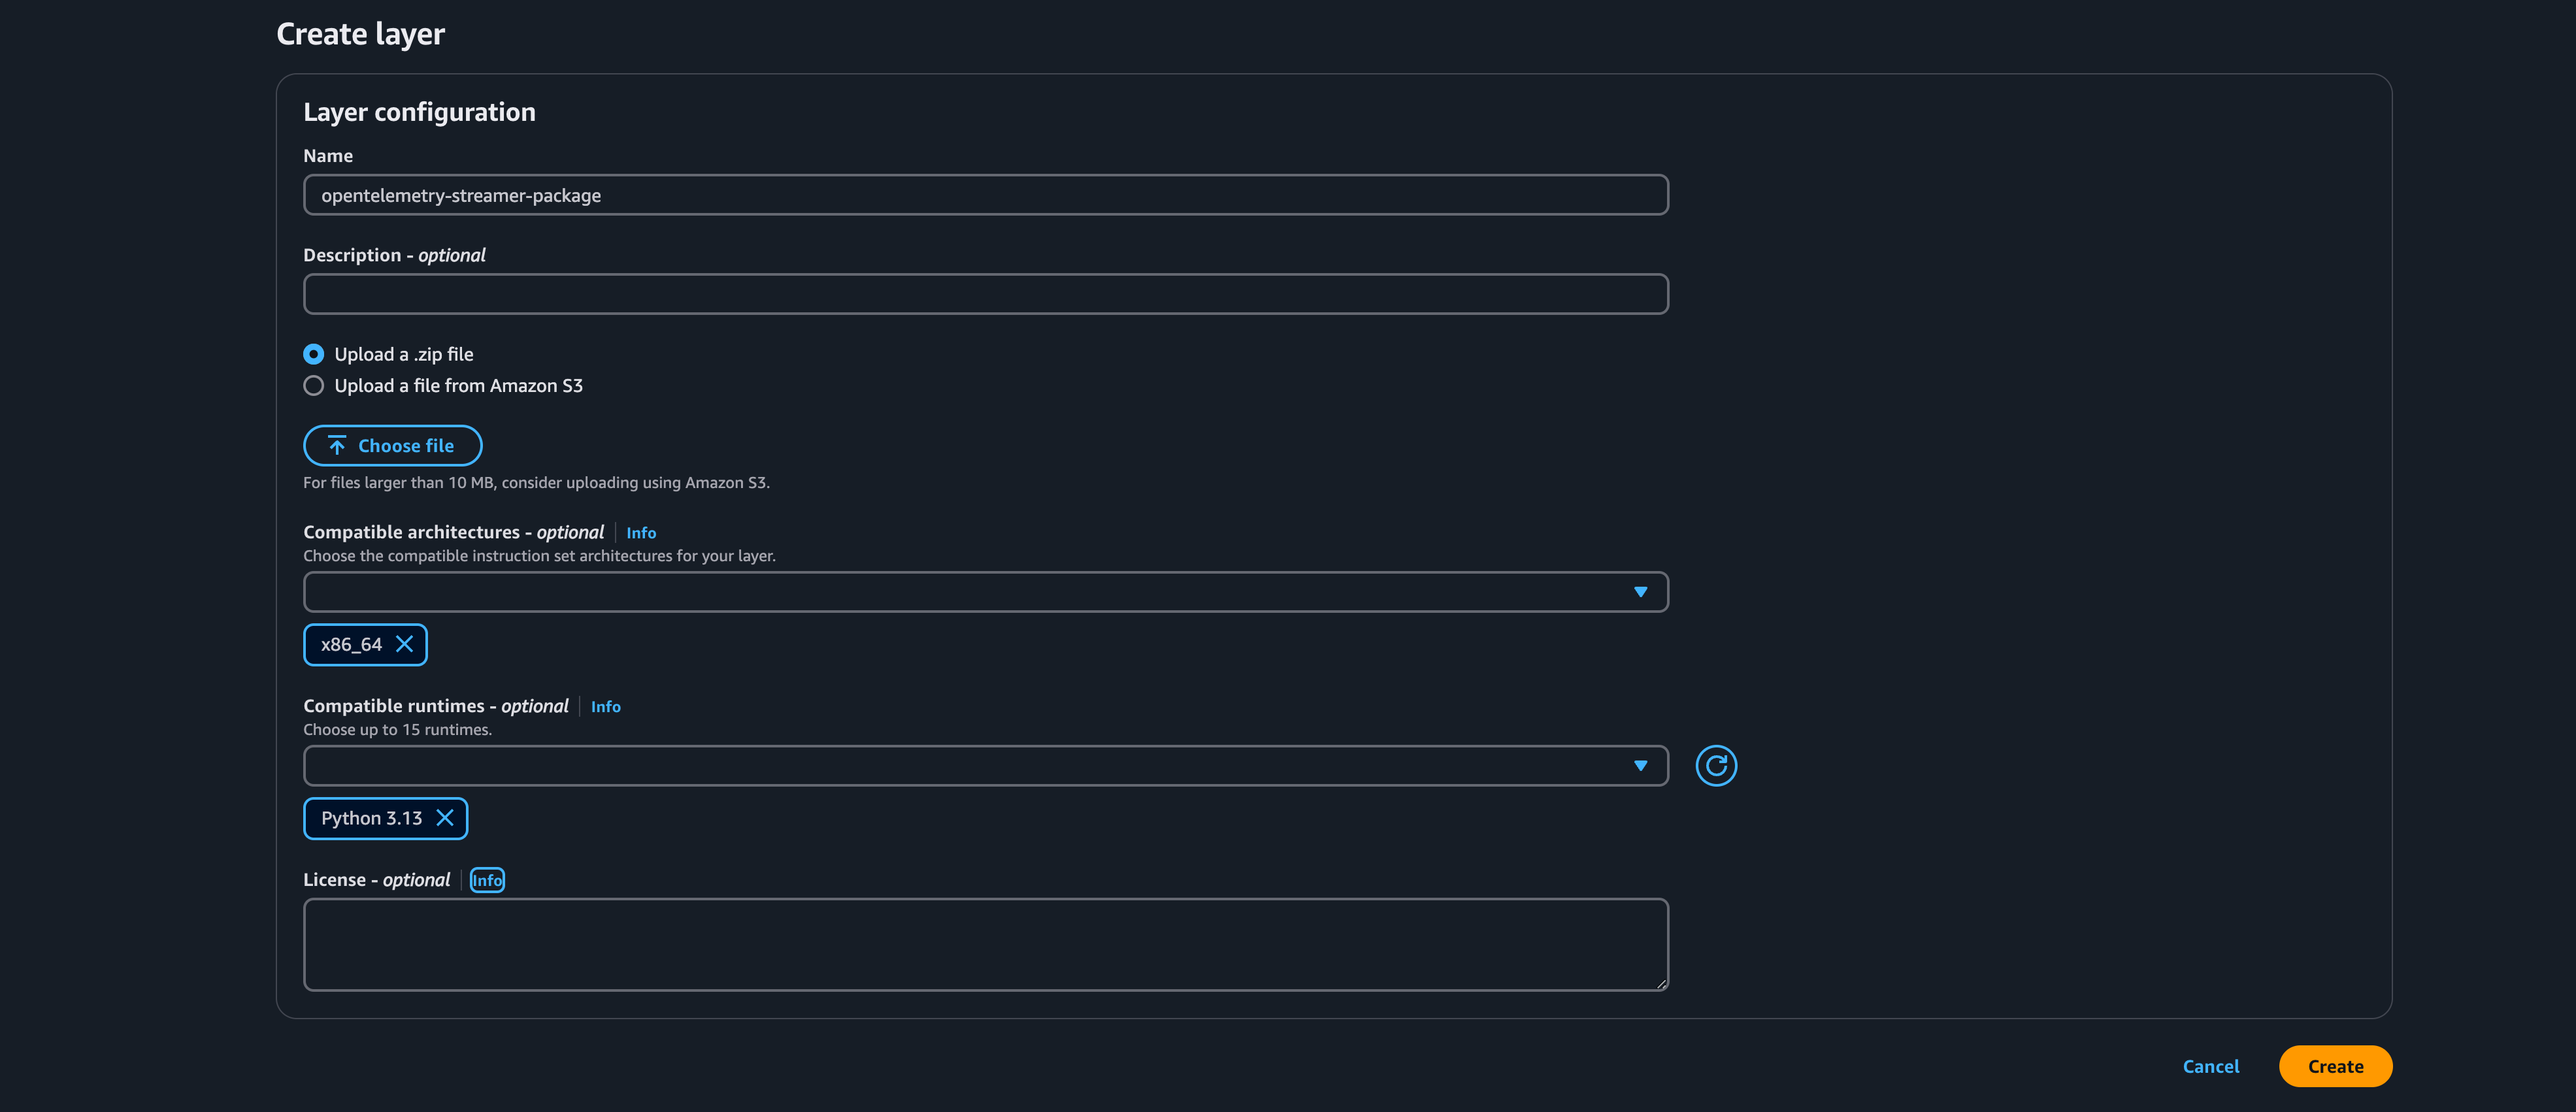
2. Navigate to the AWS Lambda dashboard and click Layers
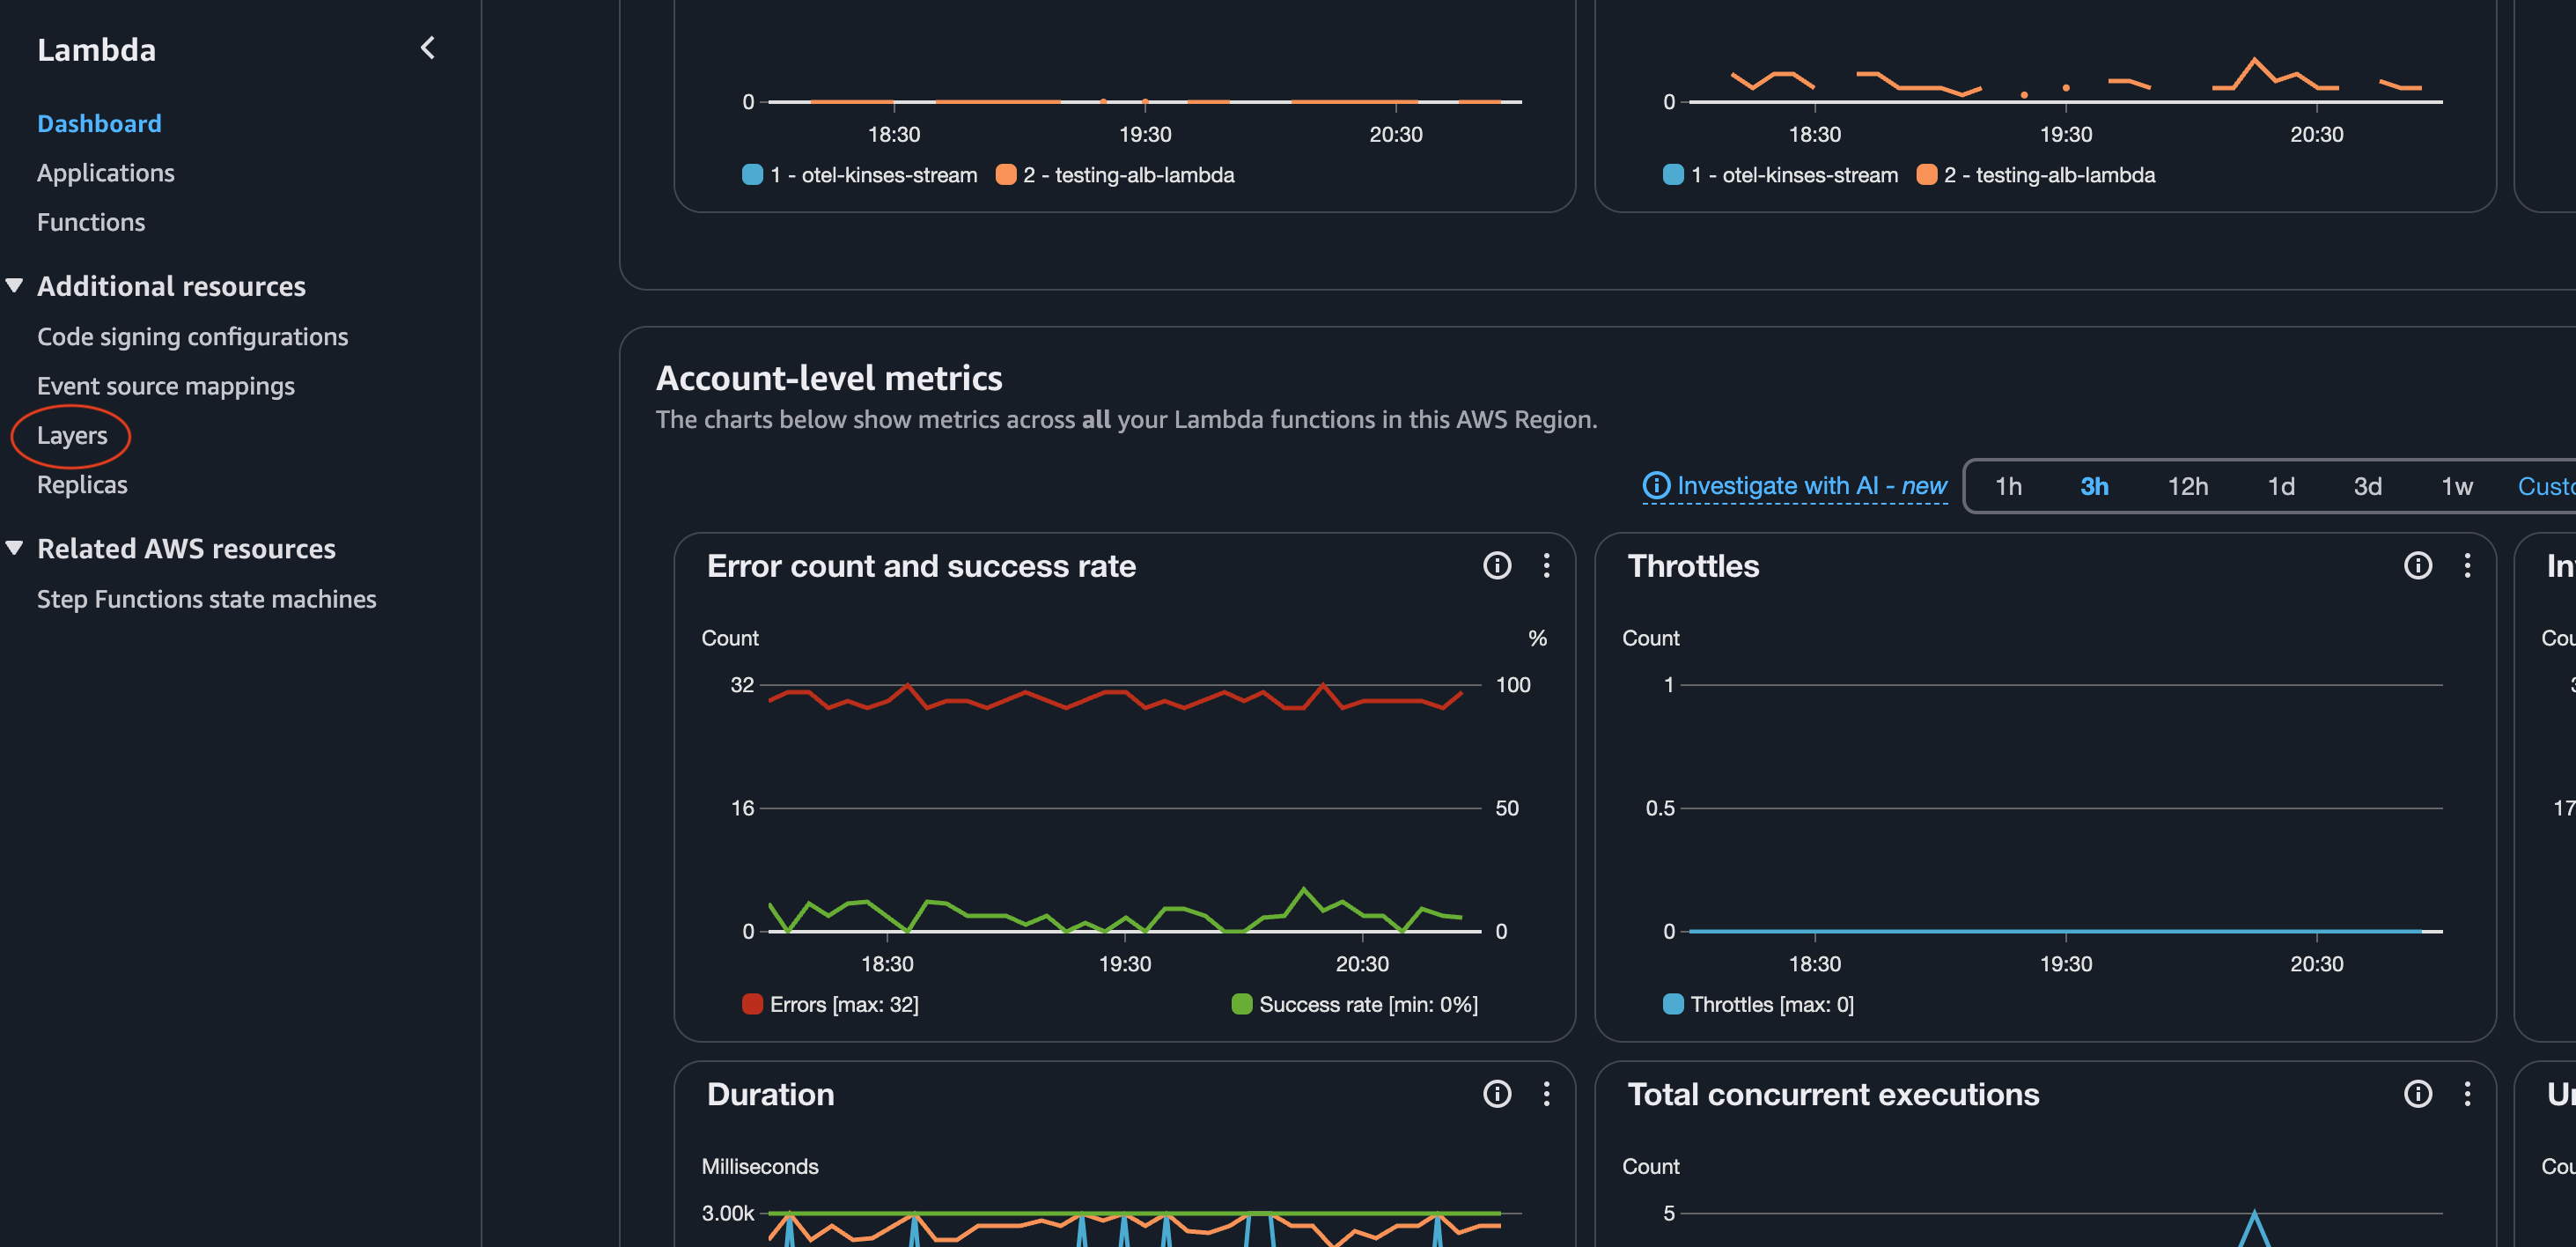
- Click
Create layer.
3. Fill in the necessary details and upload the zip file
4. Navigate to the Functions page and click Create function
- Select
Author from scratch. - Give a function name (e.g.,
cloudwatch-metrics-to-scout). - Choose
Python 3.12as the runtime. - Select
x86_64as the Architecture. - Click
Create function.
5. Configure the Lambda function
Once the function is created, follow the steps below to configure it.
Add S3 permissions
The Lambda execution role needs access to read objects from the S3 bucket where Firehose writes metrics.
- Click on the
Configurationtab and then click onPermissions. - Click on the Role name link to open the IAM role in a new tab.
- Click
Add permissionsthenCreate inline policy. - Switch to the
JSONtab and paste the following policy:
{
  "Version": "2012-10-17",
  "Statement": [
    {
      "Sid": "AllowListBucket",
      "Effect": "Allow",
      "Action": "s3:ListBucket",
      "Resource": "arn:aws:s3:::cloudwatch-metrics-stream-bucket"
    },
    {
      "Sid": "AllowGetObject",
      "Effect": "Allow",
      "Action": "s3:GetObject",
      "Resource": "arn:aws:s3:::cloudwatch-metrics-stream-bucket/*"
    }
  ]
}
Replace
cloudwatch-metrics-stream-bucketwith your actual bucket name if you chose a different name in Step 1.
- Click
Next, give the policy a name (e.g.,cloudwatch-stream-s3-read), and clickCreate policy.
Set the timeout
The default Lambda timeout of 3 seconds is too short for reading S3 objects and forwarding metrics over HTTP.
- In the
Configurationtab, click onGeneral configuration. - Click
Edit. - Set Timeout to
1 min 0 sec. - Click
Save.
Add the dependencies layer
- Click on
Codeand scroll down to the Layers section. - Click
Add a layer. - Select
Custom layersand choose the layer created in step 1. - Click
Add.
Add the S3 trigger
- Navigate back to the function overview and click
Add trigger. - Select
S3as the source. - Select the bucket (
cloudwatch-metrics-stream-bucket) from the dropdown. - Leave the event type as
All object create events. - Click
Add.
Set environment variables
The Lambda code reads four environment variables for authentication and endpoint configuration.
- In the
Configurationtab, click onEnvironment variables. - Click
Editand add the following variables:
| Key | Value |
|---|---|
CLIENT_ID | Your Scout OAuth client ID |
CLIENT_SECRET | Your Scout OAuth client secret |
TOKEN_URL | Your Scout token endpoint URL |
ENDPOINT_URL | Full Scout OTLP metrics URL (include /v1/metrics) |
- Click
Save.
ENDPOINT_URL is the exact URL the Lambda POSTs to. It does not append
/v1/metrics for you, so include the full path, for example
https://otel.play.b14.dev/<YOUR_TENANT>/otlp/v1/metrics.
Now, copy the code below into the Code source editor of your Lambda
function.
The requests below verify TLS certificates by default. Do not set
verify=False in production - it disables certificate validation and exposes
your credentials and metrics to interception. base14 Scout endpoints use
valid, publicly trusted certificates, so verification works out of the box.
import boto3
import requests
import os
import json
from collections import defaultdict

s3 = boto3.client('s3')
client_id = os.environ.get('CLIENT_ID')
client_secret = os.environ.get('CLIENT_SECRET')
token_url = os.environ.get('TOKEN_URL')
endpoint_url = os.environ.get('ENDPOINT_URL')

def parse_cloudwatch_json_file(buffer):
    """
    Parse CloudWatch Metrics Stream JSON file (newline-delimited JSON).
    Returns a list of metric dictionaries.
    """
    metrics = []
    content = buffer.decode('utf-8')

    for line in content.strip().split('\n'):
        line = line.strip()
        if not line:
            continue
        try:
            metric = json.loads(line)
            metrics.append(metric)
        except json.JSONDecodeError as e:
            print(f"Failed to parse JSON line: {e}")
            continue

    return metrics

def convert_to_otlp_json(metrics):
    """
    Convert CloudWatch metrics to OTLP JSON format.
    Groups metrics by account/region for efficient batching.
    Preserves attribute format: Namespace, MetricName, Dimensions (as JSON string)
    """
    grouped = defaultdict(list)
    for metric in metrics:
        key = (metric.get('account_id', ''), metric.get('region', ''))
        grouped[key].append(metric)

    resource_metrics = []

    for (account_id, region), account_metrics in grouped.items():
        # Resource attributes
        resource_attributes = [
            {"key": "cloud.provider", "value": {"stringValue": "aws"}},
            {"key": "cloud.account.id", "value": {"stringValue": account_id}},
            {"key": "cloud.region", "value": {"stringValue": region}},
            {"key": "service.name", "value": {"stringValue": "aws-cloudwatch-stream"}},
            {"key": "environment", "value": {"stringValue": "production"}},
        ]

        otlp_metrics = []
        for cw_metric in account_metrics:
            metric_name = cw_metric.get('metric_name', 'unknown')
            namespace = cw_metric.get('namespace', '')
            timestamp_ms = cw_metric.get('timestamp', 0)
            timestamp_ns = timestamp_ms * 1_000_000
            value = cw_metric.get('value', {})
            unit = cw_metric.get('unit', '')
            dimensions = cw_metric.get('dimensions', {})

            datapoint_attributes = [
                {"key": "Namespace", "value": {"stringValue": namespace}},
                {"key": "MetricName", "value": {"stringValue": metric_name}},
                {"key": "Dimensions", "value": {"stringValue": json.dumps(dimensions)}},
            ]

            otlp_metrics.append({
                "name": f"amazonaws.com/{namespace}/{metric_name}",
                "unit": unit if unit != "None" else "",
                "summary": {
                    "dataPoints": [{
                        "timeUnixNano": str(timestamp_ns),
                        "count": str(int(value.get('count', 0))),
                        "sum": value.get('sum', 0.0),
                        "quantileValues": [
                            {"quantile": 0.0, "value": value.get('min', 0.0)},
                            {"quantile": 1.0, "value": value.get('max', 0.0)}
                        ],
                        "attributes": datapoint_attributes
                    }]
                }
            })

        resource_metrics.append({
            "resource": {"attributes": resource_attributes},
            "scopeMetrics": [{
                "scope": {"name": "aws.cloudwatch", "version": "1.0.0"},
                "metrics": otlp_metrics
            }]
        })

    return {"resourceMetrics": resource_metrics}


def lambda_handler(event, context):
    for record in event['Records']:
        bucket_name = record['s3']['bucket']['name']
        file_key = record['s3']['object']['key']
        print(f"Processing file: {file_key}")

        file_obj = s3.get_object(Bucket=bucket_name, Key=file_key)
        buffer = file_obj['Body'].read()

        try:
            metrics = parse_cloudwatch_json_file(buffer)
            print(f"Parsed {len(metrics)} metrics from file")
        except Exception as e:
            print(f"Error parsing file: {e}")
            raise

        if not metrics:
            print("No metrics found in file")
            continue

        try:
            otlp_payload = convert_to_otlp_json(metrics)
            print(f"Converted to OTLP format with {len(otlp_payload['resourceMetrics'])} resource groups")
        except Exception as e:
            print(f"Error converting to OTLP: {e}")
            raise

        try:
            token_response = requests.post(
                token_url,
                data={
                    "grant_type": "client_credentials",
                    "audience": "b14collector",
                },
                auth=(client_id, client_secret),
            )
            token_response.raise_for_status()
            access_token = token_response.json()["access_token"]
        except Exception as e:
            print(f"Failed to get auth token: {e}")
            raise

        headers = {
            "Content-Type": "application/json",
            "Authorization": f"Bearer {access_token}"
        }

        try:
            response = requests.post(
                endpoint_url,
                json=otlp_payload,
                headers=headers,
            )

            if response.status_code == 200:
                print(f"Successfully forwarded {len(metrics)} metrics to OTLP endpoint")
            else:
                print(f"Failed to send metrics. Status: {response.status_code}, Response: {response.text}")

        except Exception as e:
            print(f"Error sending to endpoint: {e}")
            raise

    return {
        'statusCode': 200,
        'body': f'Processed {len(event["Records"])} files'
    }
- Click
Deploy.
Verify the setup
Confirm metrics are flowing at each hop:
- Firehose: open your stream in the Firehose console, check
Monitoring, and confirm
DeliveryToS3.Successis non-zero. - S3: the bucket should show new objects accumulating under the prefix.
- Lambda: check the function's logs for successful forwards and no 4xx or 5xx responses from the OTLP endpoint.
- Scout: query a known metric such as
amazonaws.com/AWS/EC2/CPUUtilization. Allow three to five minutes for the full path from stream through S3 and Lambda to reach Scout.
FAQ
What is CloudWatch Metrics Stream and how does it work with base14 Scout?
Amazon CloudWatch Metric Streams push metrics continuously through Amazon Data Firehose. In this setup Firehose writes batches to S3, an S3-triggered Lambda converts each batch to OTLP and forwards it to base14 Scout. End-to-end latency is typically three to five minutes, faster than polling the CloudWatch APIs.
How do I set up CloudWatch Metrics Stream for base14 Scout?
Create an S3 bucket, set up an Amazon Data Firehose stream with Direct PUT as input and S3 as output, configure a CloudWatch Metric Stream to send metrics through Firehose, then add a Lambda that converts the S3 objects to OTLP and forwards them to base14 Scout.
Is CloudWatch Metrics Stream faster than polling CloudWatch APIs?
Yes. Metric Streams deliver to Firehose in two to three minutes. With the S3 and Lambda forwarding hop, end-to-end delivery to Scout is typically three to five minutes, still faster than the five or more minutes typical of API polling.
Can I filter which AWS metrics are streamed via CloudWatch Metrics Stream?
Yes. When creating the Metric Stream you can select specific namespaces such as AWS/EC2 or AWS/RDS instead of all namespaces, which reduces cost and data volume.
What AWS infrastructure do I need for CloudWatch Metrics Stream?
You need an S3 bucket, an Amazon Data Firehose stream configured with Direct PUT, a CloudWatch Metric Stream that routes metrics through Firehose to S3, and a Lambda function that forwards the metrics to base14 Scout over OTLP.
Related Guides
- AWS CloudWatch Overview - Compare all four approaches to get CloudWatch metrics into Scout.
- Firehose to the OTel Collector - The
same stream without S3 or Lambda, using the
awsfirehosereceiver. - Prometheus CloudWatch exporter - The pull alternative.
- Application Load Balancer Monitoring - Monitor AWS ALB with CloudWatch Metrics Stream.
- RDS Monitoring - Monitor AWS RDS databases.
- ElastiCache Monitoring - Monitor Redis and Memcached.
- Scout Exporter Configuration - Configure authentication and endpoints.