PostgreSQL Resource Usage
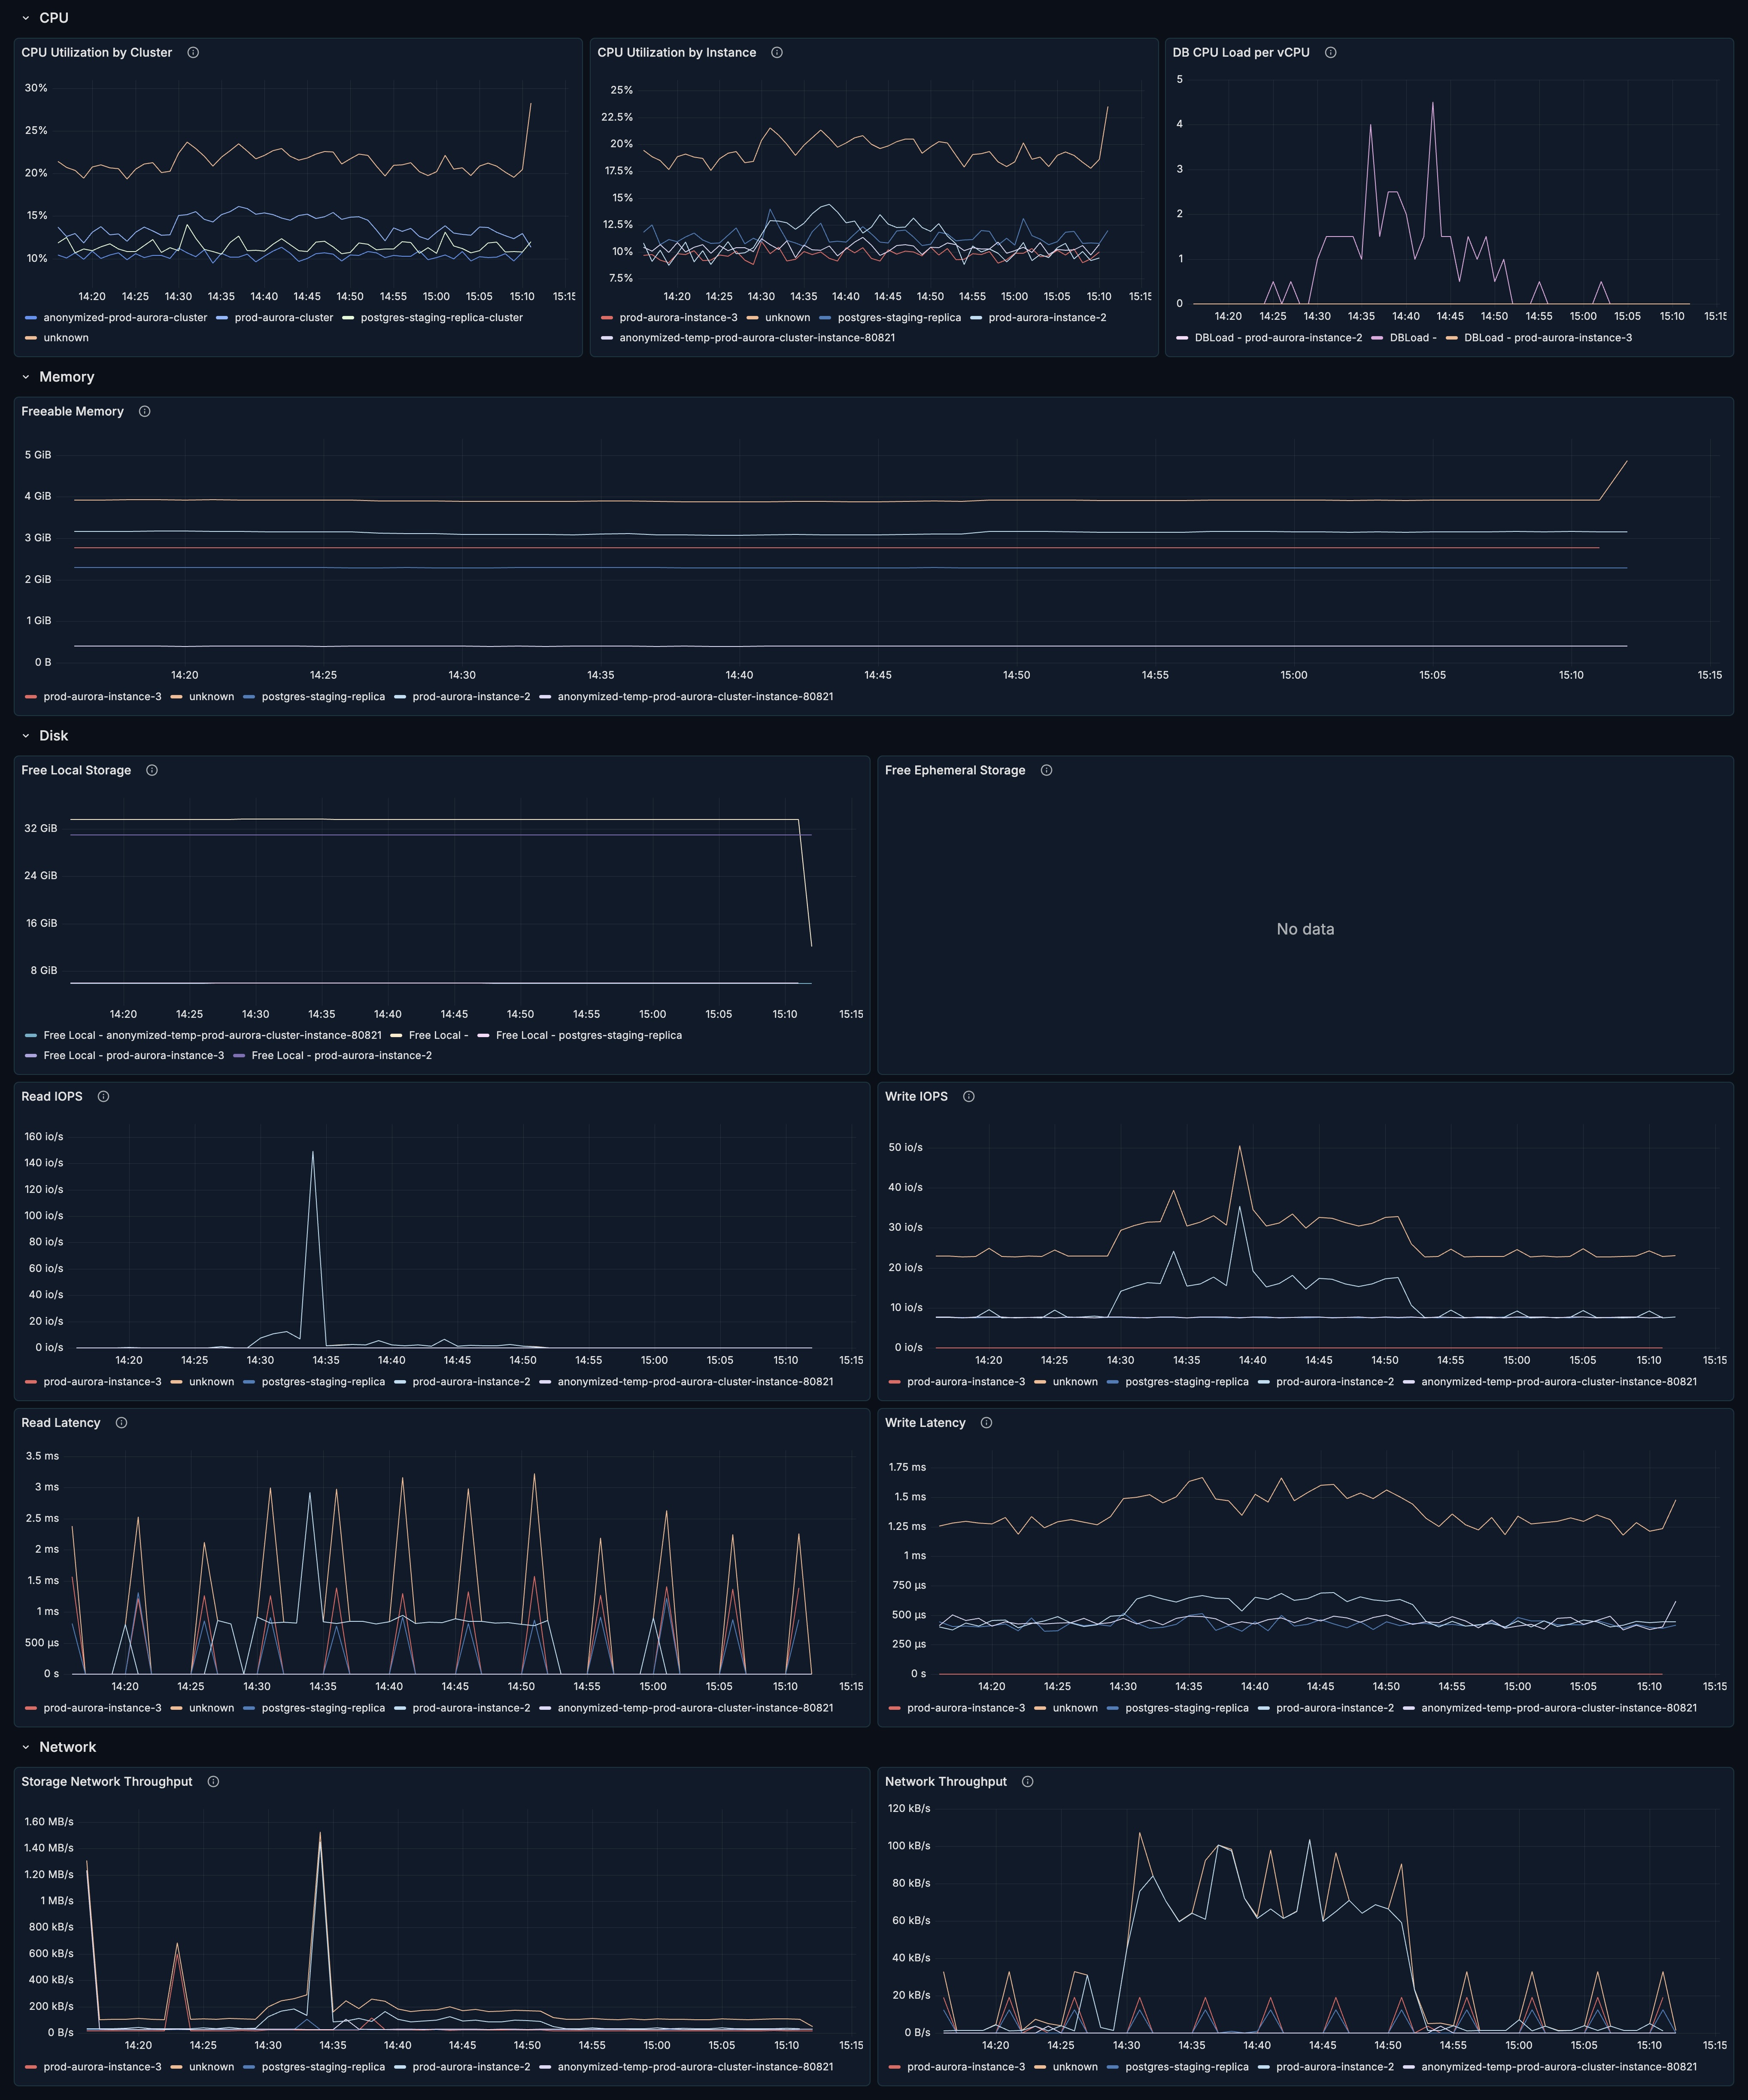
The Resources tab provides visibility into cloud infrastructure metrics for your PostgreSQL deployment. Currently, this tab supports AWS RDS metrics via CloudWatch integration.
Note: This tab is only available when the deployment type is set to "RDS" in configuration.
pgX is the PostgreSQL monitoring app in base14 Scout. Check out base14 pgX.
Sections
The Resources tab is organized into four sections:
- CPU - CPU utilization and load metrics
- Memory - Available memory tracking
- Disk - Storage and I/O metrics
- Network - Throughput monitoring
CPU Section
The CPU section provides insight into processor utilization across your RDS cluster.

CPU Utilization by Cluster
What it shows: Aggregate CPU utilization across all instances in the cluster.
Healthy range: < 70% for sustained workloads.
When to investigate:
- Sustained > 70% - consider scaling up
- Spikes to 100% - identify resource-intensive queries
- Sudden changes - correlate with application behavior
CPU Utilization by Instance
What it shows: CPU utilization per database instance.
How to use it:
- Identify hot instances
- Compare primary vs replica load
- Detect uneven load distribution
Healthy pattern:
- Primary slightly higher than replicas
- Even distribution across read replicas
- Predictable patterns matching traffic
DB CPU Load per vCPU
What it shows: Database load normalized per vCPU.
Interpretation:
| Value | Meaning |
|---|---|
| < 1.0 | CPU has capacity |
| = 1.0 | CPU fully utilized |
| > 1.0 | Queries waiting for CPU |
When to investigate:
- Load > 1.0 - CPU bottleneck
- Growing trend - scaling needed
- Spikes - resource-intensive queries
Memory Section
The Memory section tracks available memory on your RDS instances. This section is collapsed by default - click to expand.

Freeable Memory
What it shows: Amount of RAM available on the instance.
Healthy range: > 20% of total instance memory.
When to investigate:
- Dropping below 20% of total
- Consistent decline over time
- Correlation with slow queries
Low memory causes:
shared_bufferstoo largework_memtoo large for concurrent queries- Memory leaks in extensions
- Too many connections
Optimization tips:
- Review PostgreSQL memory settings
- Consider instance upgrade
- Optimize connection pooling
- Check for memory-intensive queries
Disk Section
The Disk section monitors storage capacity and I/O performance. This section is collapsed by default - click to expand.

Free Local Storage
What it shows: Available local SSD storage.
Usage:
- Temporary files
- Sort operations
- Hash operations
When to investigate:
- Running low on space
- Rapid consumption during queries
- Correlation with slow queries
Free Ephemeral Storage
What it shows: Available ephemeral storage.
Note: Not all instance types have ephemeral storage.
Read IOPS
What it shows: Read I/O operations per second.
What affects it:
- Query volume
- Buffer cache misses
- Table scan operations
- Index usage patterns
When to investigate:
- Approaching provisioned IOPS limit
- Sudden spikes
- Sustained high levels
Write IOPS
What it shows: Write I/O operations per second.
What affects it:
- Transaction volume
- WAL writes
- Checkpoint activity
- Background writer
When to investigate:
- Approaching provisioned IOPS limit
- Spikes during maintenance
- Correlation with lag
Read Latency
What it shows: Average time for read operations.
Healthy range: < 10ms for most workloads.
When to investigate:
- Latency > 20ms
- Increasing trend
- Correlation with query slowness
High latency causes:
- IOPS throttling
- Storage system issues
- Network congestion
Write Latency
What it shows: Average time for write operations.
Healthy range: < 10ms for most workloads.
When to investigate:
- Latency > 20ms
- Increasing trend
- Correlation with transaction slowness
Network Section
The Network section monitors data transfer metrics. This section is collapsed by default - click to expand.

Storage Network Throughput
What it shows: Data transfer rate to/from storage.
What affects it:
- Query data volume
- Backup operations
- Large data transfers
When to investigate:
- Approaching network limits
- Correlation with performance issues
- Unexpected spikes
Network Throughput
What it shows: Overall network data transfer rate.
What affects it:
- Client traffic
- Replication traffic
- Application data transfer
When to investigate:
- Bandwidth saturation
- Unexpected traffic patterns
- Correlation with timeouts
Use Cases
Performance Troubleshooting
When experiencing slow queries:
- Check CPU Utilization - is CPU a bottleneck?
- Review DB CPU Load per vCPU - load > 1.0 indicates CPU queueing
- Check Read/Write IOPS - are you hitting IOPS limits?
- Review Read/Write Latency - is storage slow?
- Check Freeable Memory - is memory pressure causing issues?
Capacity Planning
For scaling decisions:
- Track CPU Utilization trends over time
- Monitor DB CPU Load per vCPU for headroom
- Review IOPS consumption vs provisioned
- Check Freeable Memory trends
- Analyze Network Throughput for bandwidth needs
Scaling indicators:
- Sustained CPU > 70%
- DB Load > 0.7 consistently
- IOPS > 80% of provisioned
- Memory < 20% available
- Latency increasing trend
Instance Right-Sizing
To optimize costs:
- Review CPU Utilization - consistently low may indicate over-provisioning
- Check Freeable Memory - excess memory is wasted cost
- Analyze IOPS patterns - may allow reduced provisioning
- Consider workload patterns - can you use smaller instances off-peak?
Monitoring During Maintenance
During maintenance windows:
- Watch Write IOPS during vacuums
- Monitor CPU during REINDEX
- Track Freeable Memory during bulk operations
- Check Latency for impact on operations
AWS RDS Metrics Reference
The Resources section uses CloudWatch metrics:
| Panel | CloudWatch Metric |
|---|---|
| CPU Utilization (Cluster) | CPUUtilization (aggregated) |
| CPU Utilization (Instance) | CPUUtilization (per instance) |
| DB CPU Load | DBLoadCPU |
| Freeable Memory | FreeableMemory |
| Free Local Storage | FreeLocalStorage |
| Free Ephemeral Storage | FreeEphemeralStorage |
| Read IOPS | ReadIOPS |
| Write IOPS | WriteIOPS |
| Read Latency | ReadLatency |
| Write Latency | WriteLatency |
| Storage Throughput | StorageNetworkThroughput |
| Network Throughput | NetworkThroughput |
Configuration
To enable the Resources section:
- Set Deployment Type to "rds" in pgX configuration
- Configure CloudWatch metrics collection
- Set RDS Service Name and Metrics Prefix
See Configuration Reference for details.
Related Guides
- Performance - Query performance analysis
- Connections - Connection pool management
- Configuration Reference - RDS configuration options