PostgreSQL Locks & Waits
The Locks & Waits tab provides visibility into PostgreSQL concurrency behavior. Use it to identify lock contention, detect deadlocks, analyze blocking sessions, and troubleshoot wait events.
pgX is the PostgreSQL monitoring app in base14 Scout. Check out base14 pgX.
Sections
The Locks & Waits tab is organized into four sections:
- Concurrency Overview - Lock types and deadlock monitoring
- Locks Grid - Detailed view of all locks
- Blocking Analysis - Blocking chains and impact assessment
- Wait Event Analysis - PostgreSQL wait event distribution
Concurrency Overview Section
The Concurrency Overview section provides immediate visibility into lock activity.
Lock Count by Type
A pie chart showing the distribution of lock types.
Lock types:
| Type | Description |
|---|---|
| relation | Table-level locks |
| tuple | Row-level locks |
| transactionid | Transaction ID locks |
| virtualxid | Virtual transaction ID locks |
| object | Database object locks |
| userlock | User-defined advisory locks |
| advisory | Advisory locks |
Healthy pattern:
- Mostly relation and transactionid locks
- Few tuple locks (row-level contention)
- Advisory locks if using application locking
When to investigate:
- High tuple lock count - row contention
- Growing lock counts - possible lock escalation
- Unexpected lock types - review application behavior
Lock Wait Queue Depth
What it shows: Number of sessions waiting for locks over time.
Healthy range: Near zero for most workloads.
When to investigate:
- Queue depth > 0 sustained
- Growing trend
- Spikes correlating with slowness
High queue causes:
- Long-running transactions
- Lock contention on hot rows
- Missing indexes causing table locks
Deadlock Frequency
What it shows: Number of deadlocks over time.
Healthy range: Zero.
When to investigate:
- Any deadlocks occurring
- Recurring patterns
- Increasing frequency
Deadlock causes:
- Circular lock dependencies
- Inconsistent lock ordering
- Long transactions increasing collision probability
Locks Grid Section
The Locks Grid shows detailed information about all current locks. This section is collapsed by default - click to expand.
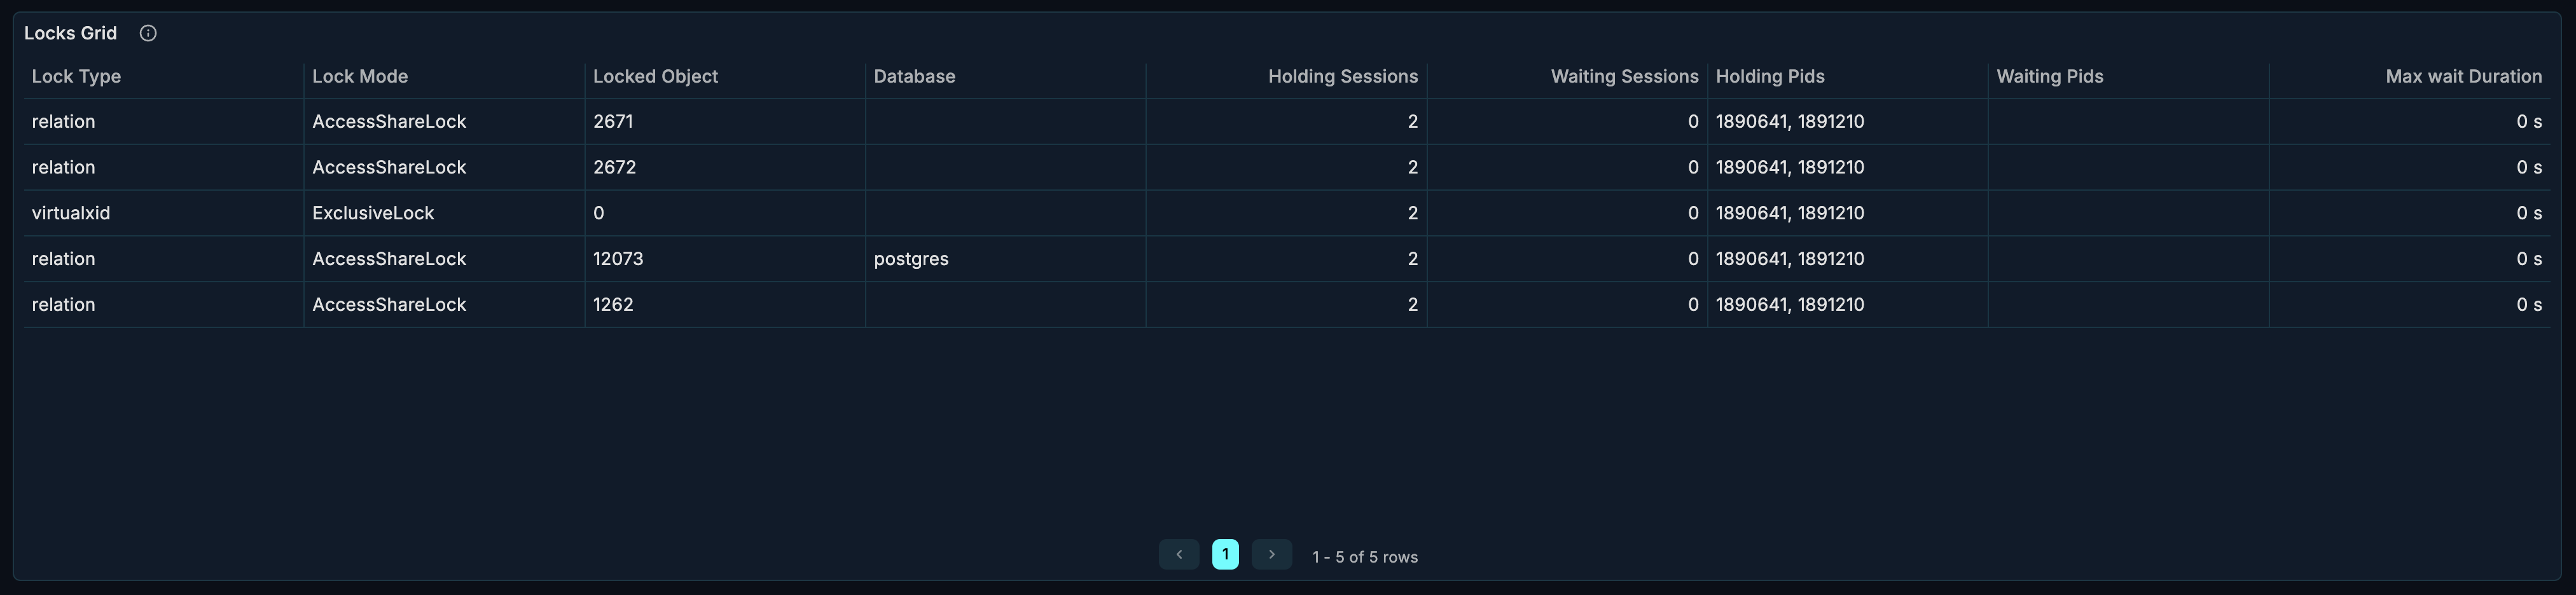
Table Columns
| Column | Description |
|---|---|
| PID | Backend process ID |
| Database | Database name |
| Lock Type | Type of lock held/requested |
| Mode | Lock mode (AccessShare, RowExclusive, etc.) |
| Granted | Whether lock is held (true) or waiting (false) |
| Relation | Table or object being locked |
| Wait Start | When waiting began |
Lock Modes
| Mode | Description | Conflicts With |
|---|---|---|
| AccessShareLock | SELECT | AccessExclusiveLock |
| RowShareLock | SELECT FOR UPDATE | Exclusive, AccessExclusive |
| RowExclusiveLock | UPDATE, DELETE, INSERT | Share, ShareRowExclusive, Exclusive, AccessExclusive |
| ShareUpdateExclusiveLock | VACUUM, ANALYZE | ShareUpdateExclusive, Share, ShareRowExclusive, Exclusive, AccessExclusive |
| ShareLock | CREATE INDEX | RowExclusive, ShareUpdateExclusive, ShareRowExclusive, Exclusive, AccessExclusive |
| ShareRowExclusiveLock | Rarely used | RowExclusive, ShareUpdateExclusive, Share, ShareRowExclusive, Exclusive, AccessExclusive |
| ExclusiveLock | Blocks reads/writes | All except AccessShare |
| AccessExclusiveLock | ALTER TABLE, DROP | All |
How to Use
Find blocked sessions:
- Filter for Granted = false
- These sessions are waiting for locks
Identify blockers:
- Find locks on same relation
- Match PIDs with Granted = true
Track wait duration:
- Check Wait Start timestamp
- Long waits indicate serious contention
Blocking Analysis Section
The Blocking Analysis section helps identify blocking chains and their impact. This section is collapsed by default - click to expand.
Blocking Sessions Node Graph
A visual representation of which sessions are blocking others.
What it shows:
- Blocking session → Blocked session relationships
- Chain of blocked processes
- Root blocker identification
How to use it:
- Identify the root cause of blocking
- See cascade effects of blocking
- Prioritize which session to address
Lock Escalation Pattern
What it shows: Lock escalation behavior over time.
Lock escalation:
- Row locks promoted to table locks
- Can cause widespread blocking
- Often indicates suboptimal queries
When to investigate:
- Frequent escalations
- Correlation with blocking
- After query changes
Impact Assessment
What it shows: Business impact of current blocking.
Metrics:
- Number of blocked sessions
- Total wait time
- Affected queries/operations
How to use it:
- Prioritize intervention
- Quantify blocking impact
- Track improvement
Advisory Locks
What it shows: Application-level advisory locks.
Advisory lock types:
- Session-level (released at session end)
- Transaction-level (released at transaction end)
When to investigate:
- Application using advisory locks
- Unexpected lock counts
- Locks not being released
Wait Event Analysis Section
The Wait Event Analysis section shows where PostgreSQL is spending time waiting. This section is collapsed by default - click to expand.
Wait Event Distribution
What it shows: Distribution of wait events by type.
Wait event types:
| Type | Description |
|---|---|
| Client | Waiting for client (ClientRead, ClientWrite) |
| Lock | Waiting for heavyweight locks |
| LWLock | Waiting for lightweight locks |
| BufferPin | Waiting for buffer pin |
| IO | Waiting for I/O |
| Activity | Background worker activity |
| Extension | Extension-related waits |
Healthy pattern:
- Mostly Client waits (waiting for queries)
- Low Lock waits
- Minimal IO waits
IO Wait Analysis
What it shows: I/O-related wait events.
IO wait types:
- DataFileRead - Reading data files
- DataFileWrite - Writing data files
- WALWrite - Writing WAL
- WALSync - Syncing WAL
When to investigate:
- High DataFileRead - buffer cache misses
- High WALWrite - heavy write workload
- Any sustained IO waits - storage bottleneck
LWLock Analysis
What it shows: Lightweight lock wait events.
Common LWLocks:
- buffer_content - Buffer access
- WALInsert - WAL insertion
- lock_manager - Lock management
- proc - Process management
When to investigate:
- High buffer_content - buffer contention
- High WALInsert - WAL write contention
- Unusual patterns - configuration issues
Use Cases
Diagnosing Lock Contention
When experiencing slow transactions:
- Check Lock Wait Queue Depth for queueing
- Review Lock Count by Type for lock patterns
- Expand Locks Grid to see specific locks
- Use Blocking Sessions Graph to find blockers
- Check Impact Assessment for severity
Investigating Deadlocks
When deadlocks are occurring:
- Monitor Deadlock Frequency for patterns
- Enable
log_lock_waitsanddeadlock_timeout - Review PostgreSQL logs for deadlock details
- Analyze query patterns causing deadlocks
- Implement consistent lock ordering
-- Enable deadlock logging
ALTER SYSTEM SET deadlock_timeout = '1s';
ALTER SYSTEM SET log_lock_waits = on;
SELECT pg_reload_conf();
Resolving Active Blocking
When you need to resolve blocking immediately:
- Identify blocker in Blocking Sessions Graph
- Check Impact Assessment for severity
- Review blocker's query in Locks Grid
- Decision:
- Wait for completion
- Cancel query:
SELECT pg_cancel_backend(pid) - Terminate session:
SELECT pg_terminate_backend(pid)
-- Cancel a query (graceful)
SELECT pg_cancel_backend(12345);

-- Terminate a session (forceful)
SELECT pg_terminate_backend(12345);
Performance Tuning for Concurrency
To improve concurrent access:
- Review Wait Event Distribution for bottlenecks
- Check LWLock Analysis for internal contention
- Analyze IO Wait Analysis for I/O bottlenecks
- Consider:
- Reducing transaction duration
- Optimizing query access patterns
- Using appropriate isolation levels
- Implementing row-level locking strategies
Monitoring Advisory Locks
If your application uses advisory locks:
- Check Advisory Locks table for current state
- Ensure locks are being released properly
- Monitor for lock accumulation
- Review application lock patterns
Related Metrics
The Locks & Waits section uses these metrics from the Metrics Reference:
| Panel | Primary Metrics |
|---|---|
| Lock Count by Type | pg_locks_count |
| Lock Wait Queue | pg_locks_count (granted=false) |
| Deadlock Frequency | pg_database_stats.deadlocks |
| Locks Grid | pg_lock_detail, pg_backend_info |
| Blocking Sessions | pg_blocking_pids |
| Wait Events | pg_backend_wait_events |
Related Guides
- Performance - Query performance analysis
- Connections - Connection management
- Queries - Query analysis