PostgreSQL Connection Monitoring
The Connections tab provides comprehensive visibility into PostgreSQL connection management. Use it to monitor connection pools, identify connection leaks, and optimize connection utilization.
Sections
The Connections tab is organized into four sections:
- Overview - Connection topology and key stats
- Active Sessions - Detailed view of current sessions
- Connection Pool Analytics - Pool utilization and behavior
- Historical Analysis - Long-term connection patterns
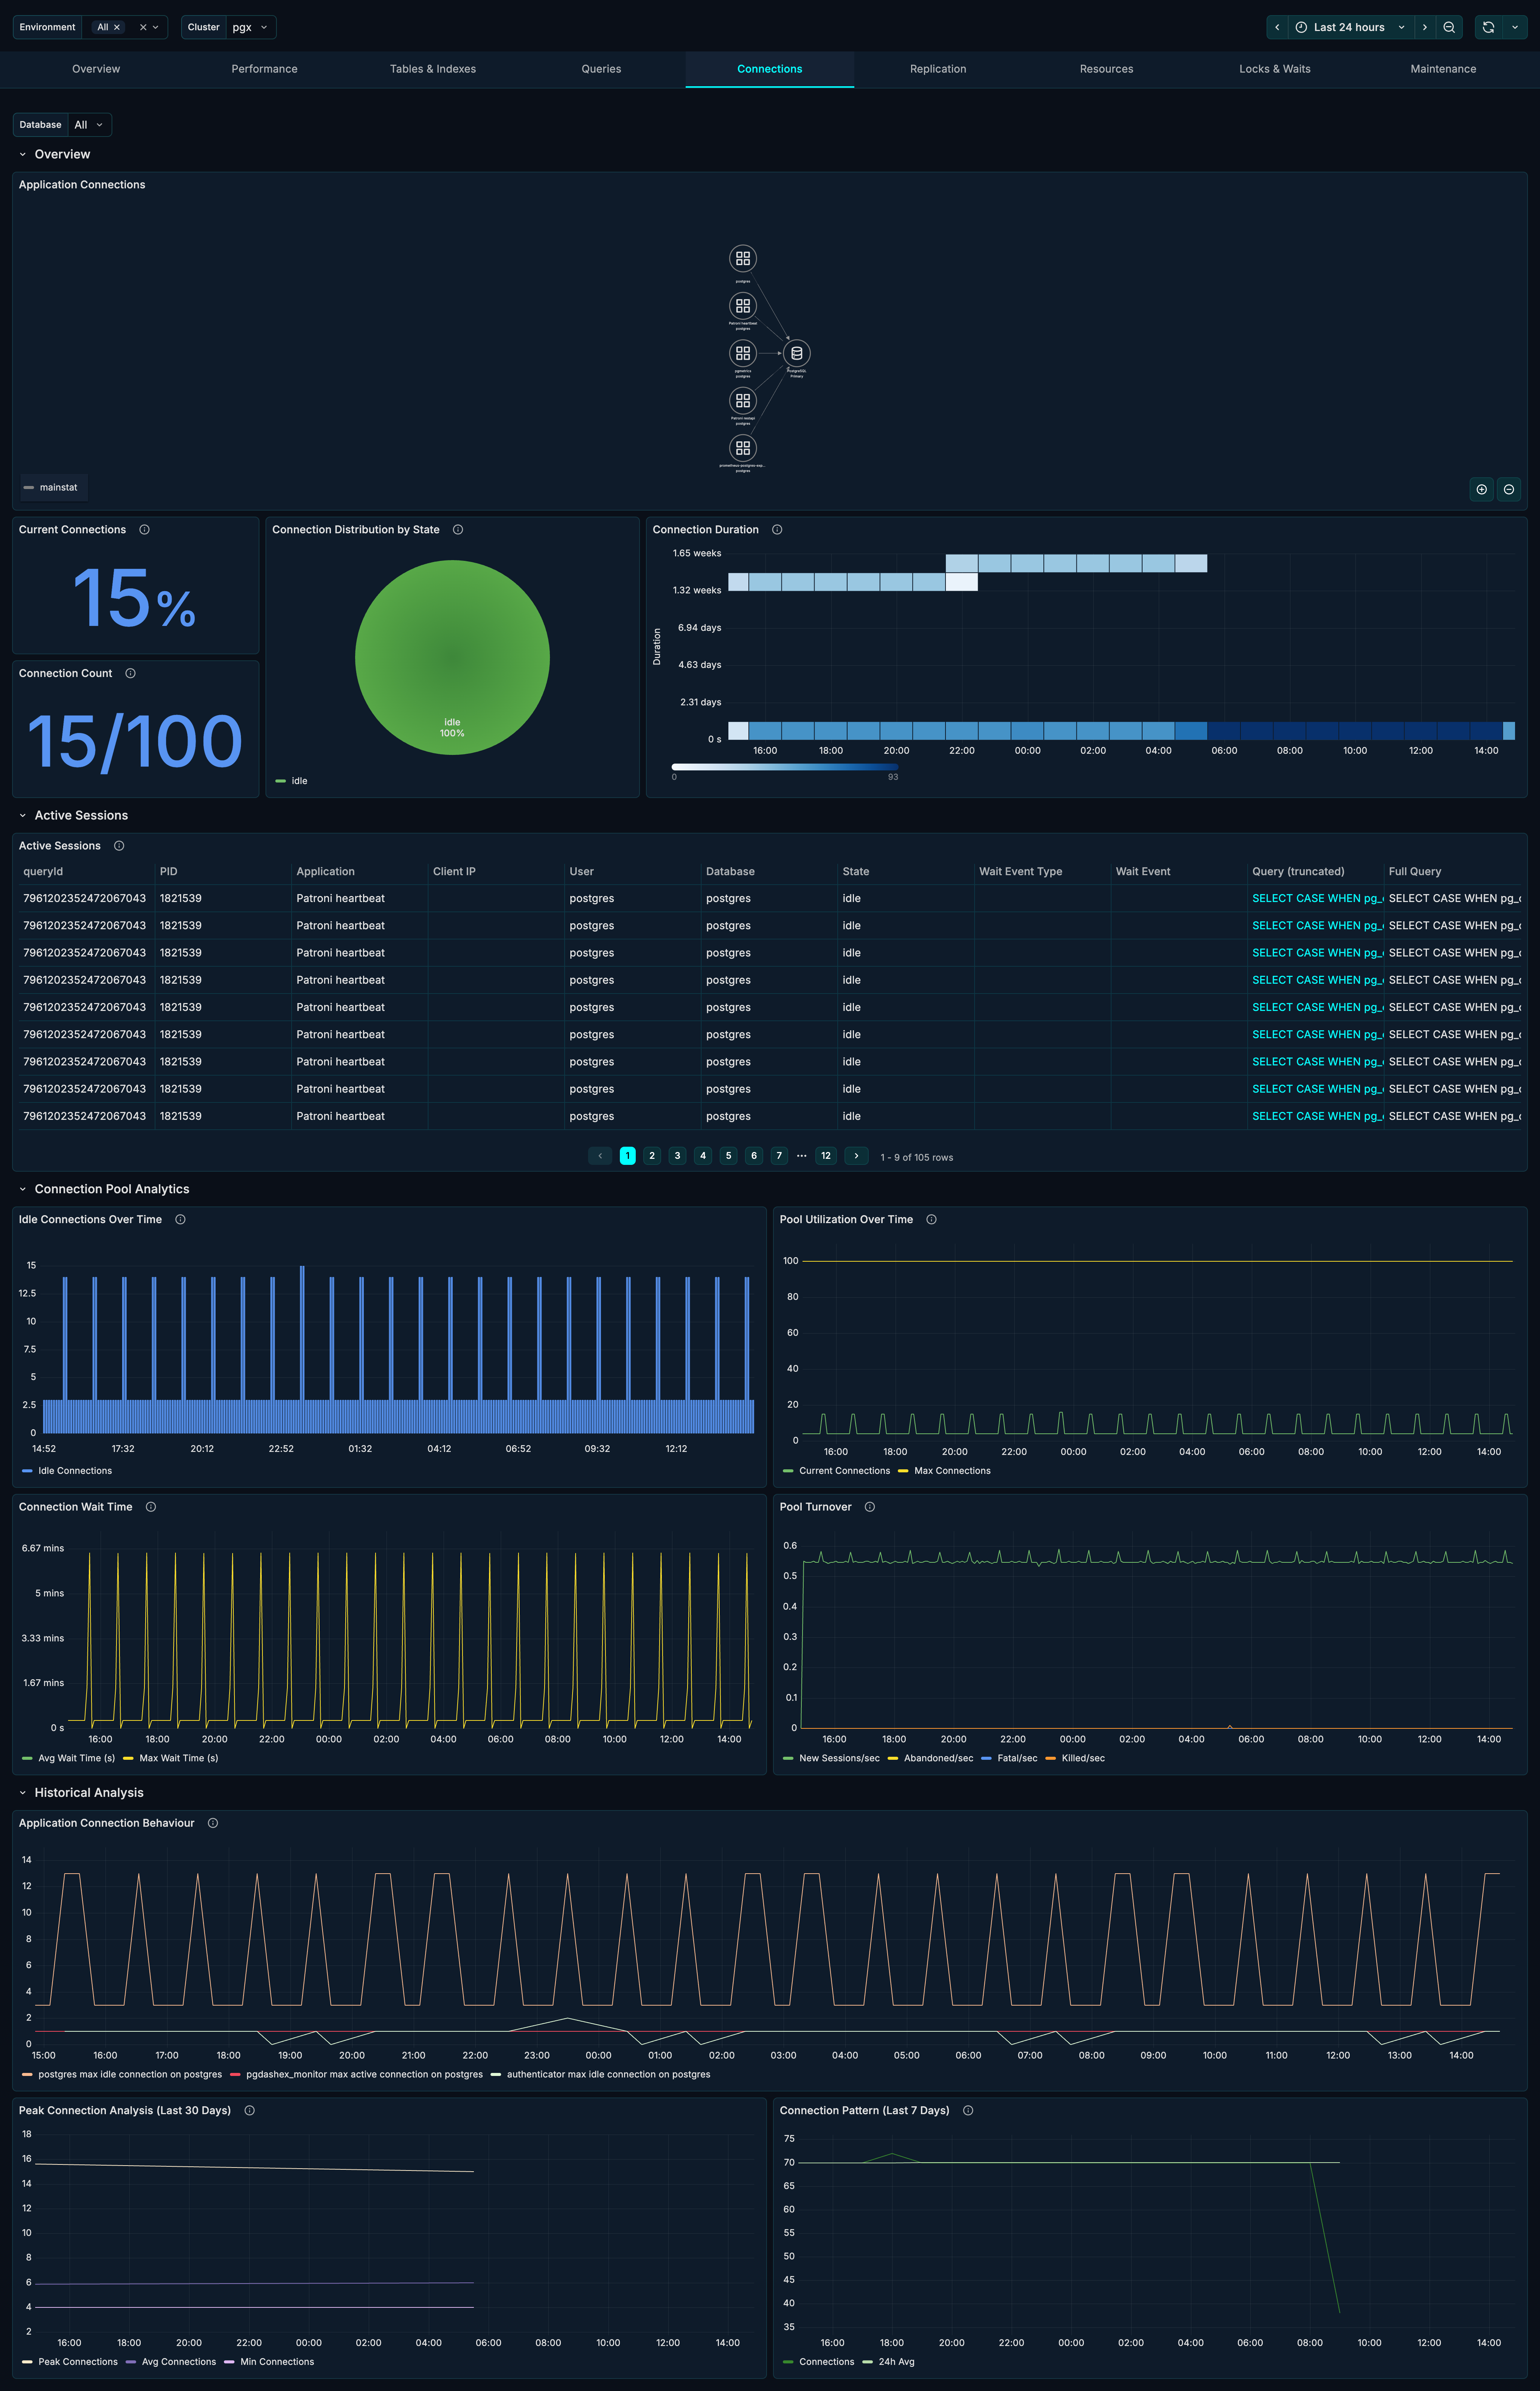
Overview Section
The Overview section provides immediate visibility into connection state and distribution.
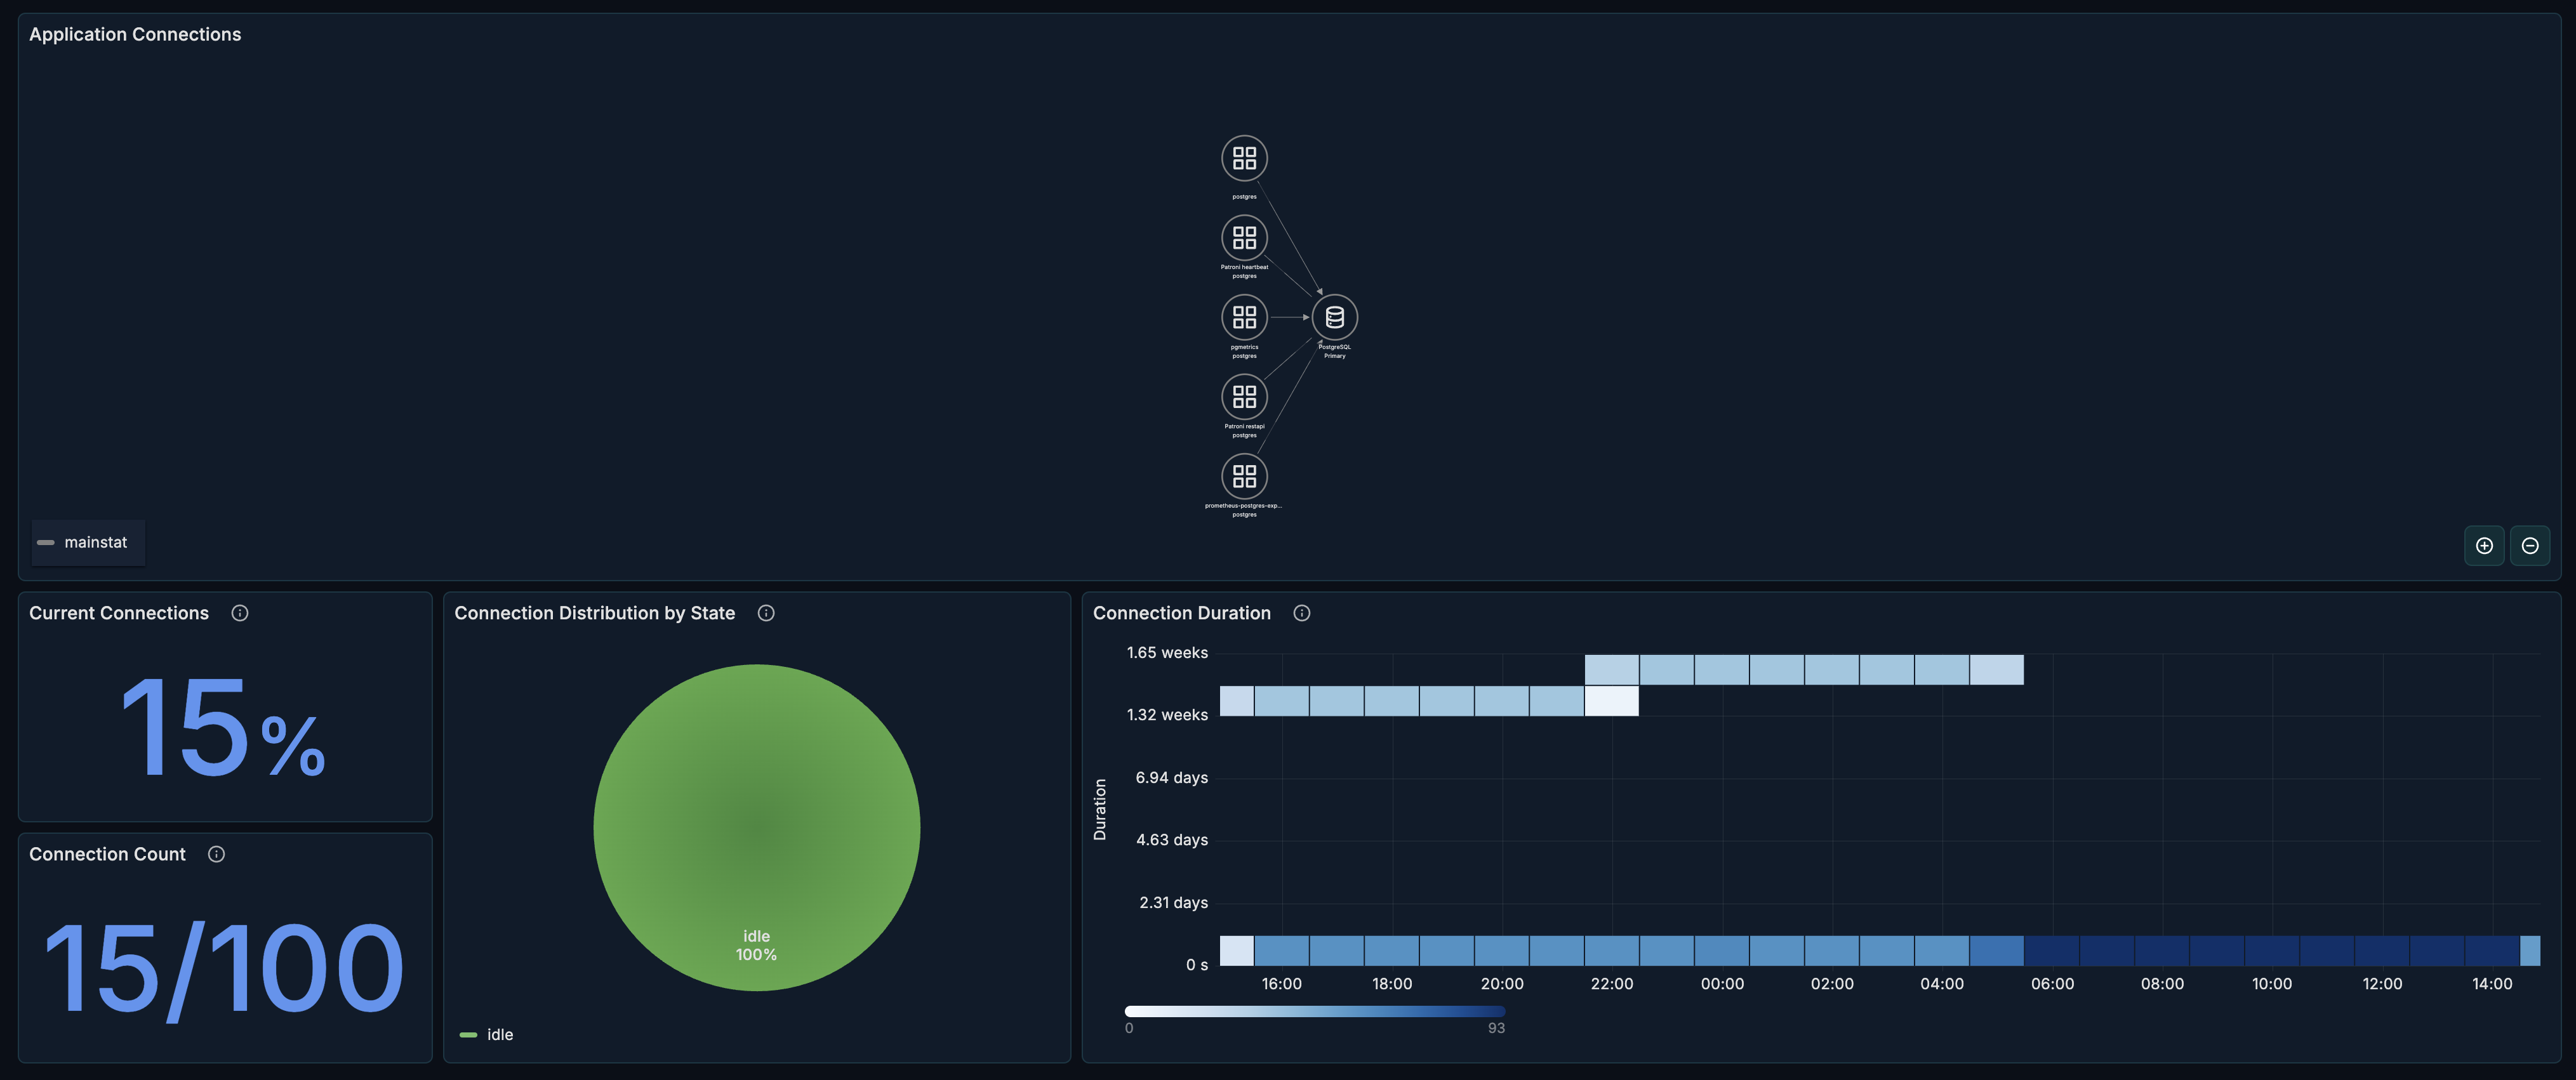
Application Connections Graph
A node graph visualization showing which applications are connected to PostgreSQL.
What it shows:
- Connected applications and services
- Connection distribution
- Network topology
How to use it:
- Identify all connection sources
- Spot unexpected connections
- Verify application connectivity
Current Connections
What it shows: Current connection count as a percentage of
max_connections.
Healthy range: < 80% of max_connections.
When to investigate:
- Approaching 80% - plan capacity increase
- Above 90% - immediate attention needed
- Sudden spikes - possible connection leak
Connection Count (Peak)
What it shows: Peak connection count in the selected time period.
How to use it:
- Understand peak demand
- Plan
max_connectionssetting - Identify peak usage times
Connection Distribution
A pie chart showing connections by state.
| State | Description |
|---|---|
| active | Currently executing a query |
| idle | Connected but not executing |
| idle in transaction | In a transaction but not executing |
| idle in transaction (aborted) | Transaction failed, waiting for rollback |
Healthy pattern:
- Mostly idle connections = good pooling
- Many active = high load or slow queries
- Many idle in transaction = possible issues
When to investigate:
- High "idle in transaction" - application not committing
- High "idle in transaction (aborted)" - unhandled errors
- Very few idle - may need more connections
Connection Duration Heatmap
What it shows: Distribution of connection ages over time.
How to interpret:
- Vertical spread = varying connection lifetimes
- Concentrated band = consistent pool behavior
- Long-lived connections = persistent connections or leaks
Active Sessions Section
The Active Sessions table shows details of all current connections. This section is collapsed by default - click to expand.
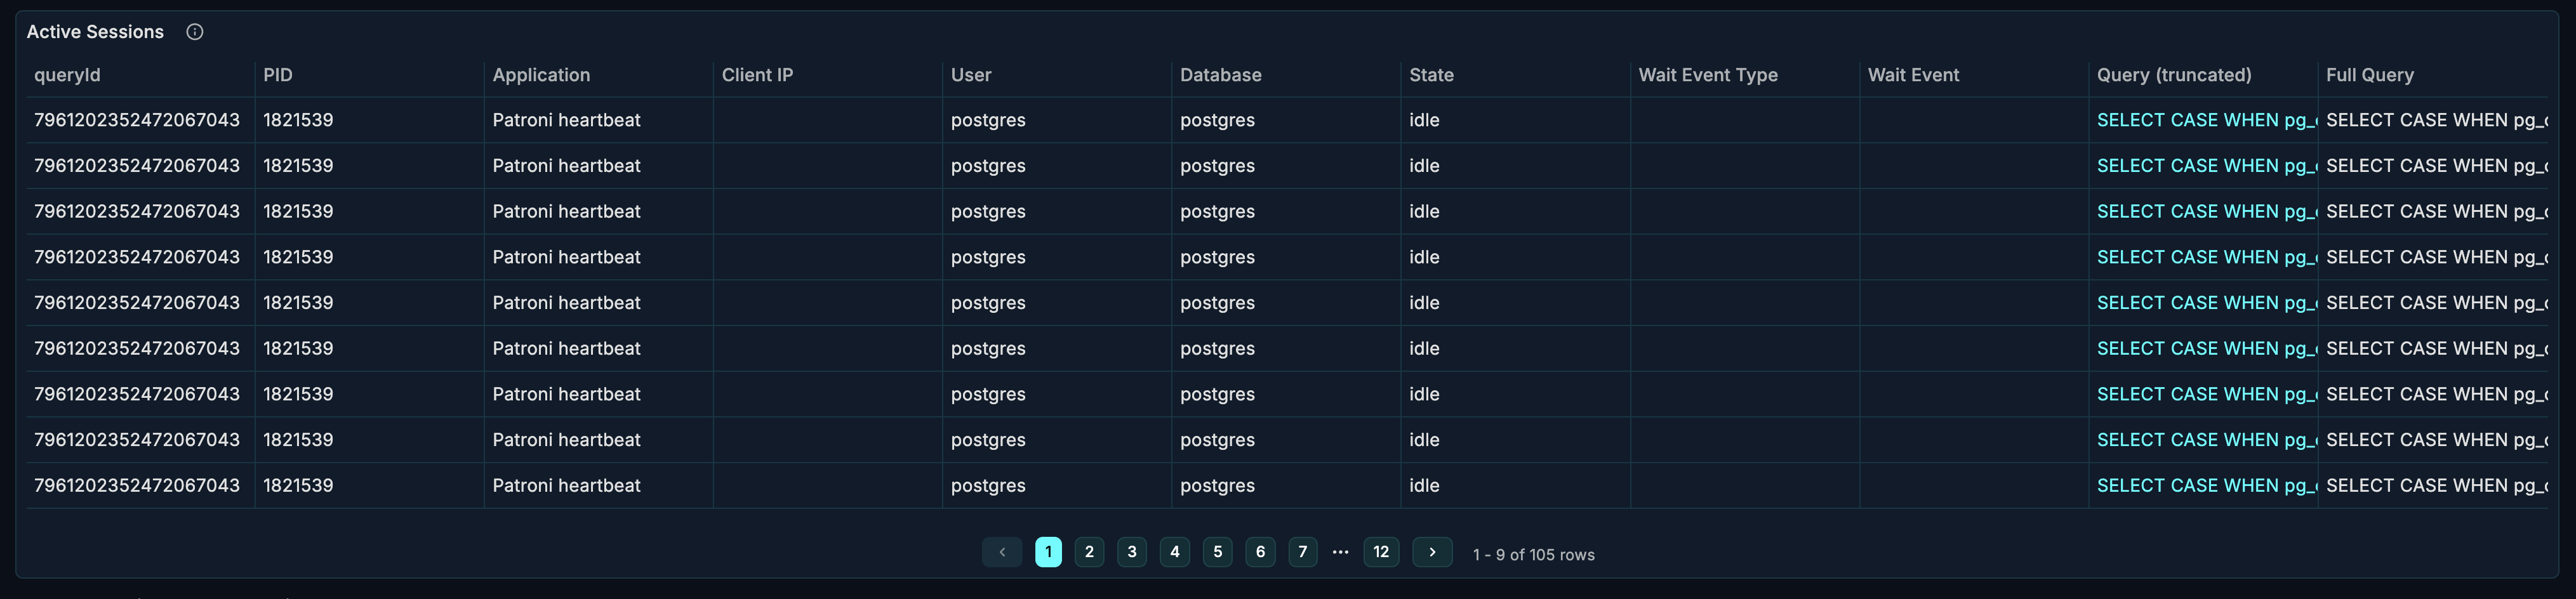
Table Columns
| Column | Description |
|---|---|
| PID | Process ID of the backend |
| Database | Connected database |
| User | PostgreSQL role |
| Application | Application name (if set) |
| Client | Client IP address |
| State | Current connection state |
| Query | Current or last query |
| Duration | Time in current state |
How to Use
Find long-running queries:
- Sort by Duration descending
- Look for active connections with long duration
- May indicate stuck queries or missing indexes
Identify idle in transaction:
- Filter by state = "idle in transaction"
- Long duration = possible application bug
- Check application code for uncommitted transactions
Track application connections:
- Group by Application
- Verify expected applications are connected
- Identify connection counts per application
Connection Pool Analytics Section
The Pool Analytics section helps you understand connection pool behavior. This section is collapsed by default - click to expand.
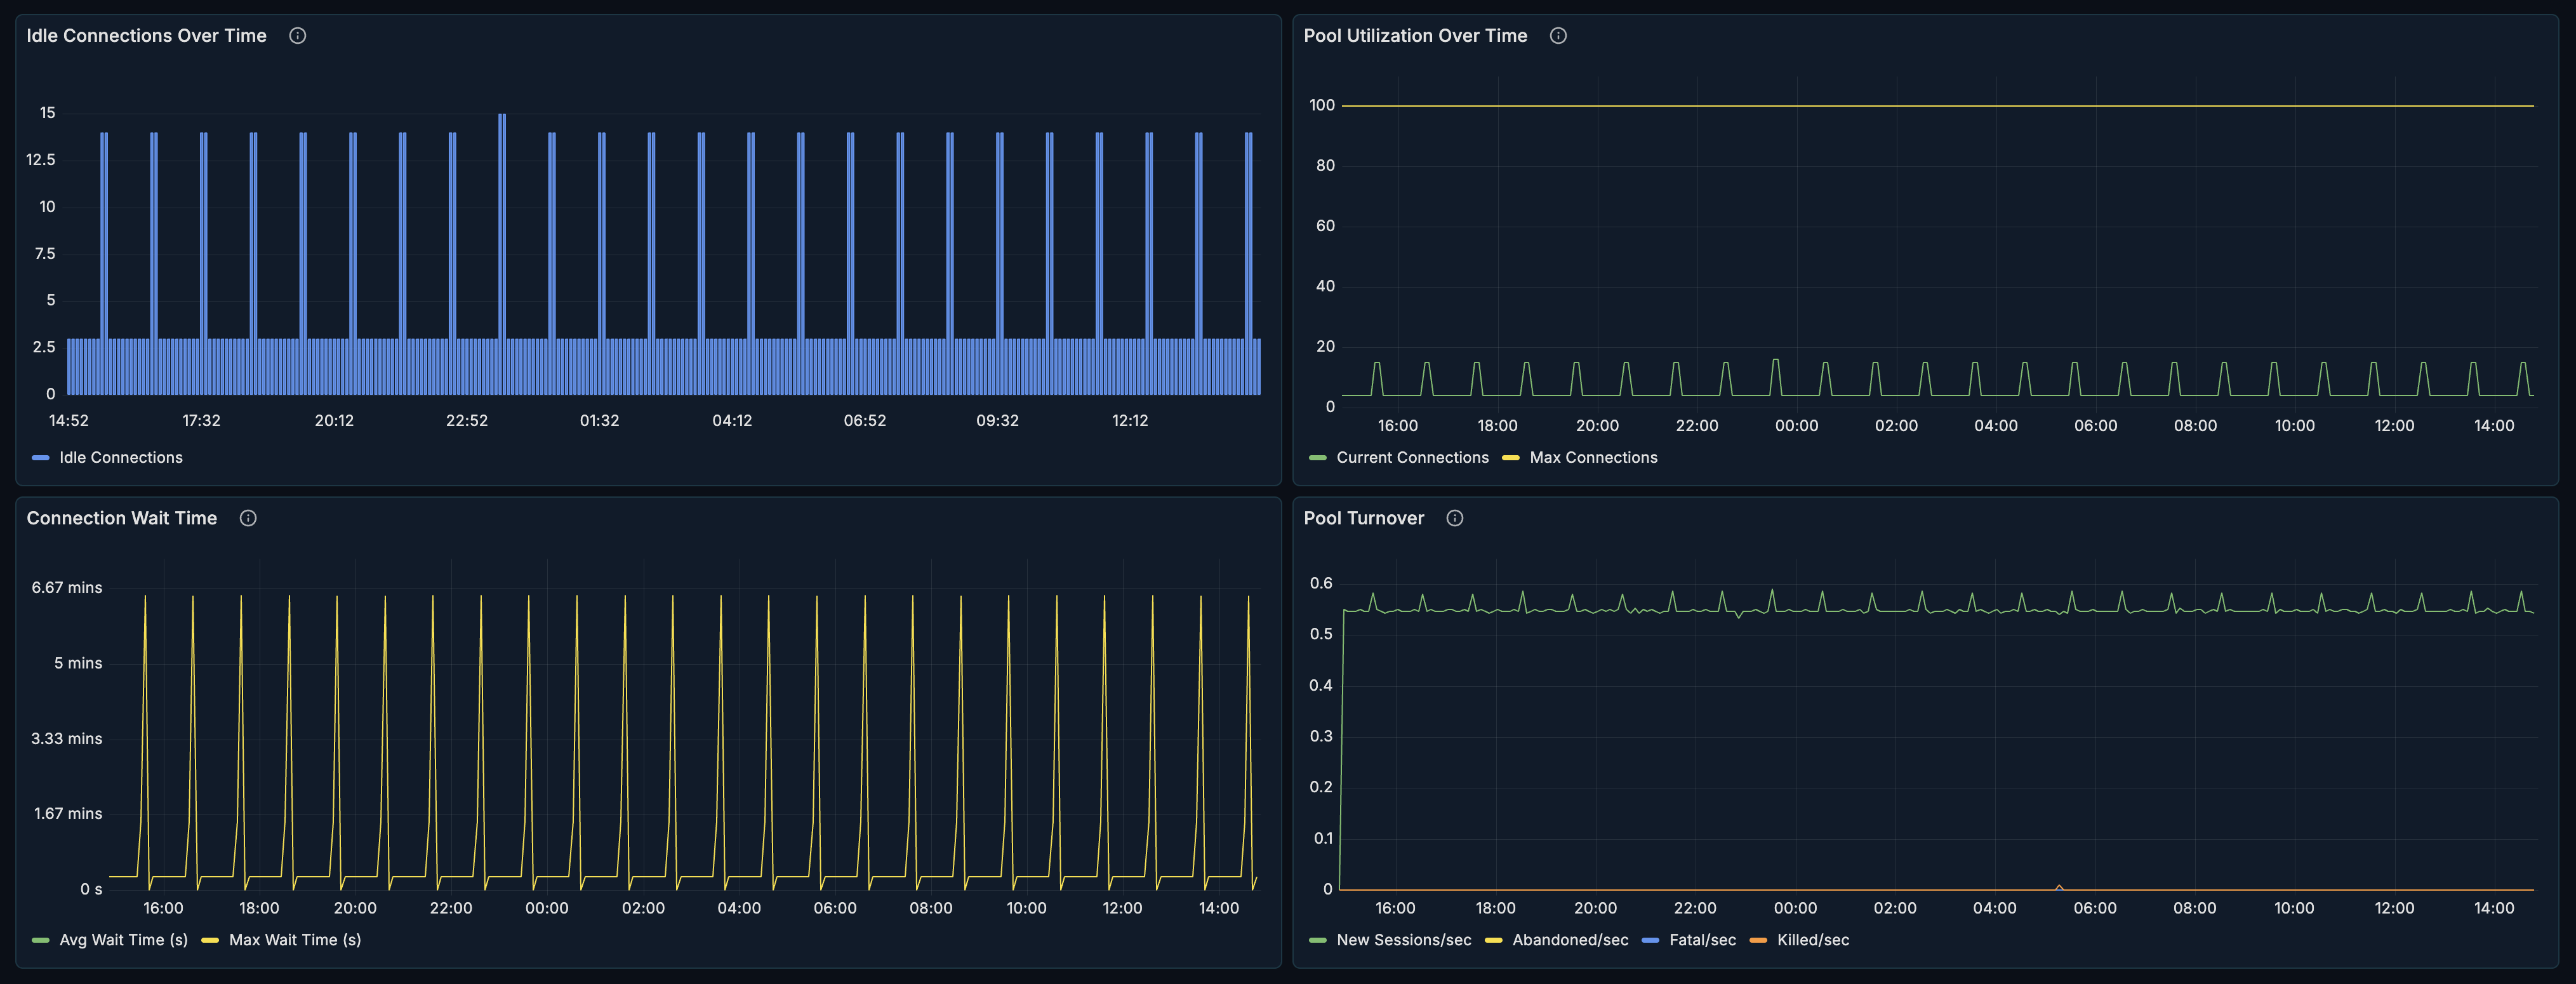
Idle Connection Analysis
What it shows: Count of idle connections over time.
How to interpret:
- Stable idle count = healthy pool
- Growing idle = possible connection leak
- Zero idle = pool exhaustion risk
Optimization tips:
- Too many idle = reduce pool size
- Too few idle = increase pool size
- Fluctuating = adjust pool min/max settings
Pool Utilization
What it shows: Percentage of connections actively in use.
Healthy range: 20-70% for typical workloads.
When to investigate:
- Consistently > 80% - increase pool size
- Consistently < 10% - decrease pool size
- Sudden spikes - traffic surge or slow queries
Connection Wait Time
What it shows: Time spent waiting for available connections.
Healthy range: Near zero for well-sized pools.
When to investigate:
- Any consistent wait time - pool too small
- Spikes correlating with traffic - scale pool dynamically
- Growing trend - connection leak or load increase
Pool Turnover
What it shows: Rate of connection creation and destruction.
How to interpret:
- Low turnover = stable, persistent connections
- High turnover = connections being recycled frequently
- Spiky turnover = burst traffic patterns
Optimization:
- High turnover is expensive - consider connection pooler
- Very low turnover with high wait = increase pool
- Match turnover to application pattern
Historical Analysis Section
The Historical Analysis section provides long-term connection pattern insights. This section is collapsed by default - click to expand.
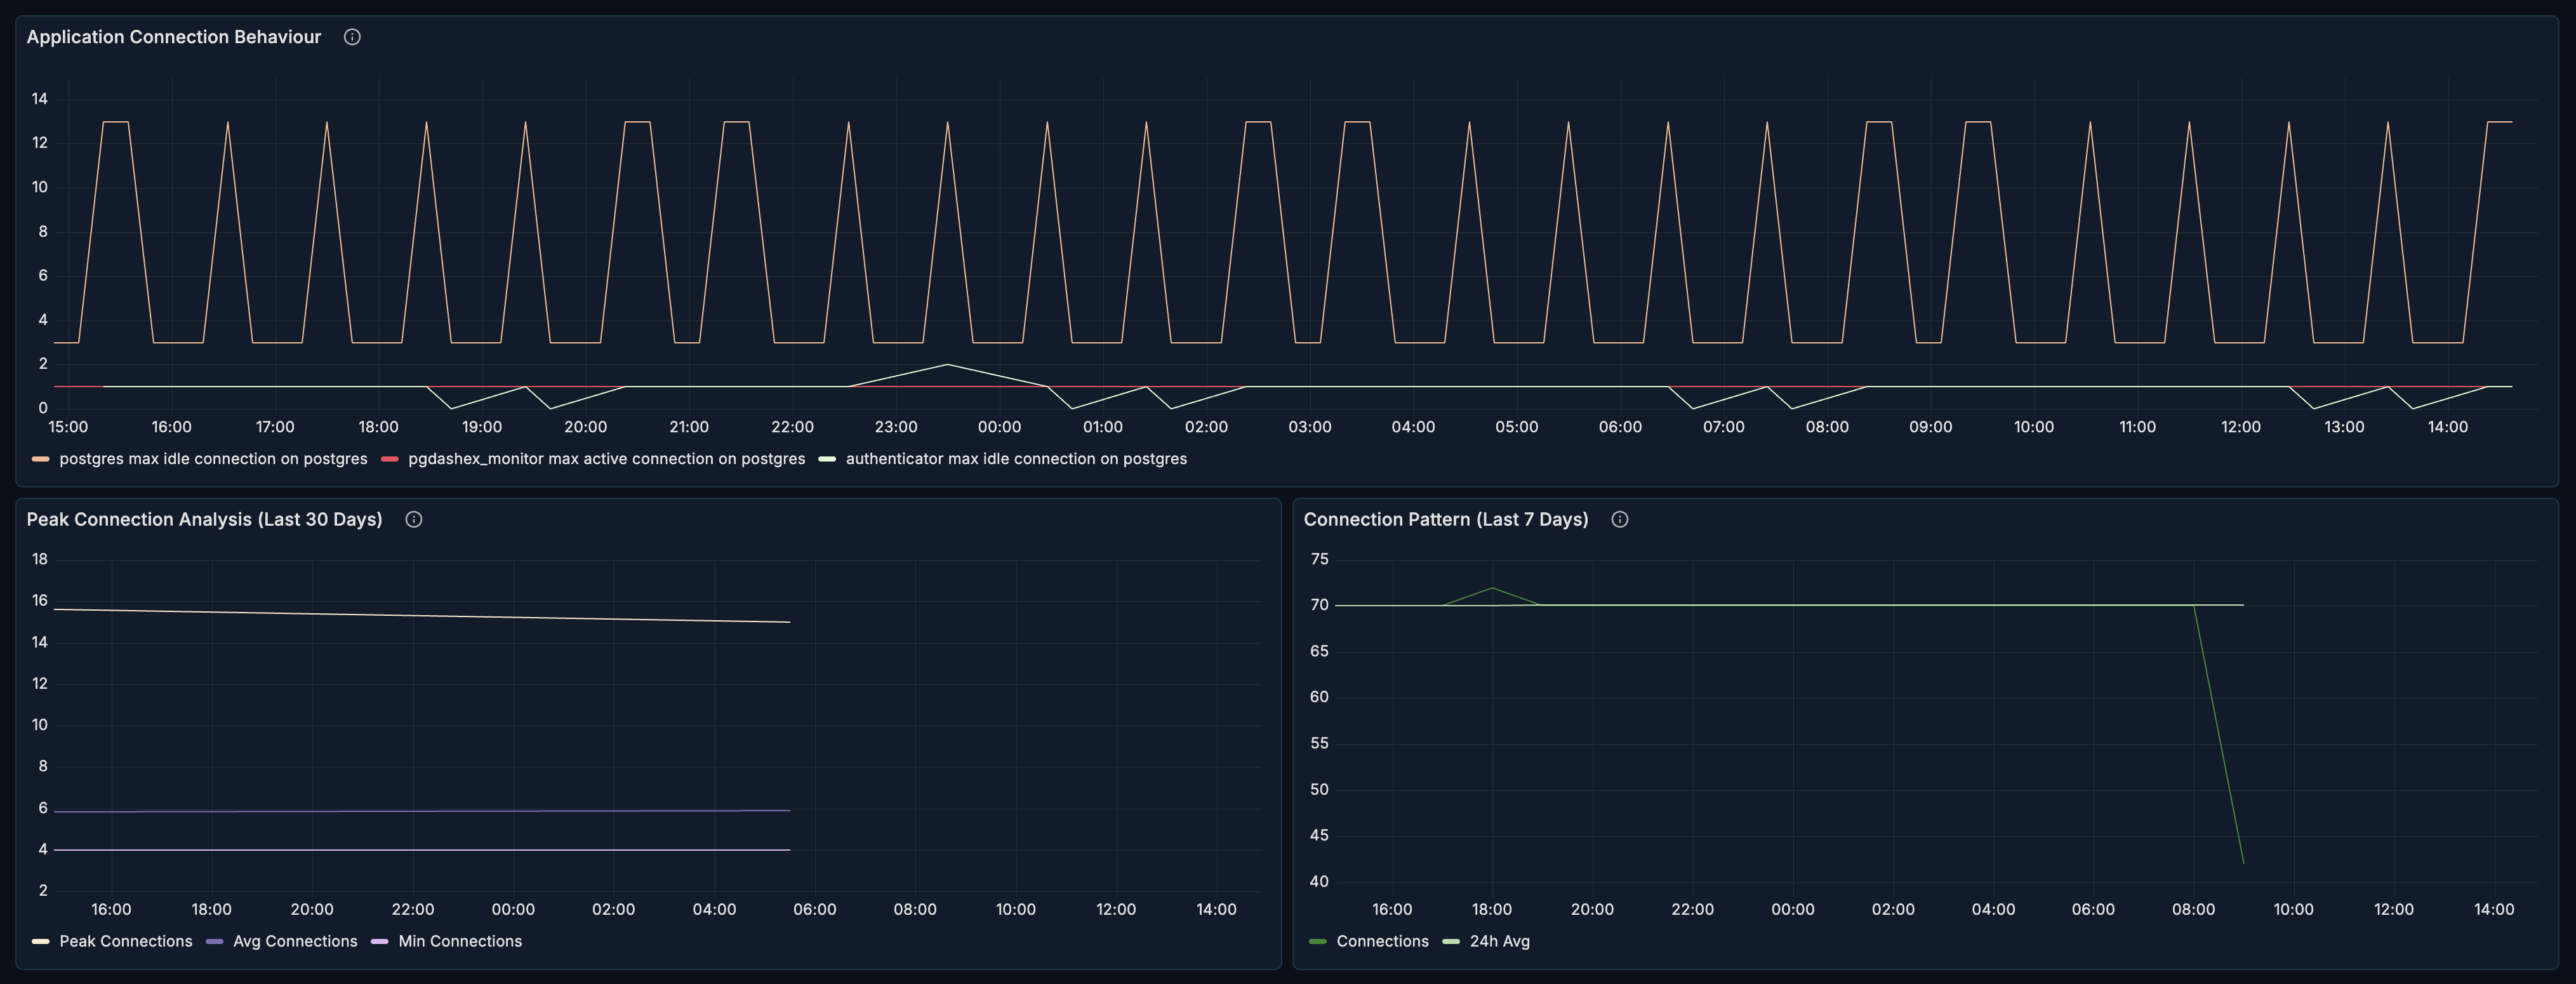
Application Connection Behavior
What it shows: Connection patterns per application over time.
How to use it:
- Identify which apps use most connections
- Spot applications with connection issues
- Plan capacity per application
Peak Connection Analysis
What it shows: Peak connections over extended periods.
How to use it:
- Understand daily/weekly patterns
- Plan for peak capacity
- Set appropriate
max_connections
7-Day Connection Pattern
What it shows: Connection behavior over the past week.
How to use it:
- Identify weekly patterns (weekday vs weekend)
- Spot anomalies in connection behavior
- Plan maintenance windows
Use Cases
Diagnosing Connection Exhaustion
When applications report "too many connections":
- Check Current Connections percentage
- Review Connection Distribution for state breakdown
- Look for "idle in transaction" in Active Sessions
- Check Connection Wait Time for queuing
- Review Pool Utilization trends
Common causes:
- Connection leaks in application
- Transactions not being committed
- Pool size too small for load
- Slow queries holding connections
Optimizing Connection Pool Size
- Review Pool Utilization over time
- Check Connection Wait Time for bottlenecks
- Analyze Idle Connection Analysis for waste
- Review Pool Turnover for efficiency
- Adjust pool min/max based on patterns
Guidelines:
- Target 30-60% utilization during peak
- Near-zero wait time
- Stable idle count matching pool minimum
- Low turnover indicates efficient pooling
Identifying Connection Leaks
- Watch Idle Connection Analysis for growth
- Check Active Sessions for long idle connections
- Review Application Connection Behavior by app
- Look for applications not releasing connections
Signs of leaks:
- Growing idle connection count
- Same connections idle for hours
- Applications with disproportionate connections
Capacity Planning
- Review Peak Connection Analysis
- Analyze 7-Day Connection Pattern
- Check Application Connection Behavior growth
- Plan
max_connectionswith headroom
Recommendations:
- Set
max_connectionsto 1.5x peak usage - Consider connection pooler (PgBouncer) for high connection counts
- Monitor trends for growth patterns
Troubleshooting Idle in Transaction
When you see many "idle in transaction" connections:
- Check Connection Distribution for proportion
- Find specific sessions in Active Sessions table
- Note the Application and Query
- Review application code for:
- Missing COMMIT statements
- Error handling not rolling back
- Long-running batch operations
Related Metrics
The Connections section uses these metrics from the Metrics Reference:
| Panel | Primary Metrics |
|---|---|
| Current Connections | pg_connections, pg_settings.max_connections |
| Connection Count | pg_connections |
| Distribution | pg_connections (by state) |
| Duration Heatmap | pg_backend_age_seconds |
| Active Sessions | pg_backend_info, pg_backend_age_seconds |
| Idle Analysis | pg_connections (state = idle) |
| Pool Utilization | pg_connections, pg_settings.max_connections |
| Wait Time | pg_database_stats.session_time_ms |
| Application Behavior | pg_connections (by application) |
Related Guides
- Overview - High-level cluster health
- Locks & Waits - Investigate blocked connections
- Performance - Query performance affecting connections