PostgreSQL Vacuum & Maintenance
The Maintenance tab helps you monitor PostgreSQL maintenance operations and identify tables requiring attention. Use it to track vacuum status, dead tuple accumulation, bloat levels, and freeze age.
Sections
The Maintenance tab is organized into three sections:
- Critical Stats - Key maintenance health indicators
- Vacuum Analysis - Manual and auto vacuum tracking
- Bloat Monitoring - Table and index bloat trends
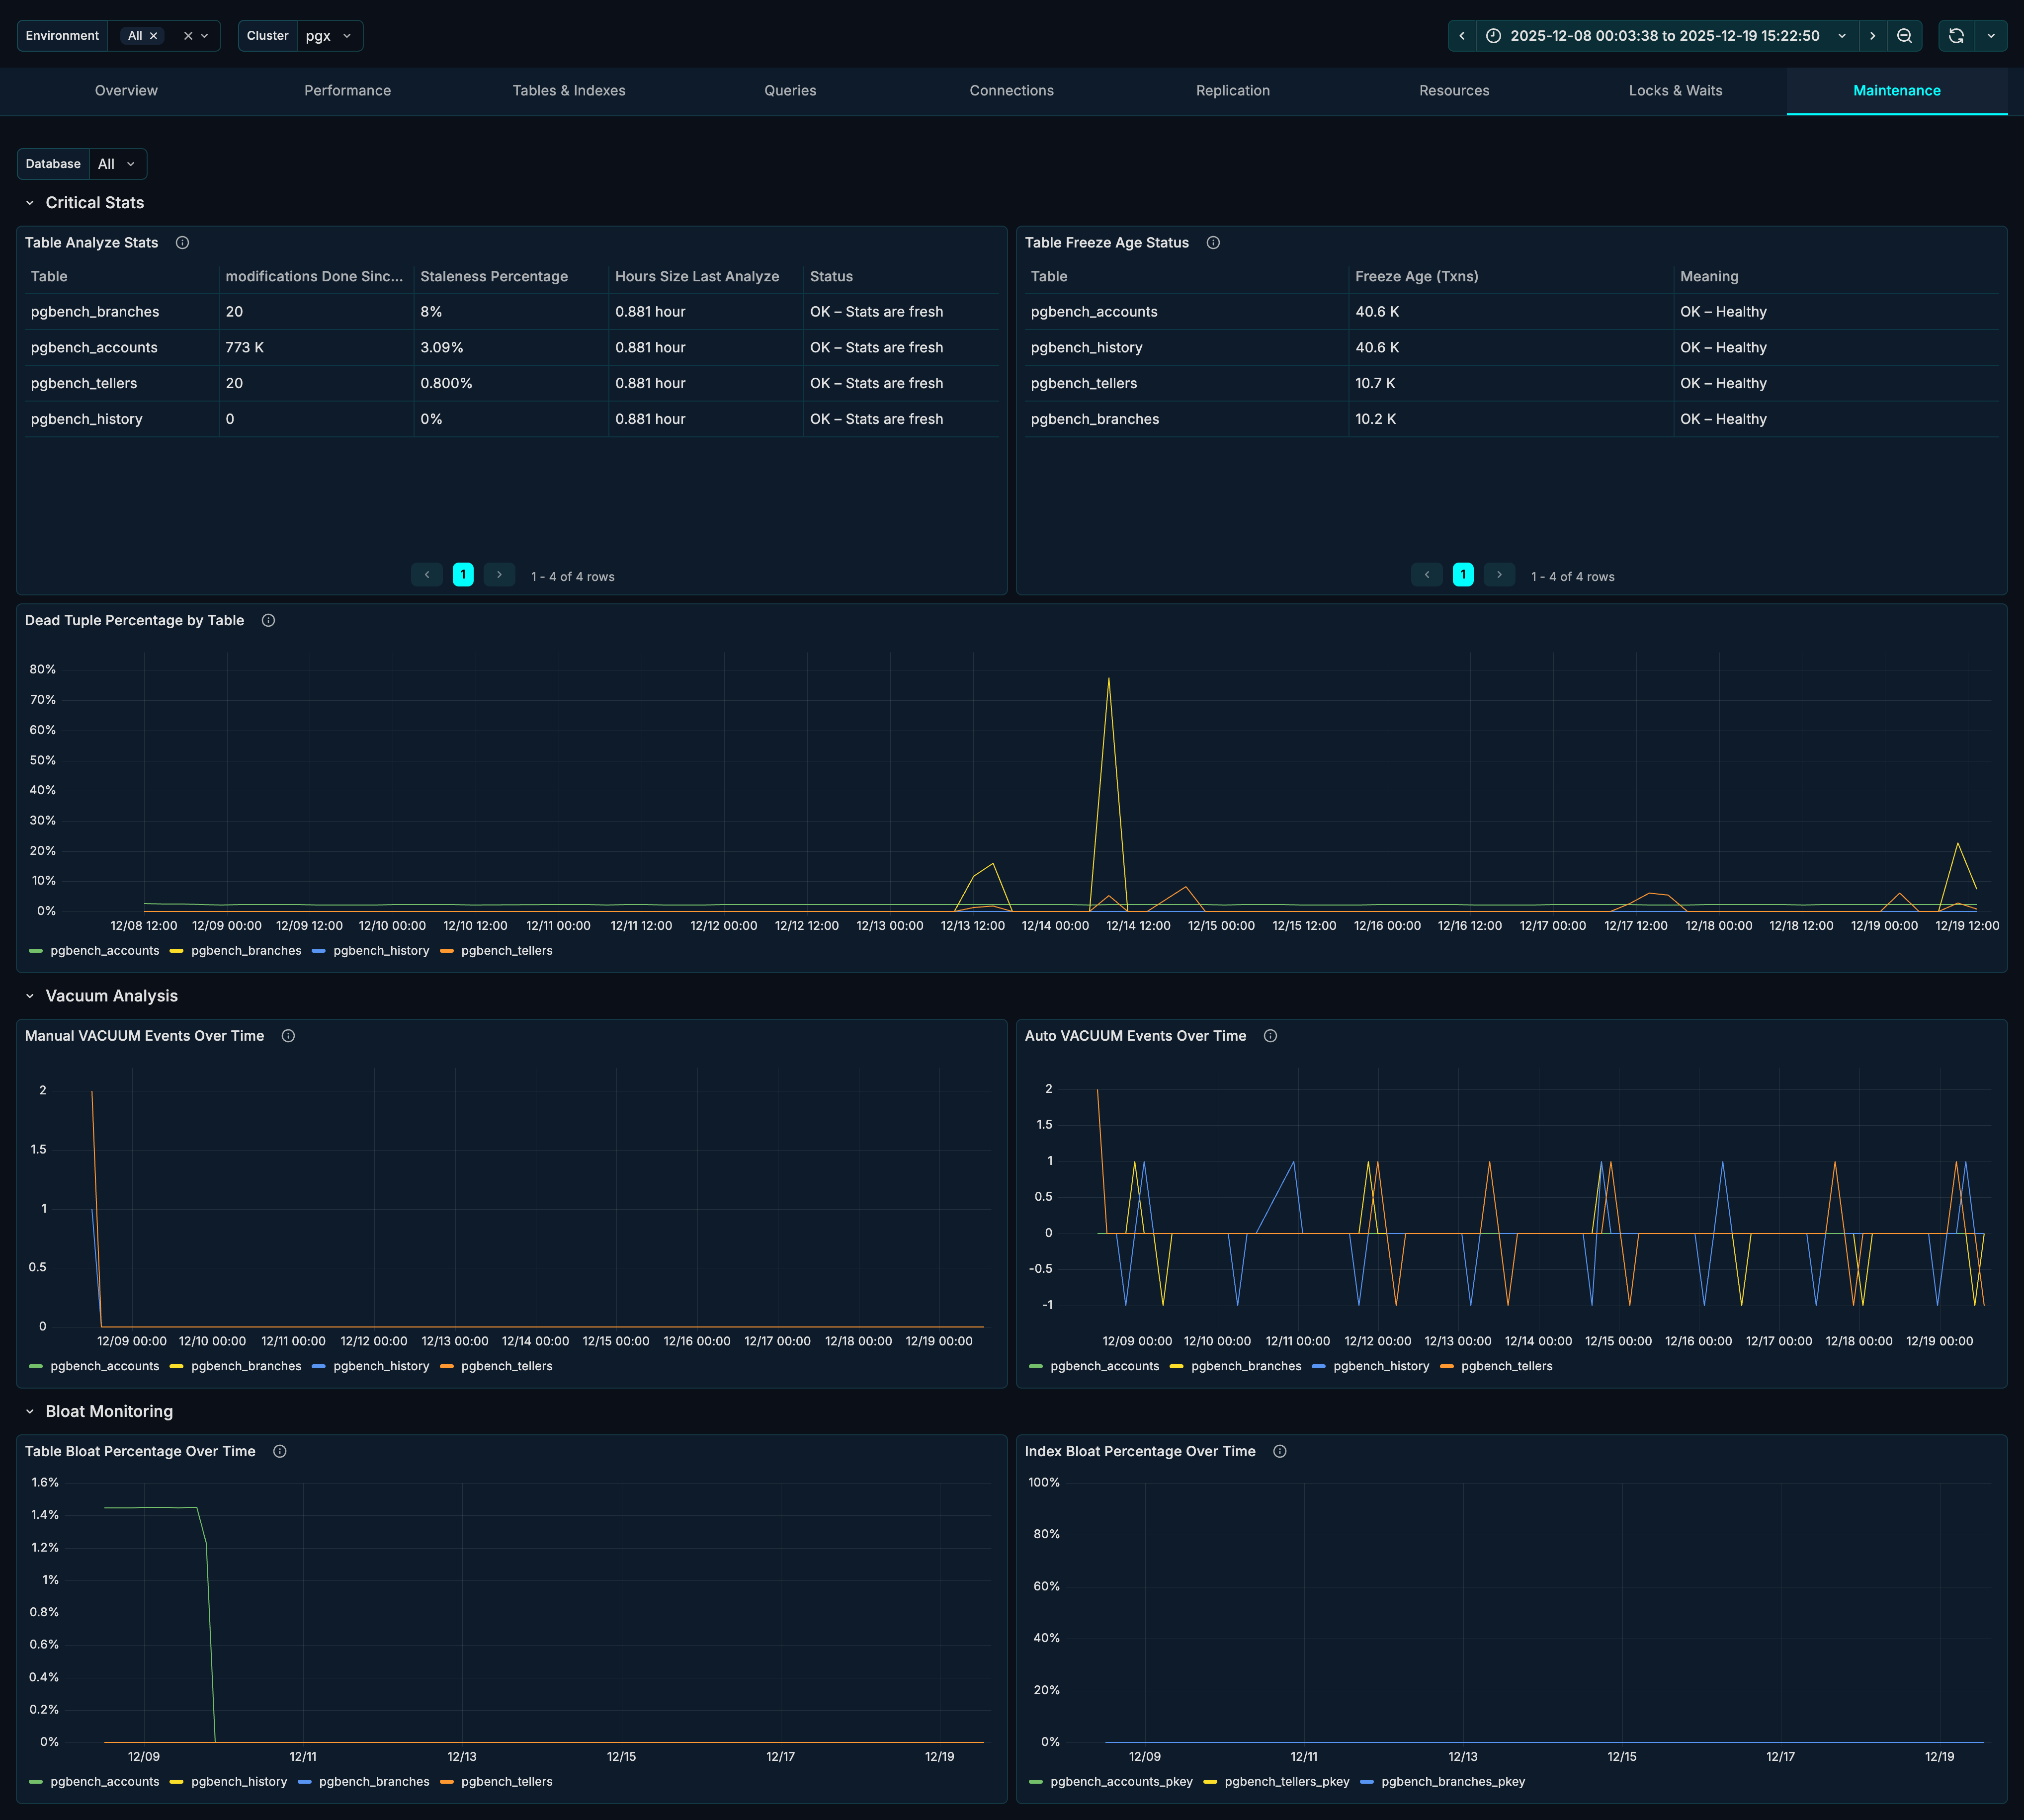
Critical Stats Section
The Critical Stats section shows the most important maintenance metrics requiring attention.
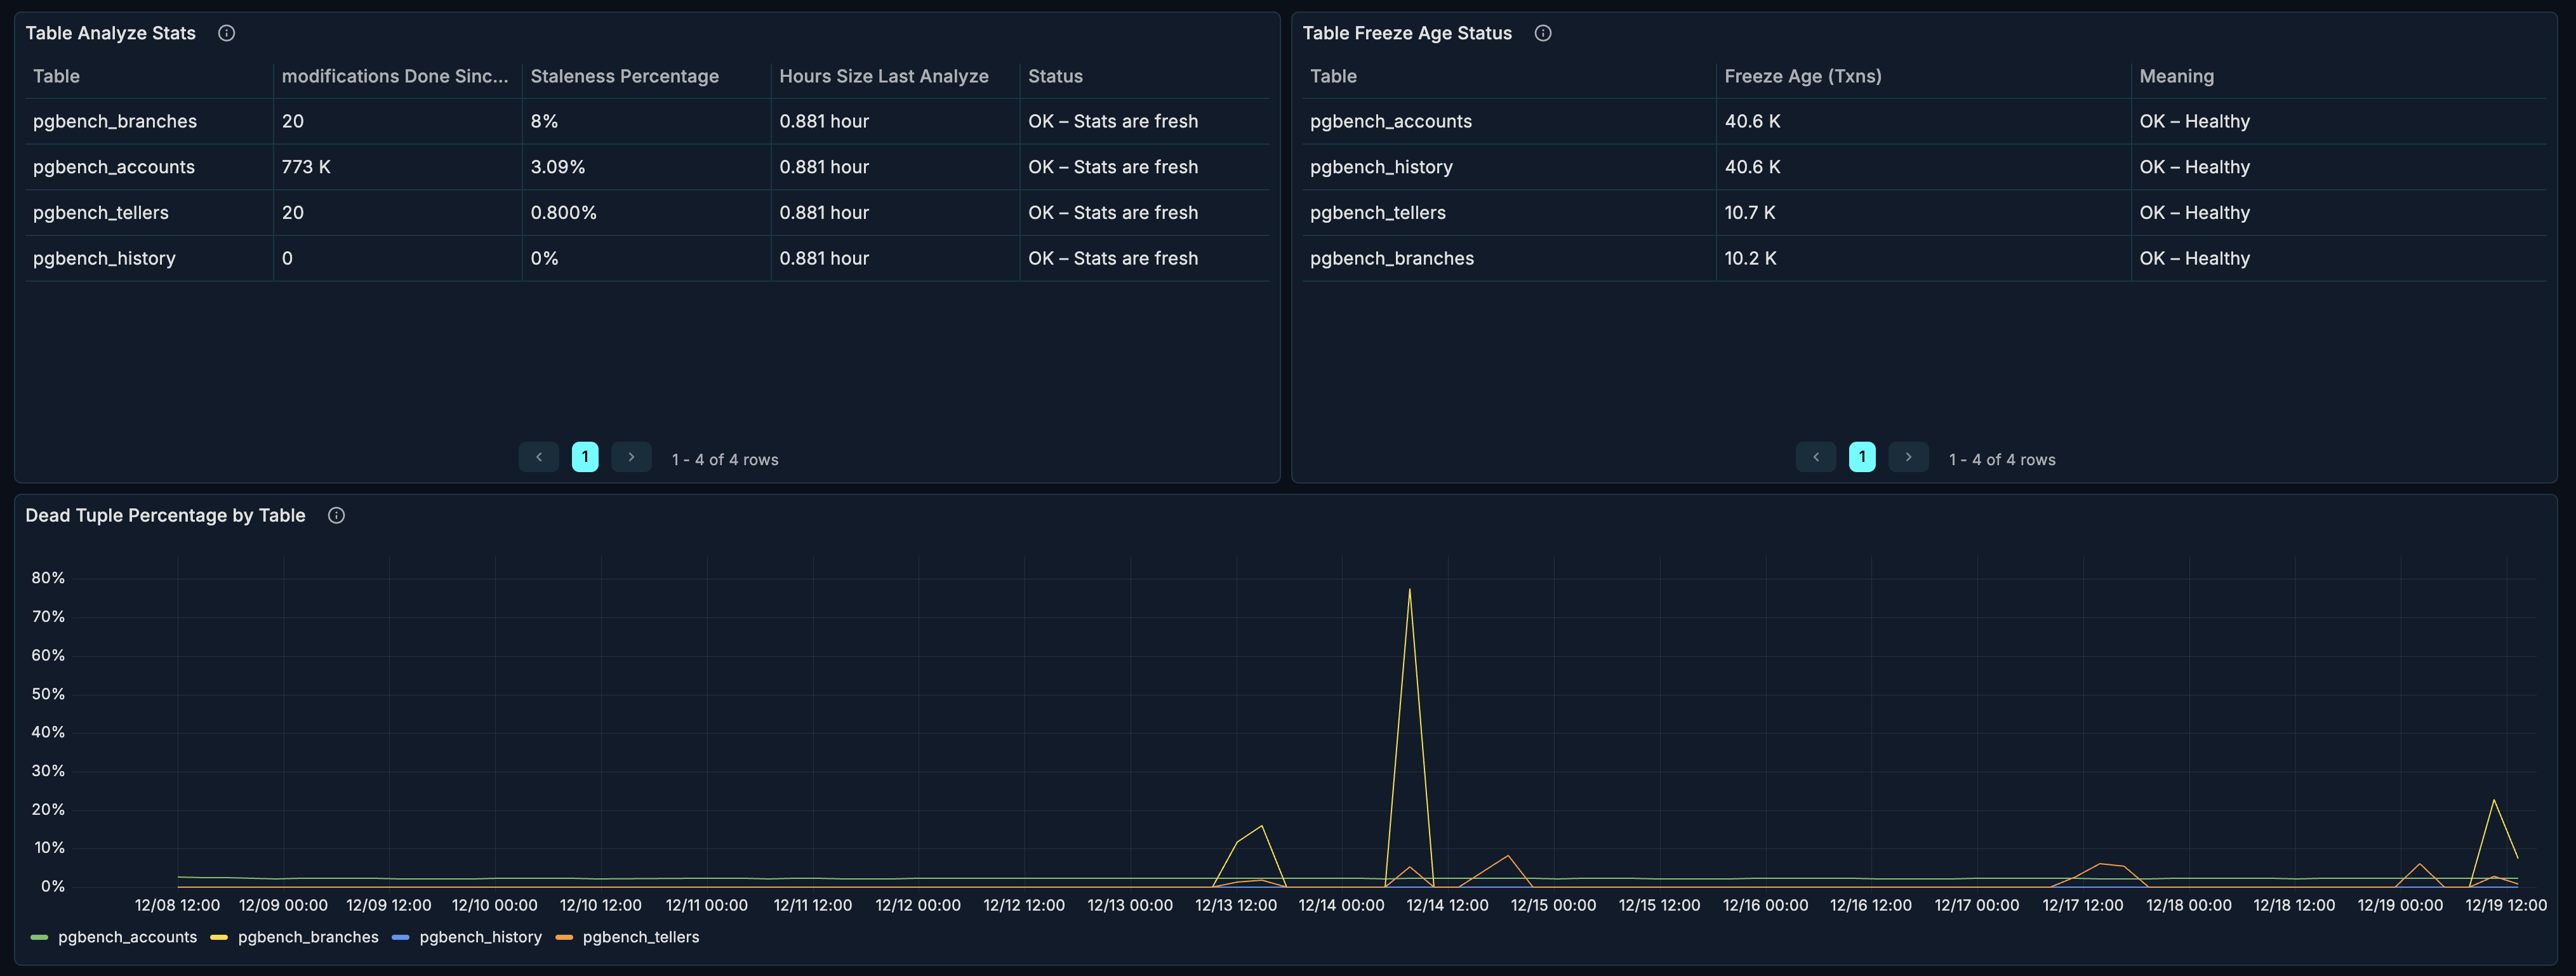
Table Analyze Stats
What it shows: When tables were last analyzed and rows modified since.
Why it matters:
- ANALYZE updates table statistics
- Query planner uses statistics for optimization
- Stale statistics cause poor query plans
Columns:
| Column | Description |
|---|---|
| Table | Table name |
| Last Analyze | When last ANALYZE ran |
| Last Autoanalyze | When autovacuum last analyzed |
| Rows Modified | Rows changed since last analyze |
When to investigate:
- Very old analyze timestamps
- High rows modified counts
- Poor query performance
Table Freeze Age Status
What it shows: Transaction ID age of tables approaching wraparound.
Why it matters:
- PostgreSQL uses 32-bit transaction IDs
- IDs must be "frozen" before wraparound
- Failure to freeze causes database shutdown
Warning thresholds:
| Age | Status |
|---|---|
| < 100M | Healthy |
| 100M - 150M | Monitor |
| 150M - 200M | Warning |
| > 200M | Critical - immediate action needed |
When to investigate:
- Any table > 100M age
- Increasing age trends
- Tables not being frozen
Emergency action:
-- Check freeze age
SELECT c.relname, age(c.relfrozenxid) as freeze_age
FROM pg_class c
JOIN pg_namespace n ON c.relnamespace = n.oid
WHERE c.relkind = 'r'
ORDER BY age(c.relfrozenxid) DESC;

-- Force vacuum freeze
VACUUM FREEZE tablename;
Dead Tuple Percentage
What it shows: Percentage of dead tuples per table over time.
Why it matters:
- Dead tuples consume space
- Cause table bloat
- Slow down sequential scans
Healthy range: < 10% for most tables.
When to investigate:
- Tables > 10% dead tuples
- Growing dead tuple percentage
- Correlation with performance issues
Vacuum Analysis Section
The Vacuum Analysis section shows vacuum operation frequency. This section is collapsed by default - click to expand.
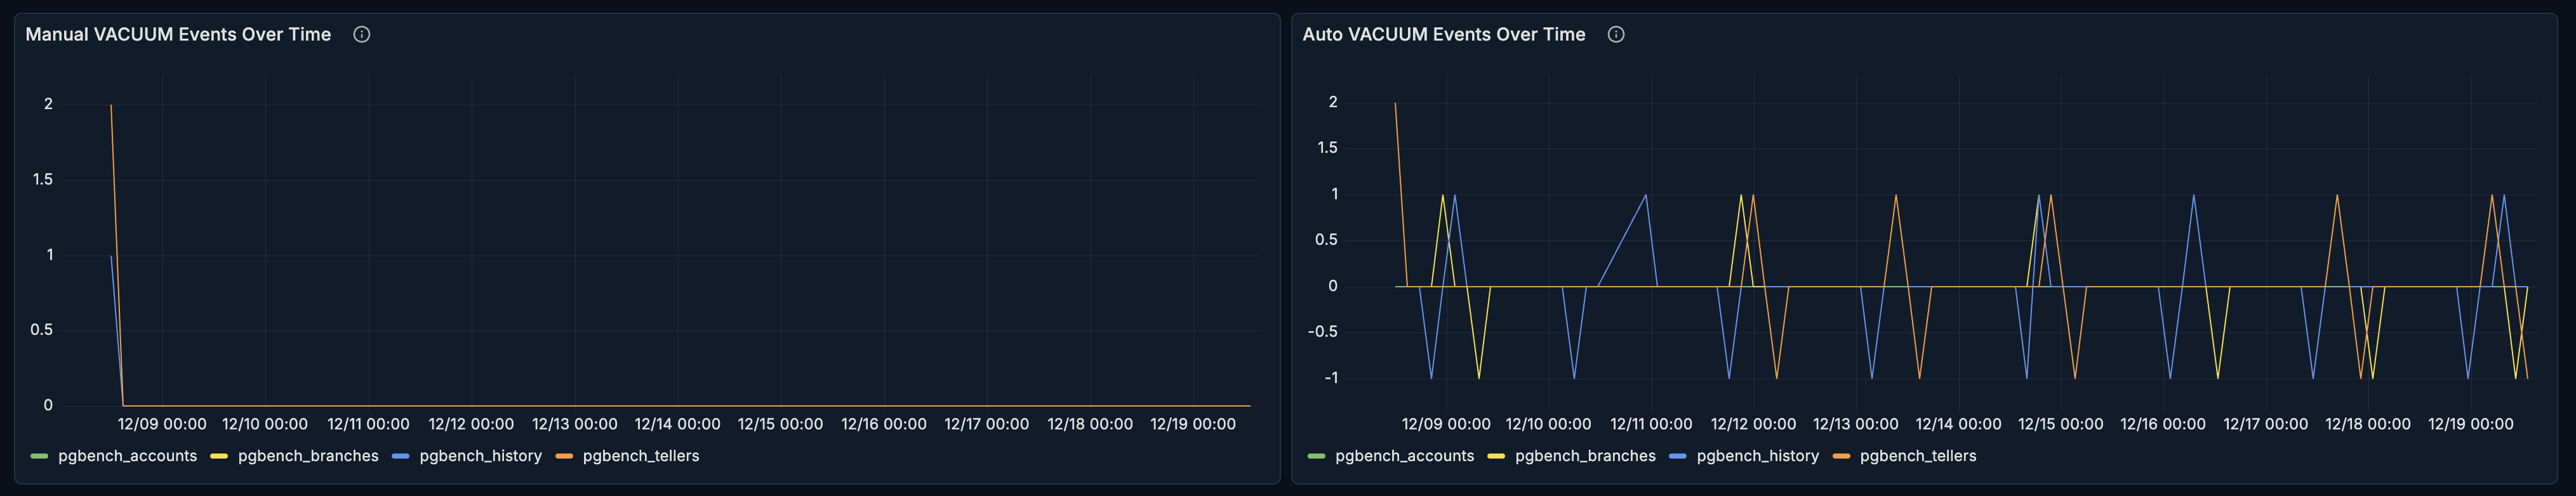
Manual Vacuum Events
What it shows: Manual VACUUM operations over time.
How to interpret:
- Scheduled maintenance windows
- Ad-hoc cleanup operations
- DBA interventions
When you need manual vacuum:
- After bulk deletions
- Before planned heavy read operations
- When autovacuum is falling behind
Auto Vacuum Events
What it shows: Autovacuum operations over time.
How to interpret:
- Higher frequency = more dead tuples being generated
- Low frequency = low write activity or generous thresholds
- Spikes = after bulk operations
When to investigate:
- Very low autovacuum frequency on busy tables
- Autovacuum not running when expected
- High frequency indicating excessive churn
Bloat Monitoring Section
The Bloat Monitoring section tracks wasted space in tables and indexes. This section is collapsed by default - click to expand.
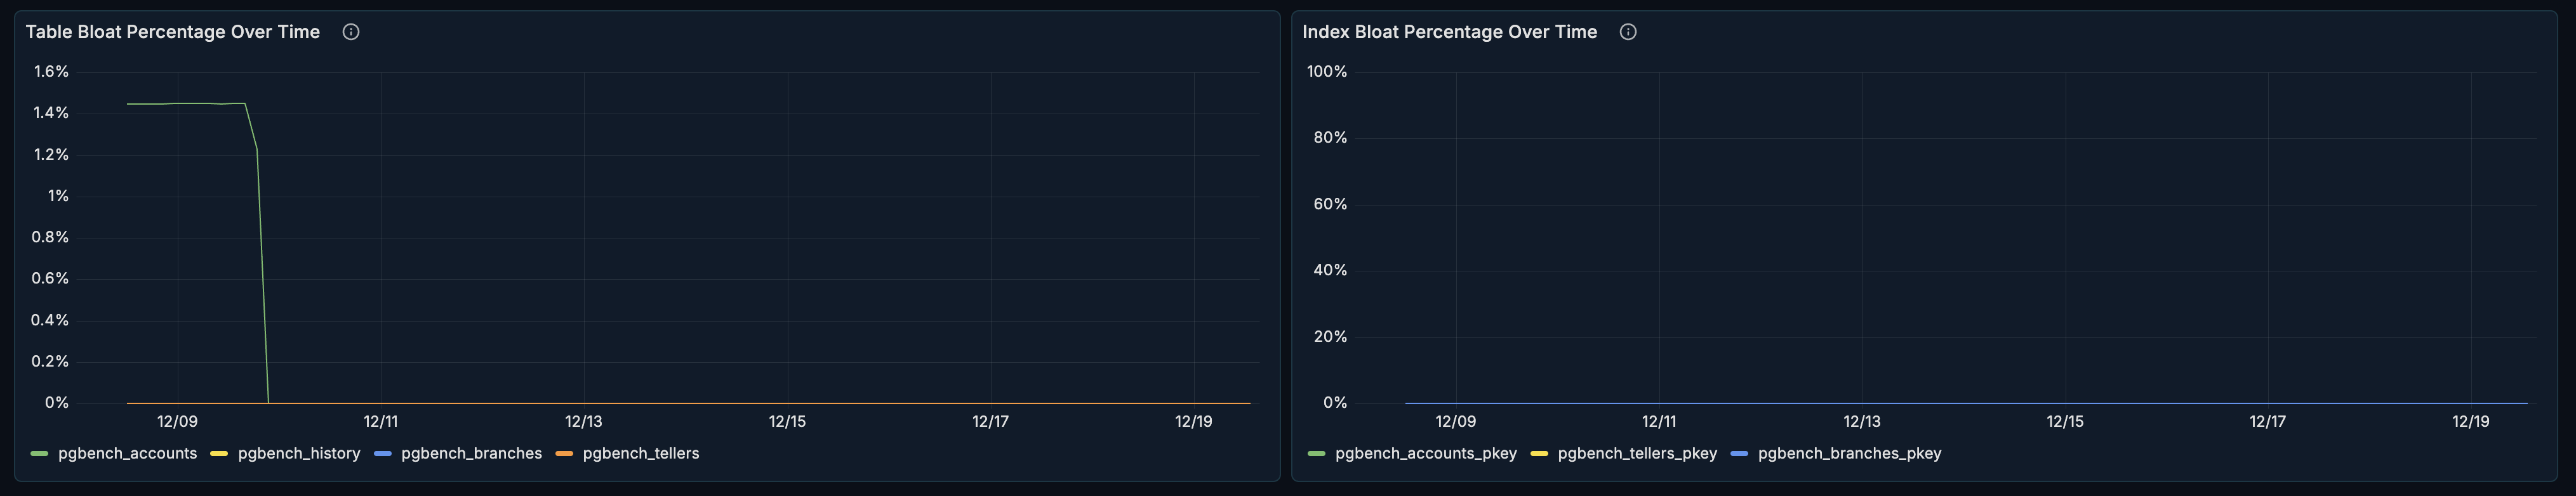
Table Bloat Percentage
What it shows: Estimated table bloat over time.
What causes bloat:
- UPDATE operations (old versions retained)
- DELETE operations (space not immediately reclaimed)
- Vacuum not running frequently enough
Healthy range: < 20% for most tables.
When to investigate:
- Tables > 20% bloat
- Growing bloat trend
- Performance degradation
Remediation:
| Bloat Level | Action |
|---|---|
| 10-20% | Standard VACUUM |
| 20-40% | VACUUM FULL (during maintenance window) |
| > 40% | pg_repack or VACUUM FULL |
-- Standard vacuum (non-blocking)
VACUUM tablename;

-- Vacuum full (blocking, reclaims all space)
VACUUM FULL tablename;

-- Using pg_repack (non-blocking, requires extension)
-- pg_repack --table tablename
Index Bloat Percentage
What it shows: Estimated index bloat over time.
What causes index bloat:
- Same factors as table bloat
- Page splits in B-tree indexes
- Non-HOT updates
Healthy range: < 30% for most indexes.
Remediation:
-- Rebuild a single index (blocking)
REINDEX INDEX indexname;

-- Rebuild all indexes on a table (blocking)
REINDEX TABLE tablename;

-- Concurrent reindex (PostgreSQL 12+, non-blocking)
REINDEX INDEX CONCURRENTLY indexname;
Use Cases
Daily Maintenance Check
Daily health check routine:
- Check Table Freeze Age Status for critical ages
- Review Dead Tuple Percentage for accumulation
- Verify Auto Vacuum Events are running
- Check Table Bloat Percentage trends
Planning Maintenance Windows
Before scheduling maintenance:
- Identify tables with high Dead Tuple Percentage
- Check Table Bloat Percentage for candidates
- Review Index Bloat Percentage for reindex needs
- Schedule VACUUM FULL or pg_repack for bloated tables
- Plan REINDEX for bloated indexes
Investigating Slow Queries
When queries slow down:
- Check Table Analyze Stats - stale statistics?
- Review Dead Tuple Percentage - high dead tuples?
- Check Table Bloat Percentage - excessive bloat?
- Run ANALYZE and VACUUM as needed
Configuring Autovacuum
Use maintenance data to tune autovacuum:
-- Check autovacuum settings
SELECT name, setting
FROM pg_settings
WHERE name LIKE 'autovacuum%';

-- Per-table autovacuum settings
ALTER TABLE tablename SET (
  autovacuum_vacuum_threshold = 50,
  autovacuum_vacuum_scale_factor = 0.1,
  autovacuum_analyze_threshold = 50,
  autovacuum_analyze_scale_factor = 0.05
);
Tuning guidelines:
- High-churn tables: Lower thresholds, more frequent vacuum
- Large tables: Lower scale factors
- Read-heavy tables: Less aggressive vacuum acceptable
Emergency Freeze Prevention
If a table approaches wraparound:
- Check Table Freeze Age Status for critical tables
- Identify the specific table(s)
- Run emergency vacuum freeze:
-- Check current oldest unfrozen XID
SELECT datname, age(datfrozenxid) FROM pg_database;

-- Vacuum freeze specific table
VACUUM (FREEZE, VERBOSE) tablename;

-- Monitor progress
SELECT relname, n_dead_tup, last_vacuum, last_autovacuum
FROM pg_stat_user_tables
WHERE relname = 'tablename';
Best Practices
Autovacuum Configuration
Recommended settings for most workloads:
-- Increase autovacuum workers
ALTER SYSTEM SET autovacuum_max_workers = 4;

-- More aggressive vacuum
ALTER SYSTEM SET autovacuum_vacuum_scale_factor = 0.05;
ALTER SYSTEM SET autovacuum_analyze_scale_factor = 0.02;

-- Cost limits (adjust based on I/O capacity)
ALTER SYSTEM SET autovacuum_vacuum_cost_limit = 400;

-- Apply changes
SELECT pg_reload_conf();
Monitoring Thresholds
Set up alerts for:
| Metric | Warning | Critical |
|---|---|---|
| Dead Tuple % | > 10% | > 20% |
| Table Bloat % | > 20% | > 40% |
| Index Bloat % | > 30% | > 50% |
| Freeze Age | > 100M | > 150M |
| Time Since Analyze | > 7 days | > 14 days |
Maintenance Schedule
Recommended maintenance cadence:
| Task | Frequency |
|---|---|
| Review maintenance dashboard | Daily |
| ANALYZE heavily modified tables | After bulk loads |
| VACUUM FULL bloated tables | Monthly (maintenance window) |
| REINDEX bloated indexes | Monthly (maintenance window) |
| Check freeze ages | Weekly |
Related Metrics
The Maintenance section uses these metrics from the Metrics Reference:
| Panel | Primary Metrics |
|---|---|
| Analyze Stats | pg_table_stats.last_analyze, pg_table_stats.last_autoanalyze, pg_table_stats.n_mod_since_analyze |
| Freeze Age | pg_table_stats.age_relfrozenxid |
| Dead Tuple % | pg_table_stats.n_dead_tup, pg_table_stats.n_live_tup |
| Vacuum Events | pg_table_stats.vacuum_count, pg_table_stats.autovacuum_count |
| Table Bloat | pg_table_stats.bloat_bytes, pg_table_stats.size_bytes |
| Index Bloat | pg_index_stats.bloat_bytes, pg_index_stats.size_bytes |
Related Guides
- Tables & Indexes - Detailed table analysis
- Performance - Query performance
- Configuration Reference - pgX settings