PostgreSQL Query Analysis
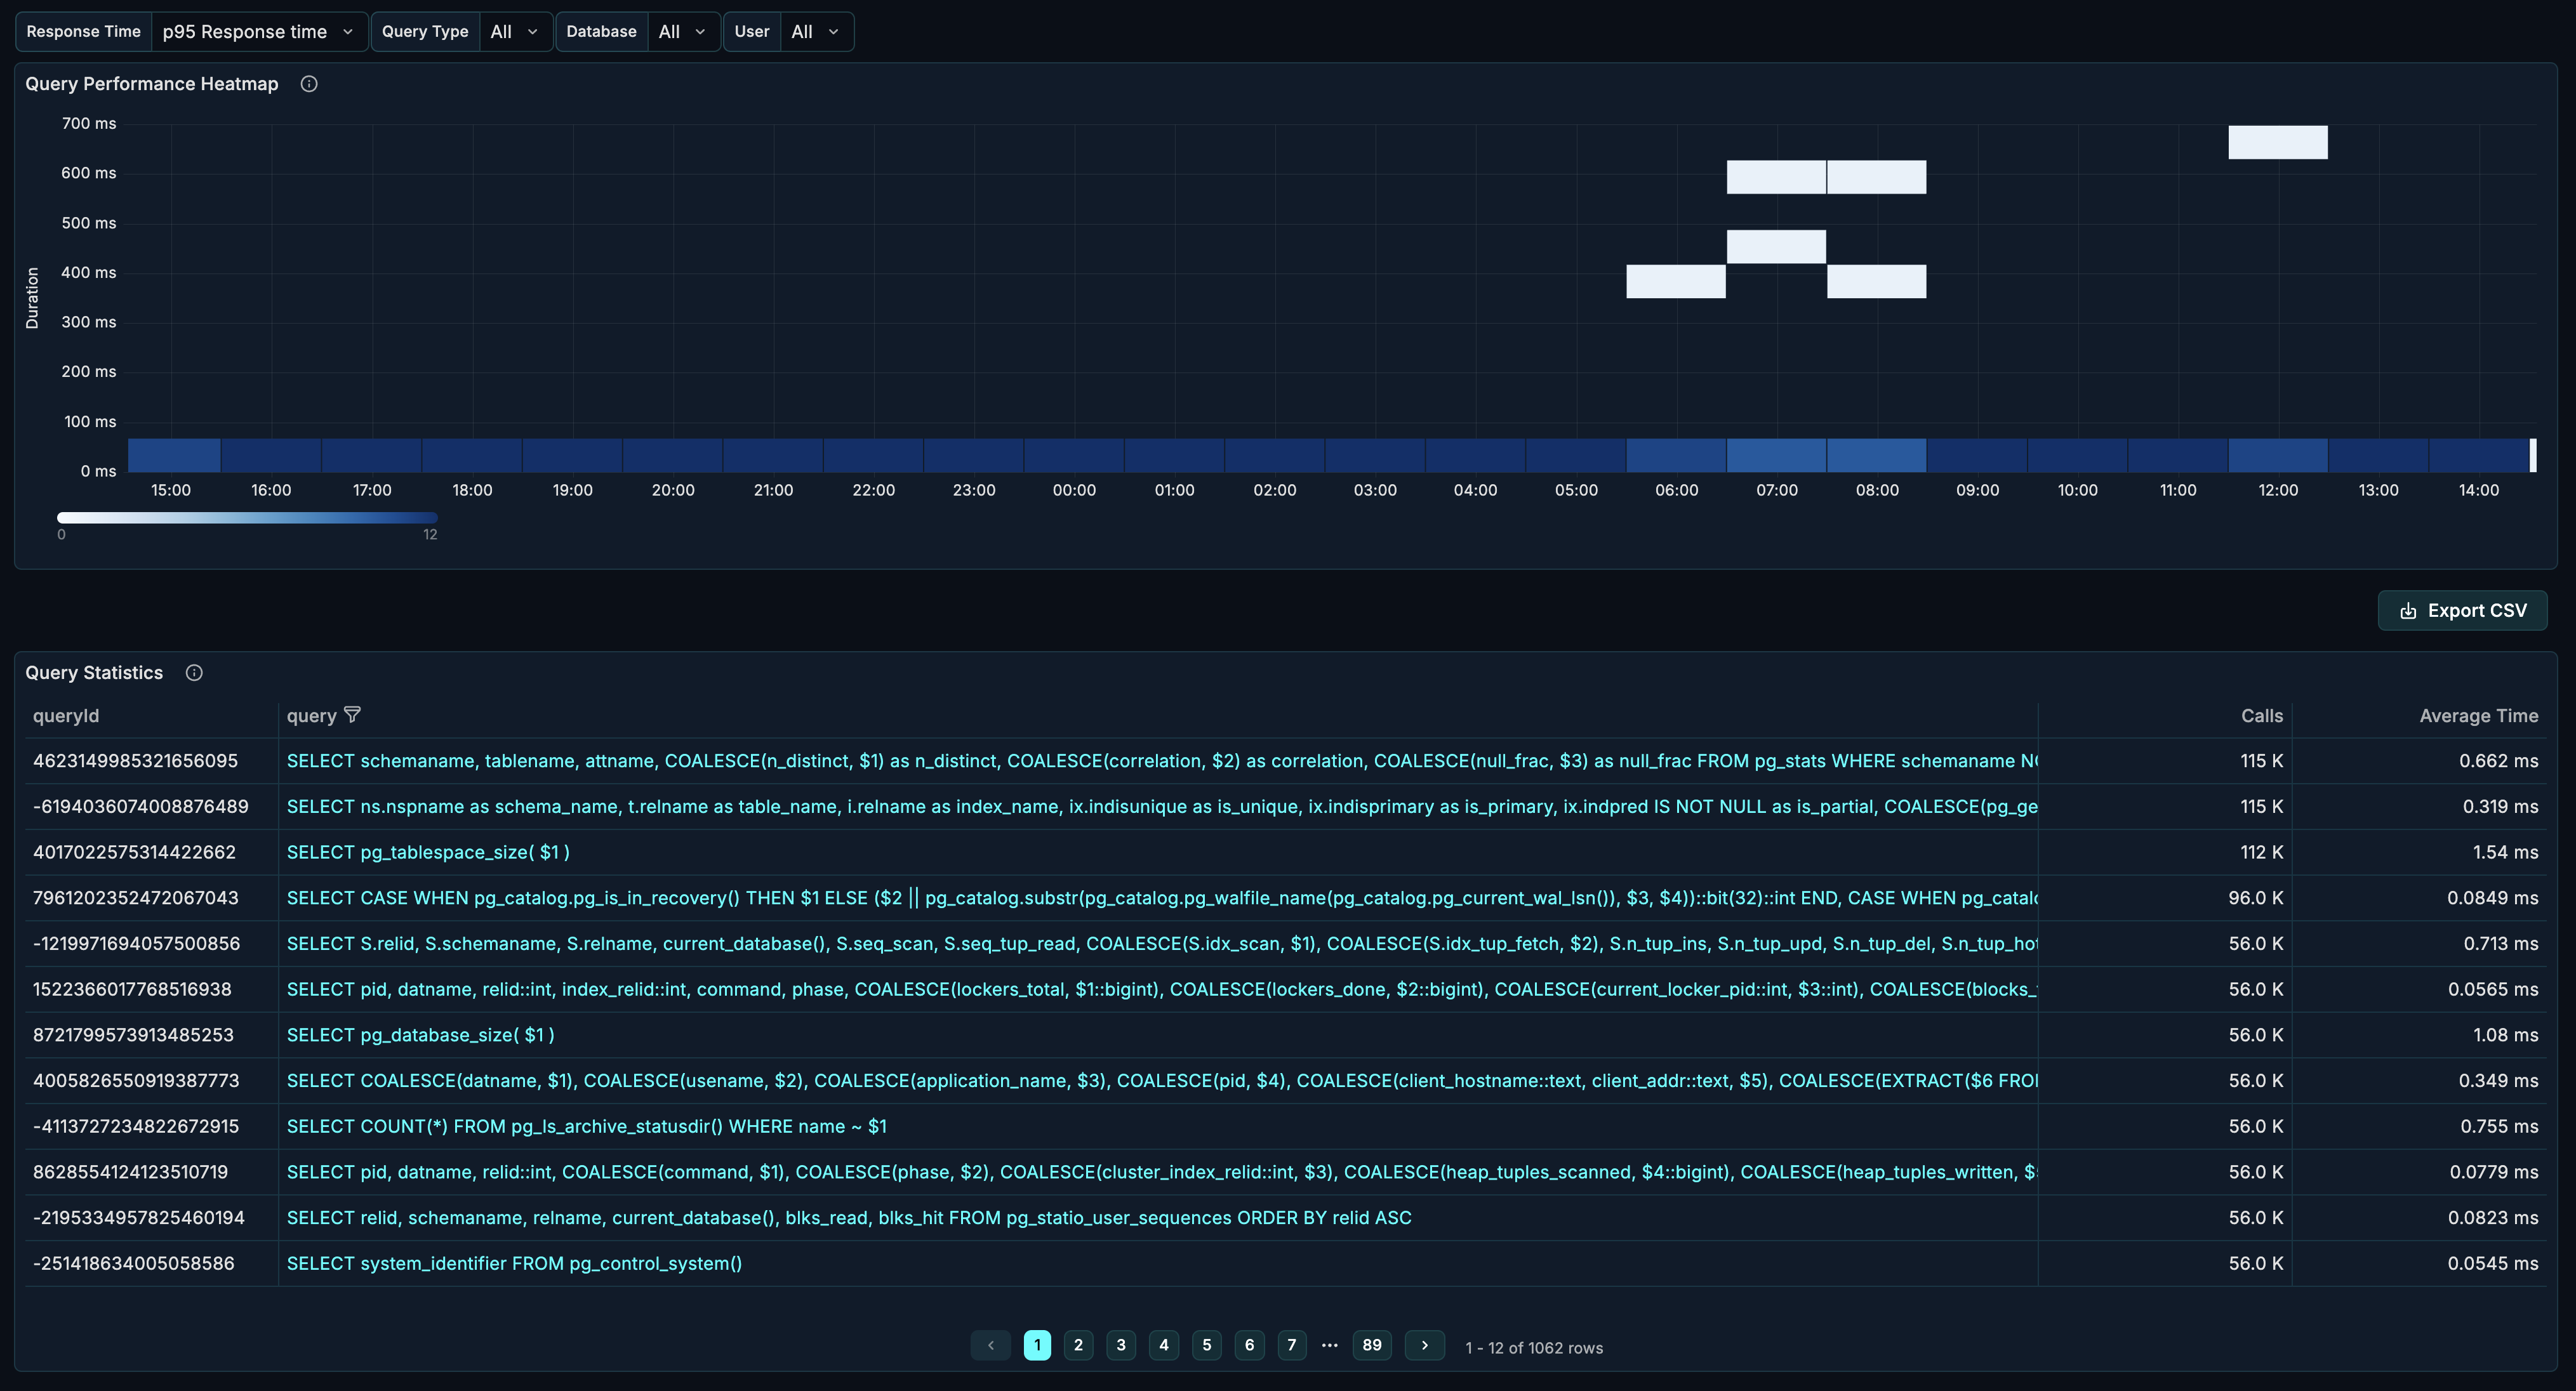
The Queries tab provides deep query-level analysis with powerful filtering capabilities. Use it to identify slow queries, analyze performance patterns, and drill down into specific query behavior.
pgX is the PostgreSQL monitoring app in base14 Scout. Check out base14 pgX.
Dashboard Features
The Queries tab offers:
- Flexible Filtering - Filter by database, user, query type, and response time percentile
- Query Heatmap - Visualize query performance distribution over time
- Query Stats Table - Detailed metrics for individual queries
Filters
The section provides four filters to narrow your analysis.

Response Time Percentile
Select which response time percentile to display in the heatmap.
| Option | Description |
|---|---|
| p50 Response time | Median response time (50th percentile) |
| p90 Response time | 90th percentile - 90% of queries are faster |
| p95 Response time | 95th percentile - typical SLA target |
| p99 Response time | 99th percentile - worst-case performance |
How to use:
- Start with p95 for typical SLA monitoring
- Use p50 to understand normal behavior
- Use p99 to catch tail latency issues
- Compare percentiles to understand response time distribution
Query Type
Filter queries by SQL statement type.
| Option | Description |
|---|---|
| All | Show all query types |
| SELECT | Read queries |
| INSERT | Insert operations |
| UPDATE | Update operations |
| DELETE | Delete operations |
| CREATE | DDL statements |
| BEGIN | Transaction starts |
| COMMIT | Transaction commits |
| ROLLBACK | Transaction rollbacks |
How to use:
- Use All for overall view
- Filter to SELECT to analyze read performance
- Filter to INSERT/UPDATE/DELETE for write analysis
- Check ROLLBACK frequency to understand transaction failures
Database
Filter queries to a specific database.
How to use:
- Use All to see cluster-wide patterns
- Select specific database for focused analysis
- Compare query patterns across databases
User
Filter queries by the PostgreSQL user/role executing them.
How to use:
- Identify which users are running expensive queries
- Compare application vs admin query patterns
- Isolate queries from specific services
Queries Heatmap
The heatmap visualization shows query response time distribution over time.
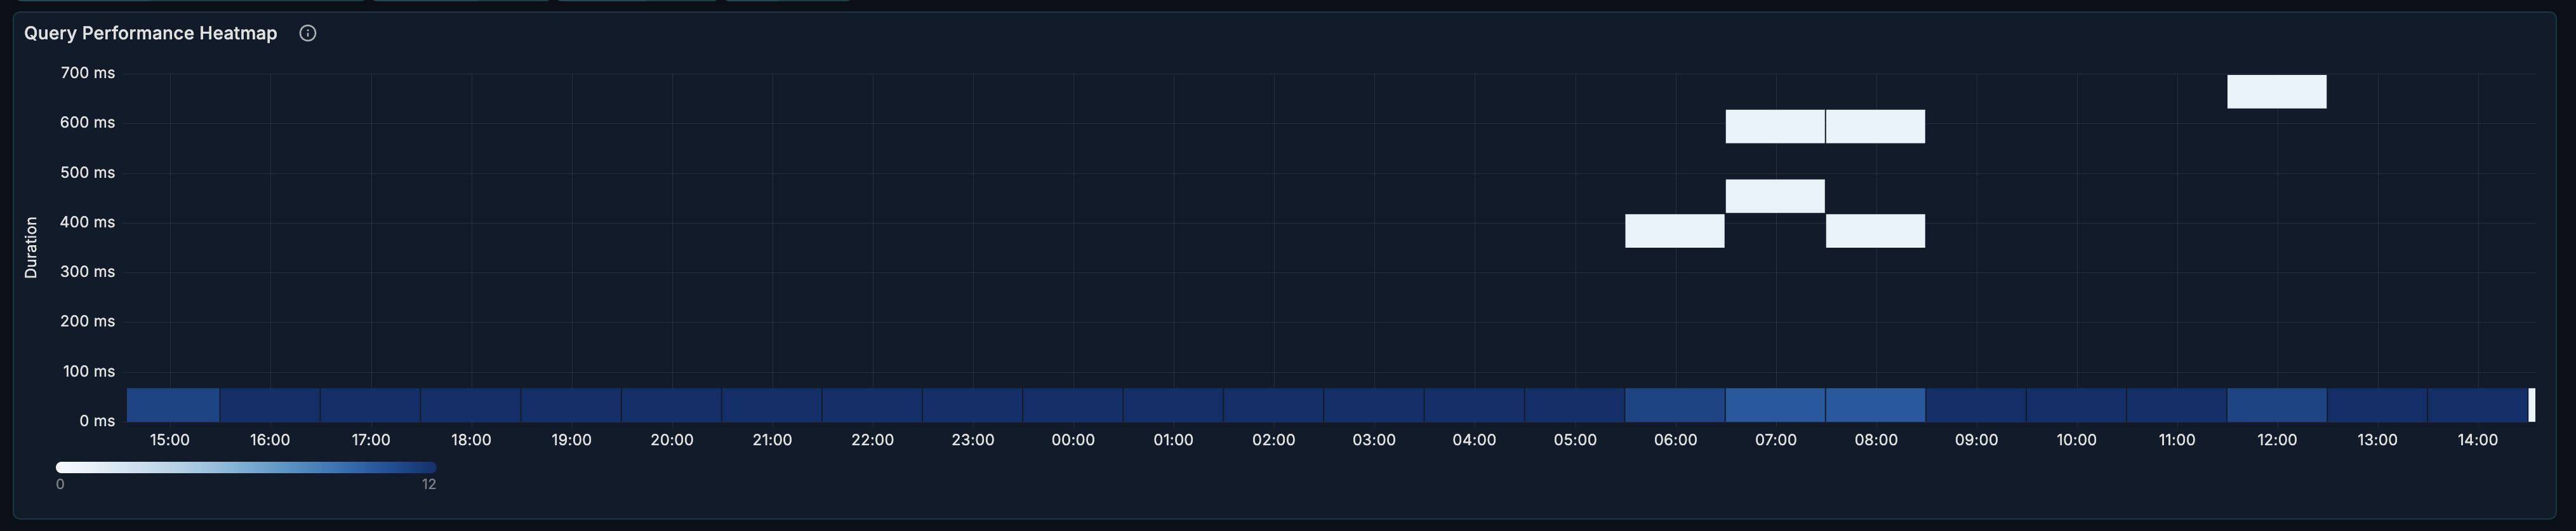
Reading the Heatmap
- X-axis: Time
- Y-axis: Response time buckets
- Color intensity: Number of queries in that bucket
Interpretation:
- Dense color at low Y values = most queries are fast
- Color spread upward = response time variance
- Spikes at high Y values = slow query incidents
- Horizontal bands = consistent performance patterns
Common Patterns
| Pattern | Meaning | Action |
|---|---|---|
| Tight band at bottom | Consistent fast performance | Healthy - maintain current state |
| Spreading upward over time | Performance degradation | Investigate index/bloat issues |
| Periodic spikes | Scheduled jobs or traffic patterns | Review job timing and impact |
| Sudden vertical spread | Incident occurring | Immediate investigation needed |
| Two distinct bands | Bimodal query performance | May have two query categories |
Query Stats Table
The stats table provides detailed metrics for each query.
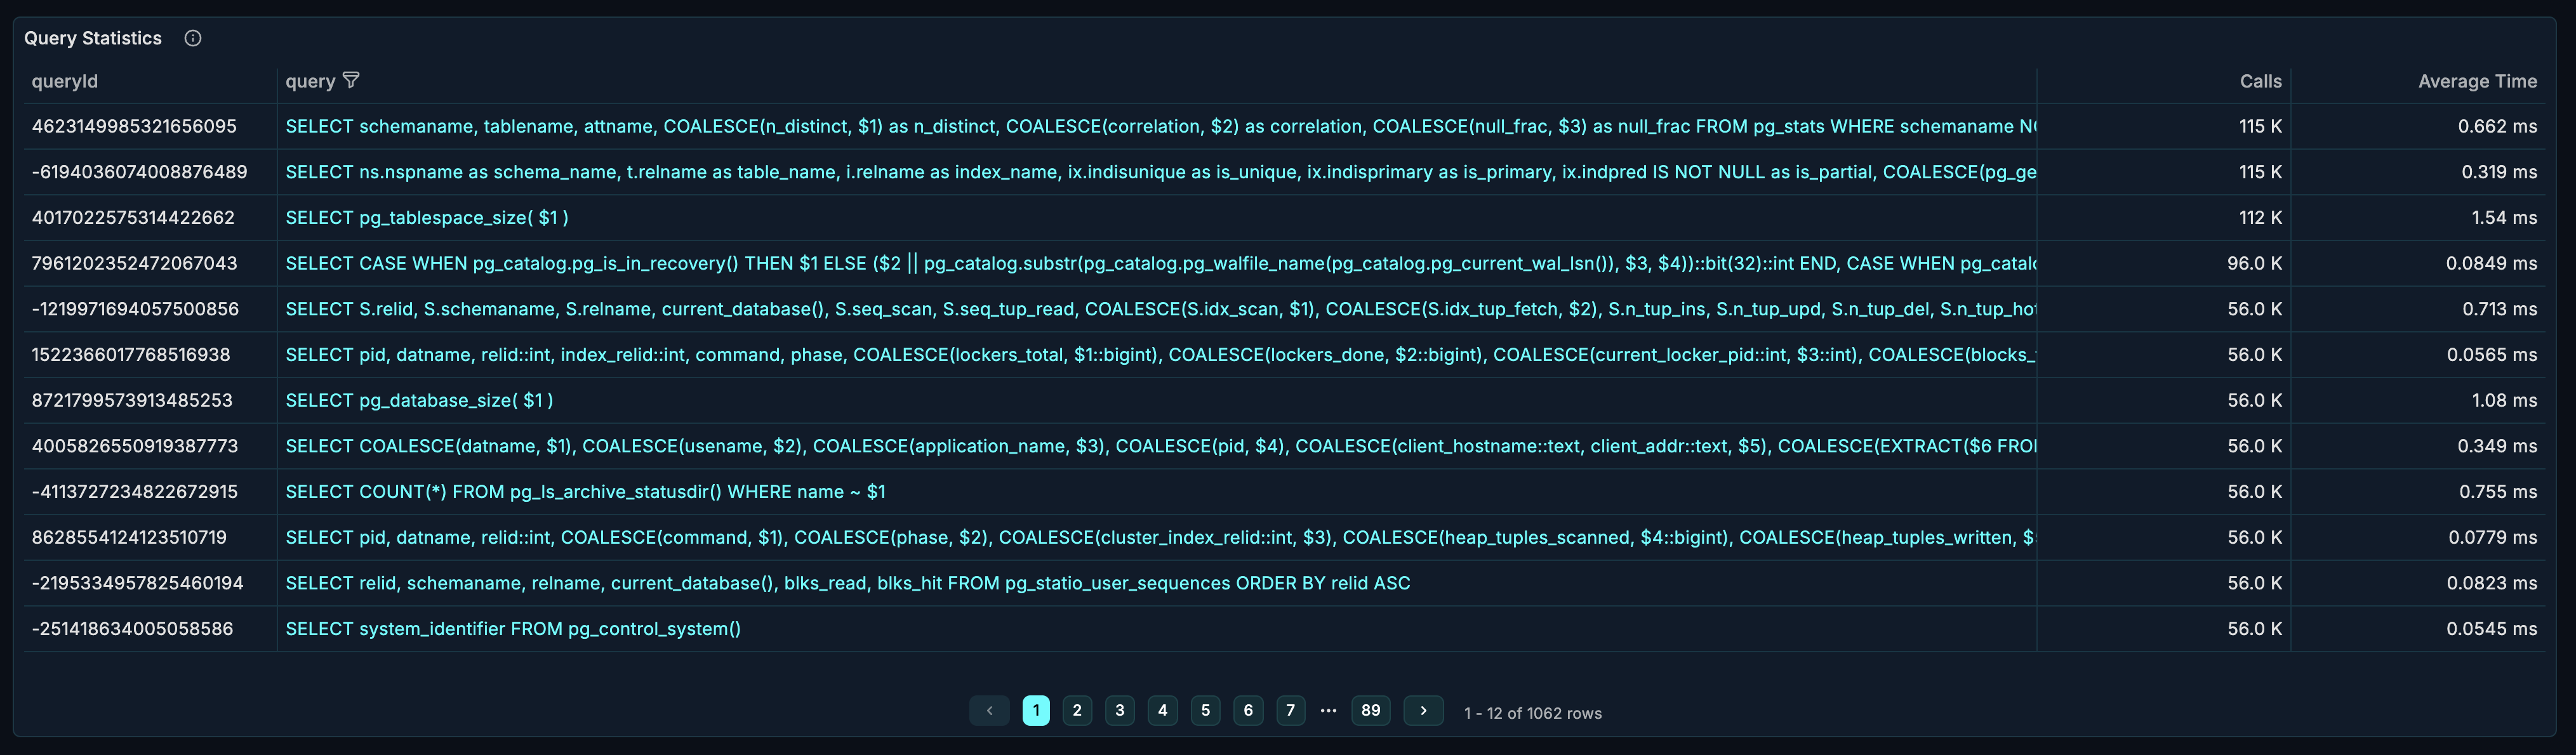
Table Columns
| Column | Description |
|---|---|
| Query | The normalized SQL query text |
| Query ID | Unique identifier for the query |
| Calls | Number of times executed |
| Average Time | Mean execution time |
Sorting and Analysis
Find most frequent queries:
- Sort by "Calls" descending
- These queries have the most impact on overall load
- Even small improvements yield significant gains
Find slowest queries:
- Sort by "Average Time" descending
- Focus optimization on these first
- Check if they're missing indexes
Calculate impact:
- Impact = Calls × Average Time
- High-call + slow = highest priority
- Low-call + slow = may be acceptable
Drill-Down
Click on a query to access detailed analysis panels:
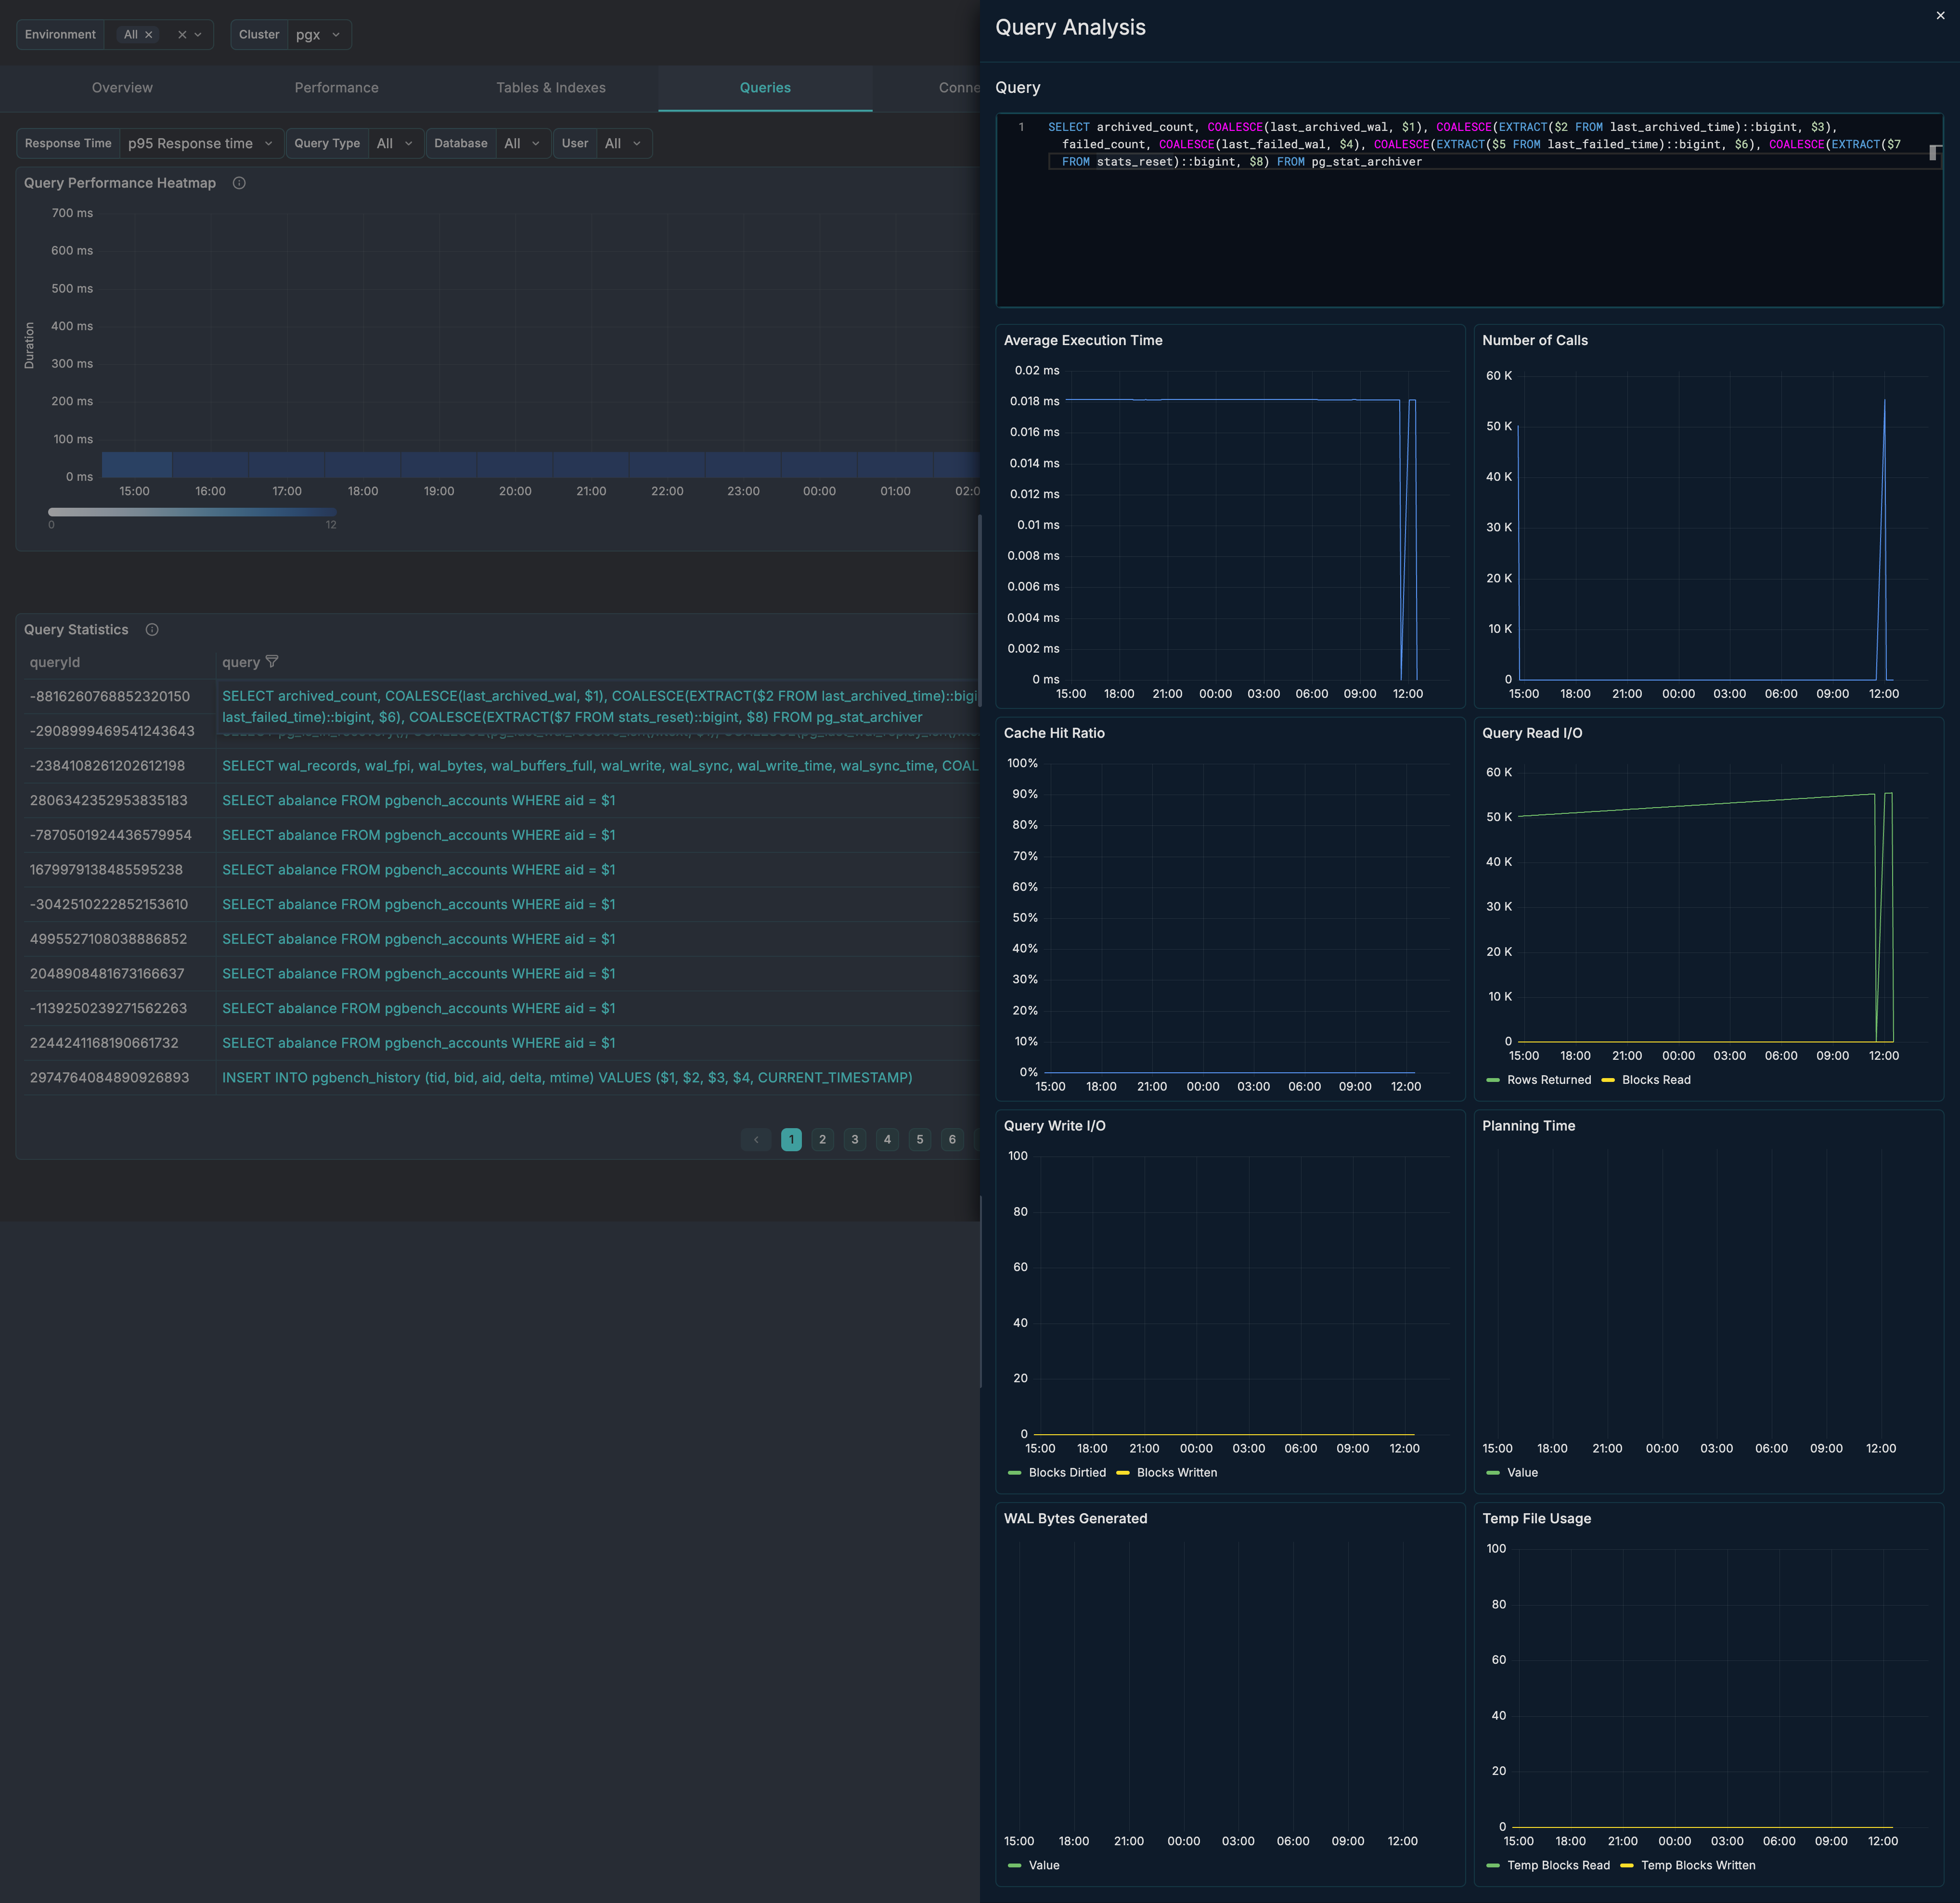
- Average Execution Time - Time-series of response time
- Number of Calls - Call frequency over time
- Cache Hit Ratio - Buffer cache efficiency for this query
- Read I/O - Rows returned and blocks read
- Write I/O - Blocks dirtied and written
- Planning Time - Query planning overhead
- WAL Bytes Generated - Write-ahead log impact
- Temp File Usage - Temporary file activity
Use Cases
Finding Problem Queries
- Set Response Time to p95
- Set Query Type to All
- Look for queries with high Average Time
- Click to drill down into specific query
- Analyze cache hit ratio and I/O patterns
- Check for missing indexes or optimization opportunities
Analyzing Read Workload
- Set Query Type to SELECT
- Review heatmap for response time distribution
- Sort stats table by Calls to find hottest queries
- Check if frequently-run queries are well-optimized
- Look for sequential scans that need indexes
Analyzing Write Workload
- Set Query Type to INSERT, UPDATE, or DELETE
- Review call patterns and timing
- Check WAL Bytes Generated for write impact
- Look for bulk operations causing load
- Consider batching or off-peak scheduling
User-Based Analysis
- Select specific User from dropdown
- Compare query patterns between users
- Identify which application/service generates load
- Use for capacity planning per service
SLA Monitoring
- Set Response Time to your SLA percentile (e.g., p95)
- Watch heatmap for breaches
- Identify queries causing SLA violations
- Create alerts based on response time thresholds
Post-Incident Analysis
- Set time range to incident period
- Review heatmap for anomalies
- Identify queries that degraded
- Compare with normal period
- Document root cause
Query Analysis Deep Dive
When you click on a query in the stats table, you get access to detailed time-series panels:
Average Execution Time
Track how the query's response time varies over time. Look for:
- Degradation trends
- Correlation with load
- Impact of optimizations
Cache Hit Ratio
Monitor buffer cache efficiency for this specific query:
- High ratio (> 99%) = good caching
- Low ratio = disk I/O overhead
- Consider memory tuning or query optimization
Read I/O Analysis
- Rows Returned - Data returned to client
- Blocks Read - Disk blocks accessed
- High blocks/low rows = inefficient query
Write I/O Analysis
- Blocks Dirtied - Pages modified
- Blocks Written - Pages flushed to disk
- High values indicate write-heavy operations
Planning Time
Query planning overhead:
- High planning time = complex query
- Consider prepared statements
- May indicate statistics issues
WAL Impact
Write-ahead log bytes generated:
- High values = significant durability overhead
- Consider batching writes
- May impact replication lag
Temp File Usage
Temporary file activity:
- Indicates memory pressure
- Query may need more
work_mem - Consider query optimization
Related Metrics
The Queries section uses these metrics from the Metrics Reference:
| Panel | Primary Metrics |
|---|---|
| Heatmap | pg_statement_stats.total_time_ms, pg_statement_stats.calls |
| Stats Table | pg_statement_stats.calls, pg_statement_stats.avg_time_ms |
| Execution Time | pg_statement_stats.avg_time_ms |
| Cache Hit | pg_statement_stats.shared_blks_hit, pg_statement_stats.shared_blks_read |
| Read I/O | pg_statement_stats.rows, pg_statement_stats.shared_blks_* |
| Write I/O | pg_statement_stats.shared_blks_dirtied, pg_statement_stats.shared_blks_written |
| Planning Time | pg_statement_stats.total_plan_time_ms |
| WAL Bytes | pg_statement_stats.wal_bytes |
| Temp Files | pg_statement_stats.temp_blks_read, pg_statement_stats.temp_blks_written |
Related Guides
- Performance - Higher-level performance view
- Tables & Indexes - Optimize tables and indexes
- Locks & Waits - Investigate blocking issues