Application Instrumentation
Add observability to your applications with OpenTelemetry. This guide helps you choose the right approach and find documentation for your stack.
Choose Your Approach
| Approach | Best For | Setup Time | Flexibility |
|---|---|---|---|
| Auto-Instrumentation | Quick start, standard frameworks | Minutes | Pre-defined spans |
| Custom Instrumentation | Business metrics, fine control | Hours | Full control |
| AI Observability | LLM calls, agents, token/cost tracking | Hours | GenAI semantic conventions |
| All three | Production AI applications | Hours | Best of all |
Quick Reference Matrix
Find your language and see what's available:
| Language | Auto-Instrumentation | Custom Instrumentation |
|---|---|---|
| Python | Django, Flask, FastAPI, Celery | Python SDK |
| Node.js | Express, Fastify, NestJS, Next.js, Node.js | Node SDK |
| Java | Spring Boot, Quarkus | Java SDK |
| Go | Go, Axum | Go SDK |
| Ruby | Rails, Rails Legacy | Ruby SDK |
| PHP | Laravel | PHP SDK |
| .NET | ASP.NET Core | C# SDK |
| Elixir | Phoenix | - |
| Rust | - | Rust SDK |
| Browser | React | Browser SDK |
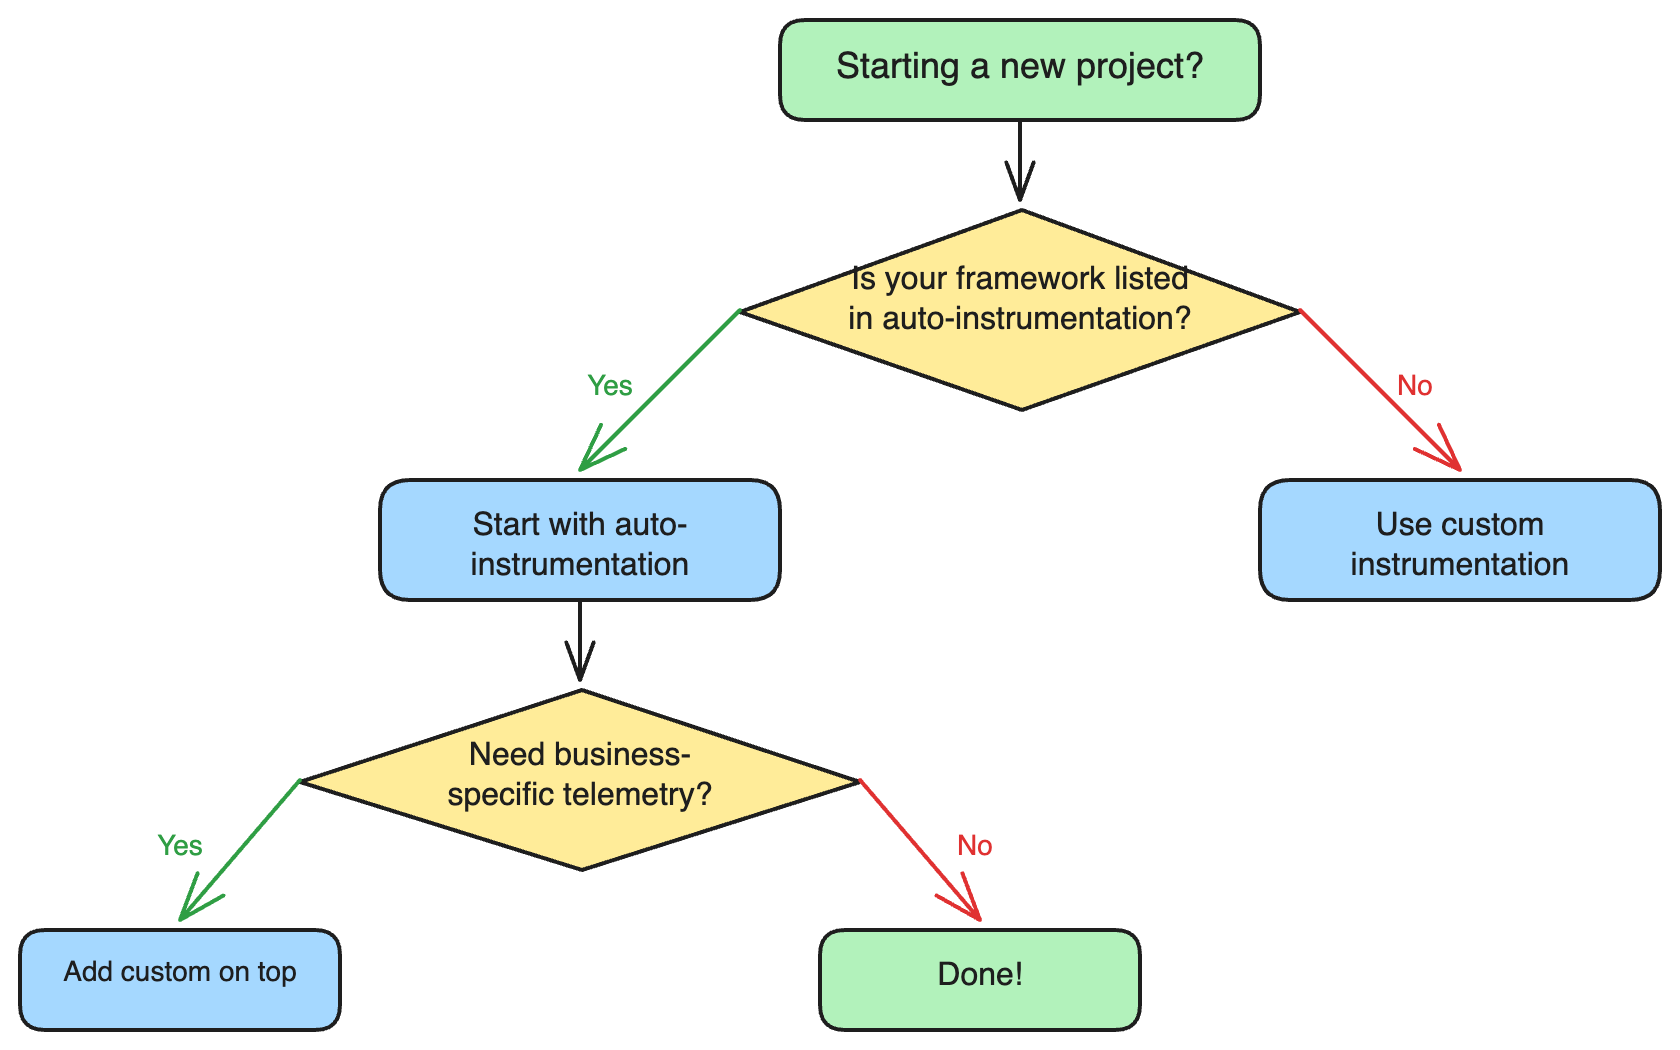
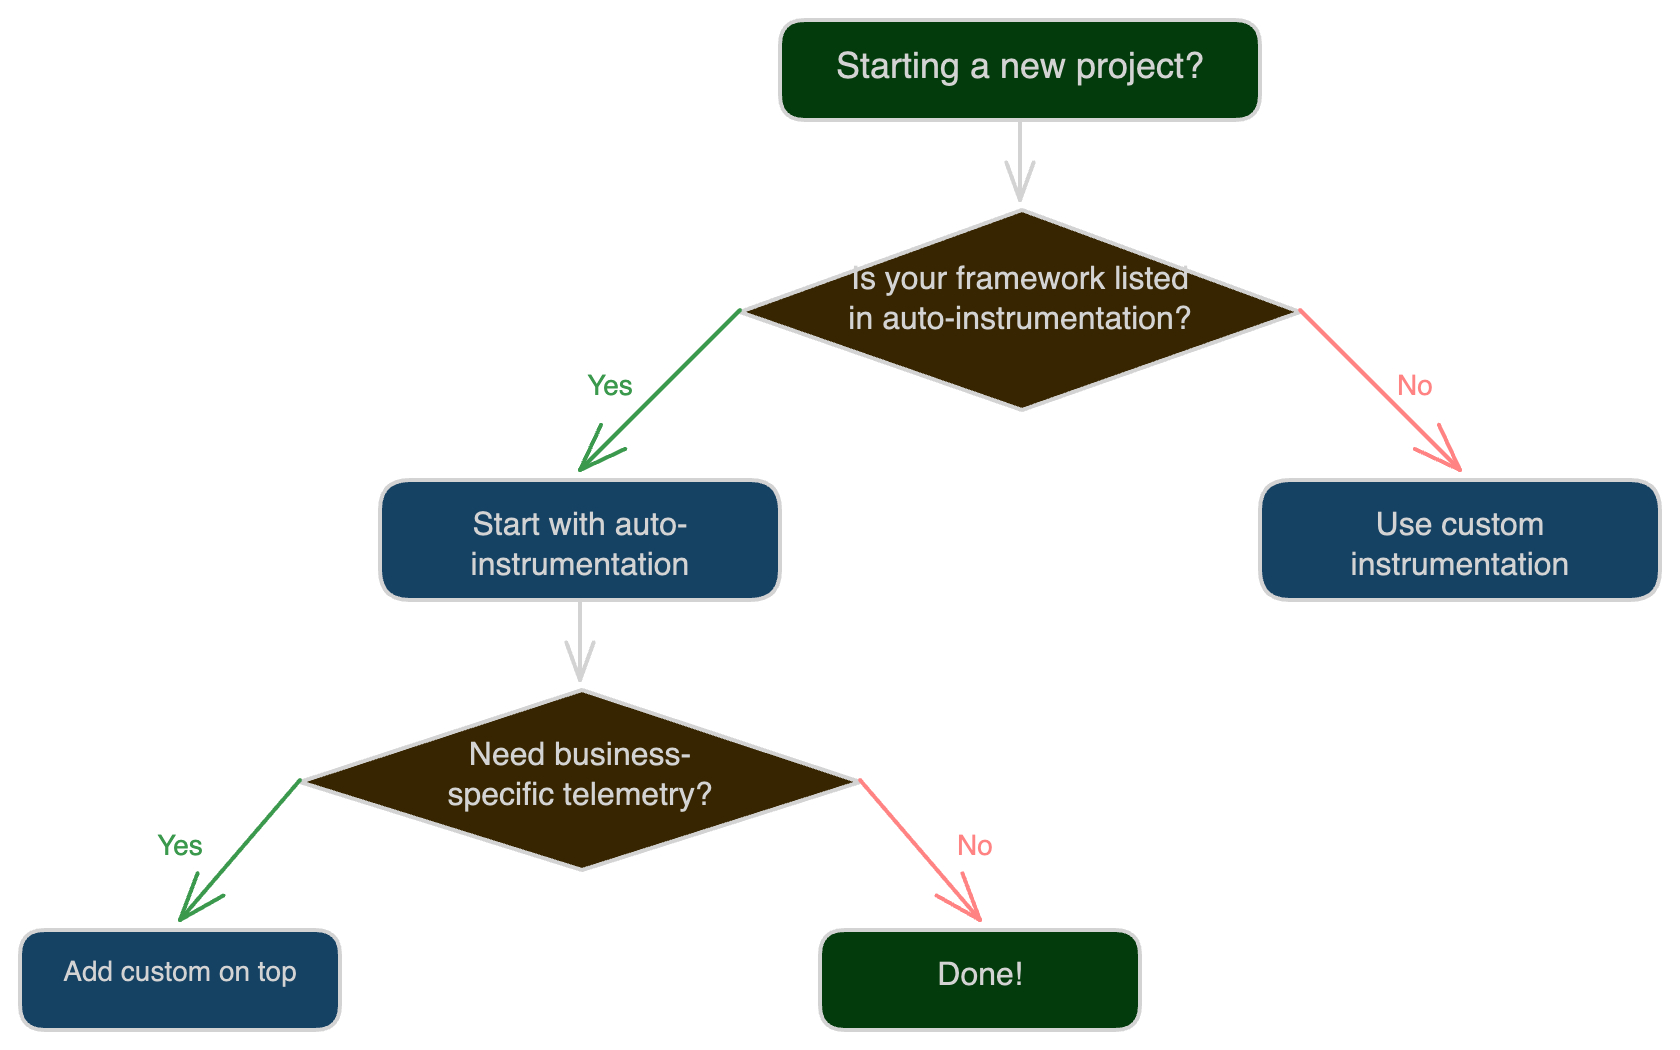
Decision Guide
What Gets Instrumented
Auto-Instrumentation Captures
- HTTP requests - Incoming and outgoing, with method, status, URL
- Database queries - SQL statements, connection info, duration
- External API calls - gRPC, REST, message queues
- Framework internals - Middleware, routing, templating
Custom Instrumentation Adds
- Business transactions - Order processing, payment flows
- User context - User ID, tenant ID, session info
- Custom metrics - Conversion rates, queue depths, cache hit ratios
- Domain-specific spans - Algorithm execution, batch processing
AI Observability Adds
- LLM call tracing - Model, provider, token counts, cost per call
- Agent pipeline spans - Which agent ran, how long, what failed
- Cost attribution - Cost by model, agent, or business operation
- Quality evaluation - LLM output scores tracked over time
- PII-safe telemetry - Prompt/completion scrubbing before export
Next Steps
- New to OpenTelemetry? Start with auto-instrumentation
- Need business metrics? Add custom instrumentation
- Need to collect data? Set up the OpenTelemetry Collector
Was this page helpful?