GitHub Actions Observability with OpenTelemetry
CI/CD pipelines are critical infrastructure. Builds slow down over weeks, flaky tests waste developer time, and when a pipeline breaks, diagnosing the root cause means clicking through GitHub's UI one run at a time.
The Scout OpenTelemetry CI/CD Action solves this by exporting your GitHub Actions workflow runs as OpenTelemetry traces. Each workflow becomes a trace, each job becomes a child span, and each step becomes a span within its job. You get the same structured observability for your pipelines that you already have for your applications.
What You'll Accomplish
- Export GitHub Actions workflows as OpenTelemetry traces to Scout
- Visualize pipeline execution as a trace waterfall (workflow → jobs → steps)
- Identify slow steps and failure patterns across your CI/CD pipelines
- Set up monitoring without modifying your existing workflows
How It Works
The action runs after your workflow completes and uses the GitHub API to fetch the full run data — jobs, steps, timestamps, and outcomes. It converts this data into OpenTelemetry traces following the CICD semantic conventions and exports them to your OTLP endpoint.
The resulting trace hierarchy looks like this:
Workflow Run (root span)
├── Job: build (child span)
│   ├── Step: Checkout code
│   ├── Step: Install dependencies
│   ├── Step: Run tests
│   └── Step: Build artifact
└── Job: deploy (child span)
    ├── Step: Download artifact
    └── Step: Deploy to production
Each span includes timing data, status (success/failure), and GitHub metadata like the commit SHA, branch, actor, and run URL.
Prerequisites
- A Scout account with OAuth2 credentials (client ID, client secret, and tenant name)
- A GitHub repository with one or more workflows
Option A: Workflow Run Trigger (Recommended)
This approach creates a dedicated monitoring workflow that triggers automatically after any workflow completes. It requires no changes to your existing workflows.
Create a new file at .github/workflows/otel-export.yml:
name: Export CI/CD Traces to Scout

on:
  workflow_run:
    workflows: ["*"]
    types:
      - completed

jobs:
  otel-export:
    runs-on: ubuntu-latest
    steps:
      - name: Export workflow trace
        uses: base-14/otel-cicd-action@v1.0.0
        with:
          otlpEndpoint: ${{ secrets.SCOUT_OTLP_ENDPOINT }}
          otelServiceName: my-repo-ci
          githubToken: ${{ secrets.GITHUB_TOKEN }}
          runId: ${{ github.event.workflow_run.id }}
          tokenUrl: >-
            https://id.b14.dev/realms/${{ secrets.SCOUT_TENANT }}/protocol/openid-connect/token
          appName: ${{ secrets.SCOUT_CLIENT_ID }}
          apiKey: ${{ secrets.SCOUT_CLIENT_SECRET }}
          audience: b14collector
Required Secrets
Add these secrets to your repository under Settings → Secrets and variables → Actions:
| Secret | Description |
|---|---|
SCOUT_OTLP_ENDPOINT | Your Scout OTLP endpoint (provided via email) |
SCOUT_TENANT | Your Scout tenant name |
SCOUT_CLIENT_ID | OAuth2 client ID from Scout |
SCOUT_CLIENT_SECRET | OAuth2 client secret from Scout |
GITHUB_TOKEN is provided automatically by GitHub Actions.
How It Works
The workflow_run event fires after any workflow in your repository
completes. The runId input points to the completed workflow's run ID
(github.event.workflow_run.id), so the action fetches and exports that
run's data — not its own.
Option B: In-Workflow Job
If you prefer to keep the export step within a specific workflow, add it as a final job that runs regardless of whether previous jobs succeed or fail.
name: CI Pipeline

on:
  push:
    branches: [main]
  pull_request:

jobs:
  build:
    runs-on: ubuntu-latest
    steps:
      - uses: actions/checkout@v4
      - name: Install dependencies
        run: npm ci
      - name: Run tests
        run: npm test
      - name: Build
        run: npm run build

  deploy:
    needs: build
    runs-on: ubuntu-latest
    steps:
      - name: Deploy
        run: echo "Deploying..."

  otel-export:
    needs: [build, deploy]
    if: always()
    runs-on: ubuntu-latest
    steps:
      - name: Export workflow trace
        uses: base-14/otel-cicd-action@v1.0.0
        with:
          otlpEndpoint: ${{ secrets.SCOUT_OTLP_ENDPOINT }}
          otelServiceName: my-repo-ci
          githubToken: ${{ secrets.GITHUB_TOKEN }}
          tokenUrl: >-
            https://id.b14.dev/realms/${{ secrets.SCOUT_TENANT }}/protocol/openid-connect/token
          appName: ${{ secrets.SCOUT_CLIENT_ID }}
          apiKey: ${{ secrets.SCOUT_CLIENT_SECRET }}
          audience: b14collector
Key details:
needs: [build, deploy]— waits for all jobs to finish before exportingif: always()— ensures the export runs even if a previous job fails, so you capture traces for broken builds toorunIdis omitted — it defaults to the current workflow run ID
Configuration Reference
| Input | Required | Default | Description |
|---|---|---|---|
otlpEndpoint | Yes | — | OTLP endpoint to export traces to |
otlpHeaders | No | "" | Additional HTTP headers for the OTLP endpoint |
otelServiceName | No | "" | OpenTelemetry service name for the exported traces |
githubToken | No | secrets.GITHUB_TOKEN | Repository token with workflow read permissions |
runId | No | env.GITHUB_RUN_ID | Workflow run ID to export (defaults to the current run) |
extraAttributes | No | — | Extra resource attributes to add to each span |
tokenUrl | No | "" | OAuth2 token endpoint URL for client_credentials flow |
appName | No | "" | OAuth2 client ID (application name) for client_credentials flow |
apiKey | No | "" | OAuth2 client secret (API key) for client_credentials flow |
audience | No | "" | OAuth2 audience for client_credentials flow |
The action also produces one output:
traceId— the OpenTelemetry trace ID of the root span, which you can use to link directly to the trace in Scout
Viewing Traces in Scout
Once the action runs, your workflow traces appear in Scout's trace explorer - traceX.
Finding Your Traces
- Open traceX in Scout
- Filter by the
otelServiceNameyou configured (e.g.,my-repo-ci) - You'll see one trace per workflow run, with the workflow name as the root span
Reading the Trace Waterfall
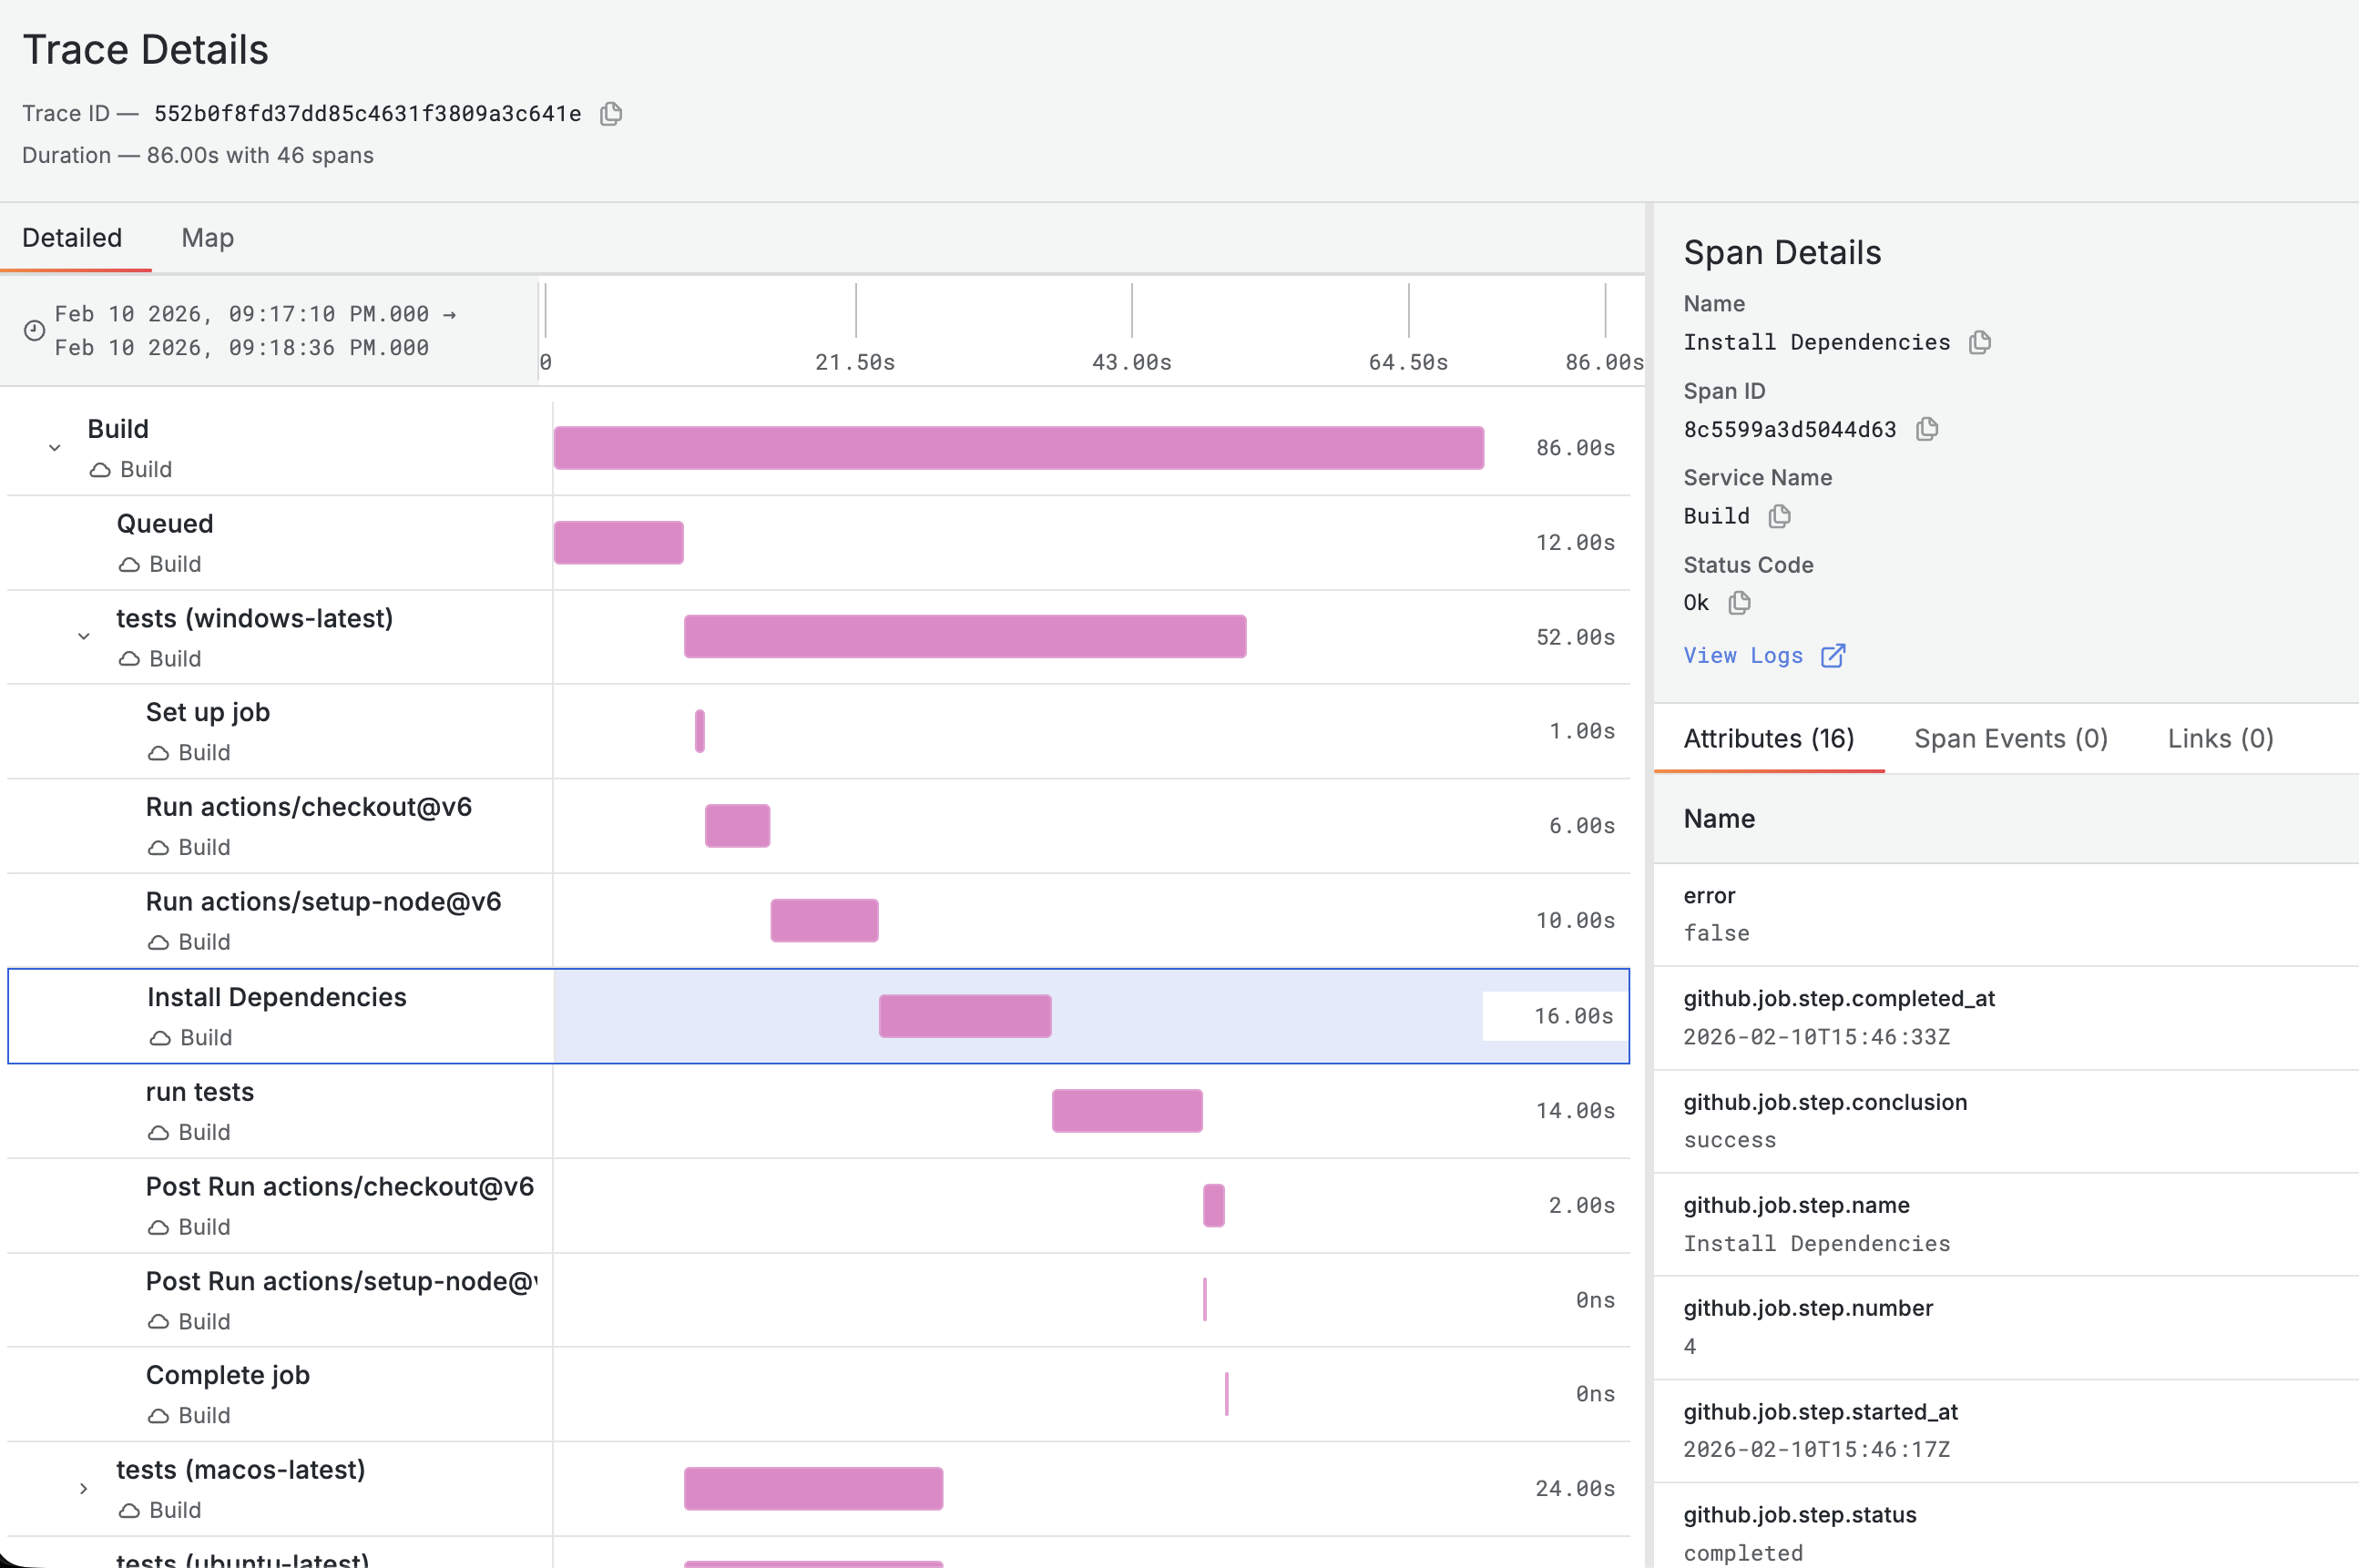
The trace waterfall shows the full execution timeline:
- Root span — the workflow run, showing total duration and final status
- Job spans — each job appears as a child of the root span, with its own start time and duration
- Step spans — each step within a job is a child of the job span
Parallel jobs appear side by side in the waterfall, making it easy to see which jobs ran concurrently and which ran sequentially. Failed steps are highlighted, so you can immediately spot where a pipeline broke.
Useful Filters
service.name— filter by repository or project- Status — filter for failed traces to see broken builds
- Duration — sort by duration to find your slowest pipelines
Practical Example: Finding Slow Steps
A common use case is identifying which steps slow down your pipeline over time. Here's how to use traces in Scout to find bottlenecks.
Scenario
Your CI pipeline used to complete in 3 minutes but now takes 8 minutes. You want to find out which step is responsible.
Approach
- Open a recent trace for the workflow in Scout
- Look at the trace waterfall — the longest spans immediately stand out
- Compare with an older trace to see what changed
Common Bottlenecks
| Symptom | Likely cause | Fix |
|---|---|---|
| Long checkout step | Large repository or LFS objects | Use fetch-depth: 1 for shallow clone |
| Slow dependency install | No caching configured | Add dependency caching (actions/cache) |
| Long test suite | Tests running sequentially | Parallelize test jobs or use test sharding |
| Slow Docker build | No layer caching | Use Docker build cache or registry caching |
| Long deployment step | Waiting for health checks or approvals | Review timeout and health check configuration |
By comparing traces across multiple runs, you can also spot regressions — a step that was 30 seconds last week but is now 2 minutes points to a specific change worth investigating.
Troubleshooting
Action Fails with 401 Unauthorized
This typically means the Scout OAuth2 credentials are incorrect or the token request is failing. Verify your credentials by requesting a token directly:
curl -X POST "$SCOUT_TOKEN_URL" \
  -H "Content-Type: application/x-www-form-urlencoded" \
  -d "grant_type=client_credentials&client_id=$CLIENT_ID&client_secret=$API_KEY&audience=$AUDIENCE"
If this returns a valid access token, your credentials are correct and the
issue is likely in how the secrets are configured in your repository. If you
get an error, double-check the tokenUrl, appName, apiKey, and
audience values in your Scout account.
No Traces Appearing in Scout
- Check the action logs — expand the "Export workflow trace" step in the GitHub Actions UI to see any error messages
- Verify credentials — ensure
SCOUT_TENANT,SCOUT_CLIENT_ID, andSCOUT_CLIENT_SECRETare set correctly in repository secrets - Check the endpoint — confirm
otlpEndpointmatches the Scout endpoint provided to you during onboarding - Verify network access — GitHub-hosted runners need outbound HTTPS access to both the Scout API and the identity provider
Workflow Run Trigger Not Firing
The workflow_run event only triggers for workflows on the default branch.
If you're testing on a feature branch, use Option B (in-workflow job)
instead, or merge the otel-export.yml file to your default branch first.
Traces Missing Steps
If some steps don't appear in the trace, they may have been skipped by
conditional logic (if: conditions). Skipped steps are not included in
the GitHub API response and won't appear as spans.
What's Next?
- Create Your First Dashboard — build dashboards to visualize CI/CD metrics over time
- Creating Alerts with LogX — set up alerts for pipeline failures or duration regressions
- Quick Start — get Scout set up for application observability alongside your CI/CD traces