Scout MCP: Query Your Observability Data Through AI Assistants
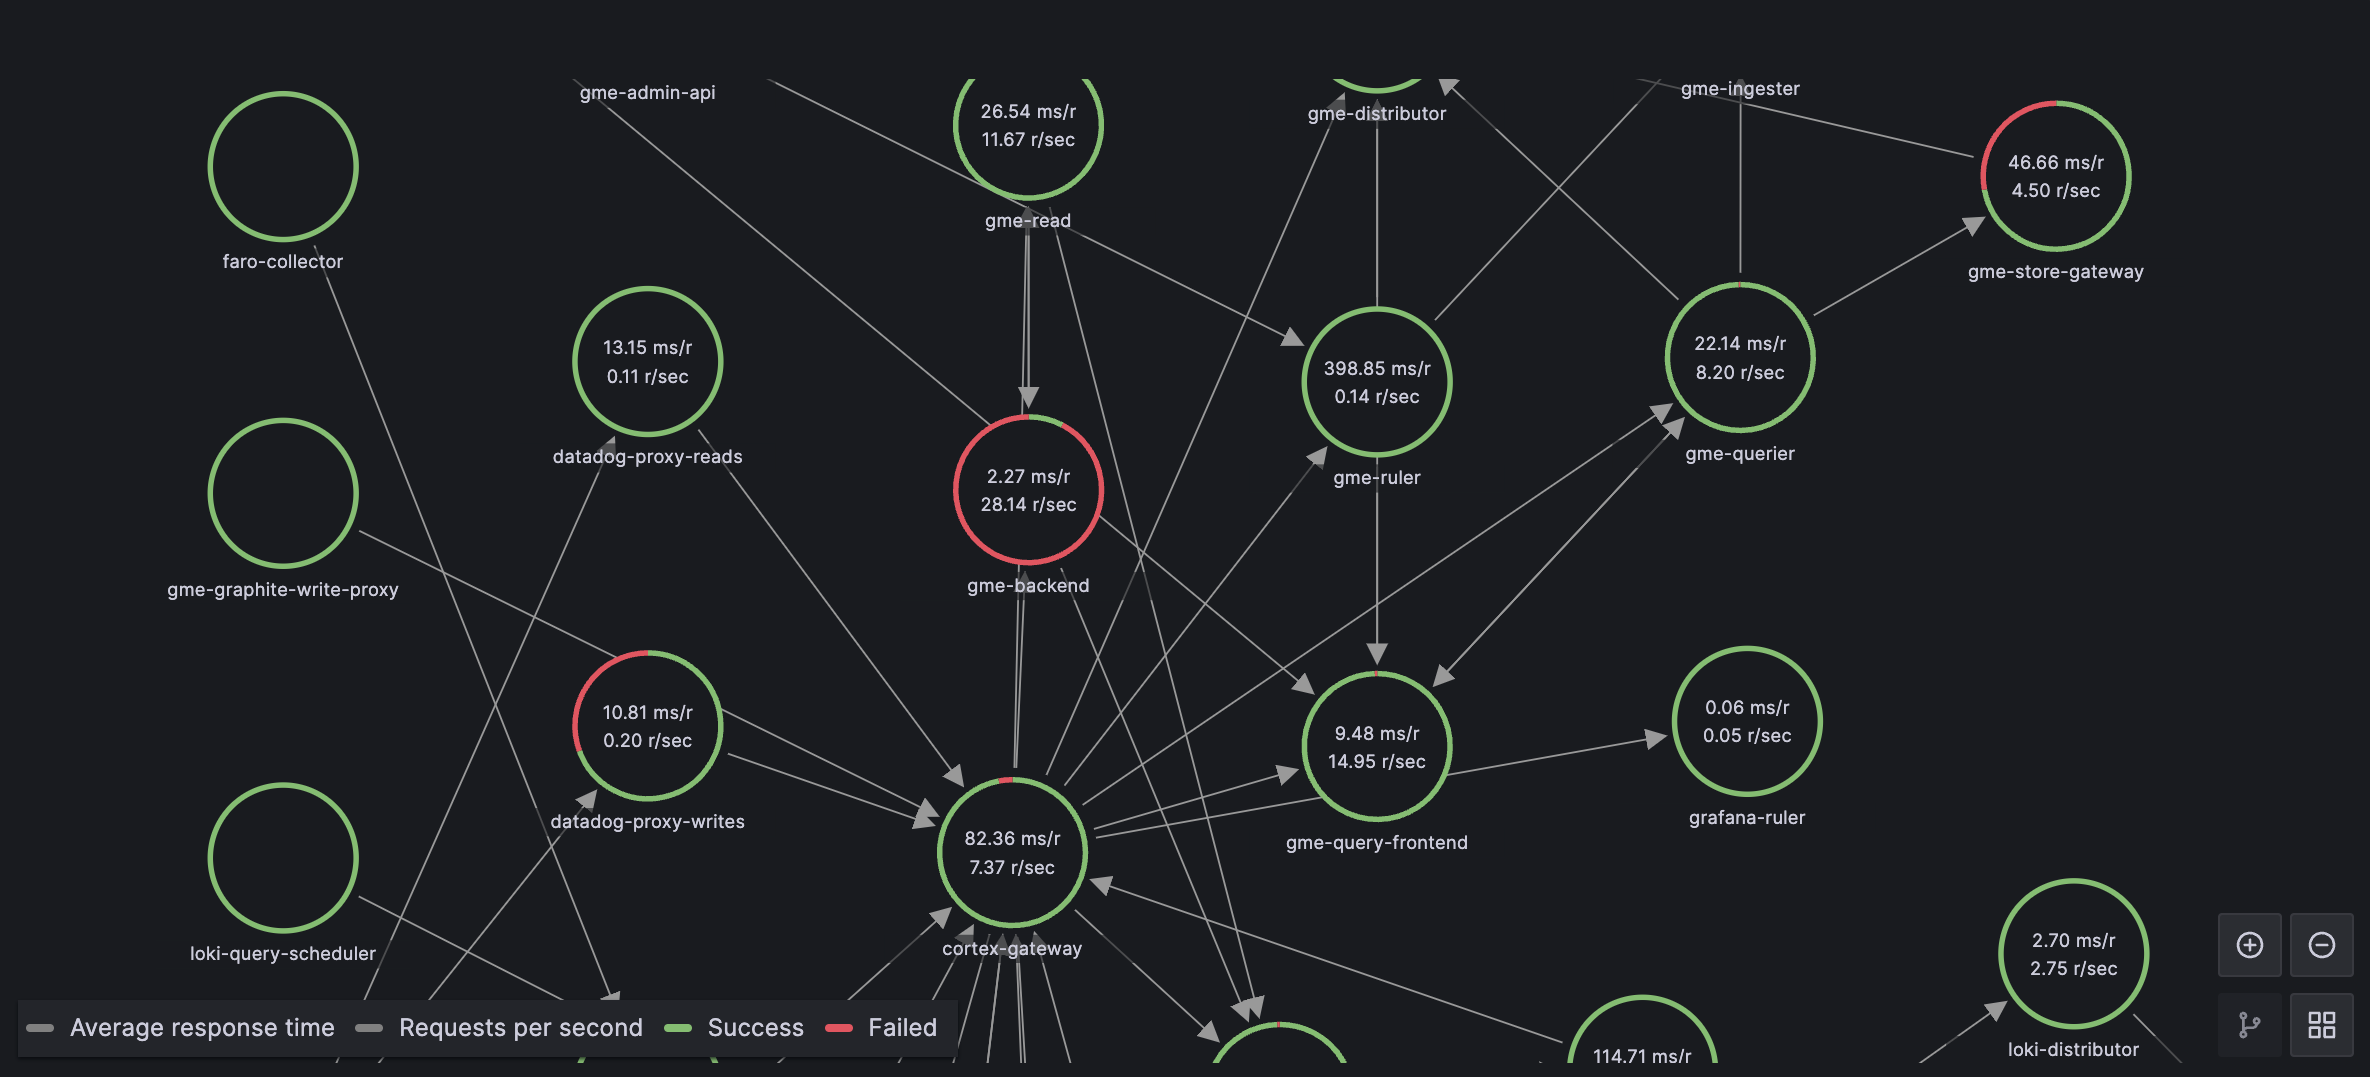
Scout supports the Model Context Protocol (MCP). You can connect your coding agent to Scout and query traces, logs, metrics, service topology, and alerts using natural language.
Coding agents like Claude Code, OpenAI Codex CLI, and Google Gemini CLI now ship with native OpenTelemetry support. This means you can collect structured telemetry covering token usage, cost attribution, tool calls, sessions, and lines of code modified, the same way you instrument any other production system.
This post covers what each agent emits, how to enable collection, and what we learned running Claude Code telemetry across a team.
Building agents that rely on third-party tools teaches you, quickly, what works and what doesn't. Most of these lessons came from things breaking. Here's what I think matters.

We’ve gotten pretty good at collecting observability data, but we’re terrible at making sense of it. Most teams—especially those running complex microservices—still rely on a handful of senior engineers who just know how everything fits together. They’re the rockstars who can look at alerts, mentally trace the dependency graph, and figure out what's actually broken.
When they leave, that knowledge walks out the door with them. That is the observability Bus Factor.
The problem isn't a lack of data; we have petabytes of it. The problem is a lack of context. We need systems that can actually explain what's happening, not just tell us that something is wrong.
This post explores the concept of a "Living Knowledge Base", Where the context is built based on the telemetry data application is emitting, not based on the documentations or confluence docs. Maintaining docs is a nightmare and we cannot always keep up Why not just build a system that will do this