Kubernetes Scheduling: Observing Silent Failures

A Pending Pod means Kubernetes accepts your workload but can't run it.
Classic culprits are: insufficient capacity, overly restrictive placement
constraints, unbound PVCs, autoscaler ceilings, or namespace quota exhaustion.
Most teams discover this during an incident. You don't have to. Wire up the
OTel Collector's k8s_cluster, kubeletstats, and k8sobjects receivers,
alert on FailedScheduling events and Pending pod duration, and you'll catch
scheduling failures before your users do. This post covers the five root
causes, a kubectl debugging workflow, and a complete OTel
instrumentation setup with collector config, deployment topology, and
alert conditions.
There is a specific kind of danger in systems that don't immediately
scream. A CrashLoopBackOff is loud, it triggers the automated alarms
and demands attention because something is broken. But a Pending pod is
quiet. It wears the mask of a transition, implying that the system is
"working on it." and that we should patiently wait for this to turn
green.
But when that transition time extends, "Pending" turns into an outage with no obvious steps to recover. It is a silent failure that hides in plain sight, with a deceptive debugging workflow.
The Deception of the "Waiting Room"
In a production environment, a Pod stuck in the Pending phase is rarely a fluke. It represents a fundamental tension between the application's intent and the infrastructure's reality. Because the pod hasn't "failed" in the traditional sense, it often bypasses basic health checks. Depending on your CD workflow, you may see a "successful" deployment in your CI/CD logs while your actual capacity is quietly evaporating.
The deception continues when you start to debug. You might look at your nodes and see 20% CPU free, yet your pod refuses to schedule because of a fragmented resource request or a zonal mismatch that isn't visible on a high-level dashboard. This gap between what you see and what the scheduler sees is where outage starts unnoticed. Distinguishing between a simple capacity bottleneck and a complex configuration error early prevents wasted cycles on the wrong layer of the stack.
In production systems, a Pending Pod is rarely an isolated event. It usually indicates a mismatch between workload intent and cluster capacity, placement constraints, or storage assumptions. Left undetected, these mismatches compound during traffic spikes, exactly when you can least afford them.
This post outlines the most common causes, a structured debugging approach, and how to instrument your clusters with OpenTelemetry to detect scheduling failures before they become outages.
What "Pending" Actually Indicates
A Pod in Pending means one of two things:
- The scheduler cannot place it on any node.
- It is waiting on a dependency such as volume binding.
In most production environments, scheduling constraints or resource availability are the primary causes. The distinction matters because the remediation paths are different: one is a capacity problem, the other is a configuration or infrastructure dependency problem.
Common Causes in Production Clusters
1. Resource Requests Exceed Capacity
If a Pod requests more CPU or memory than any node can provide, the scheduler will not place it. This often occurs when:
- Requests are set conservatively high without profiling actual usage.
- Horizontal scaling increases replica count without corresponding node capacity.
- Clusters operate close to maximum utilization with no buffer.
When traffic increases and scaling fails due to insufficient capacity, the system degrades silently before it fails visibly. The gap between "all replicas requested" and "all replicas running" is where incidents begin.
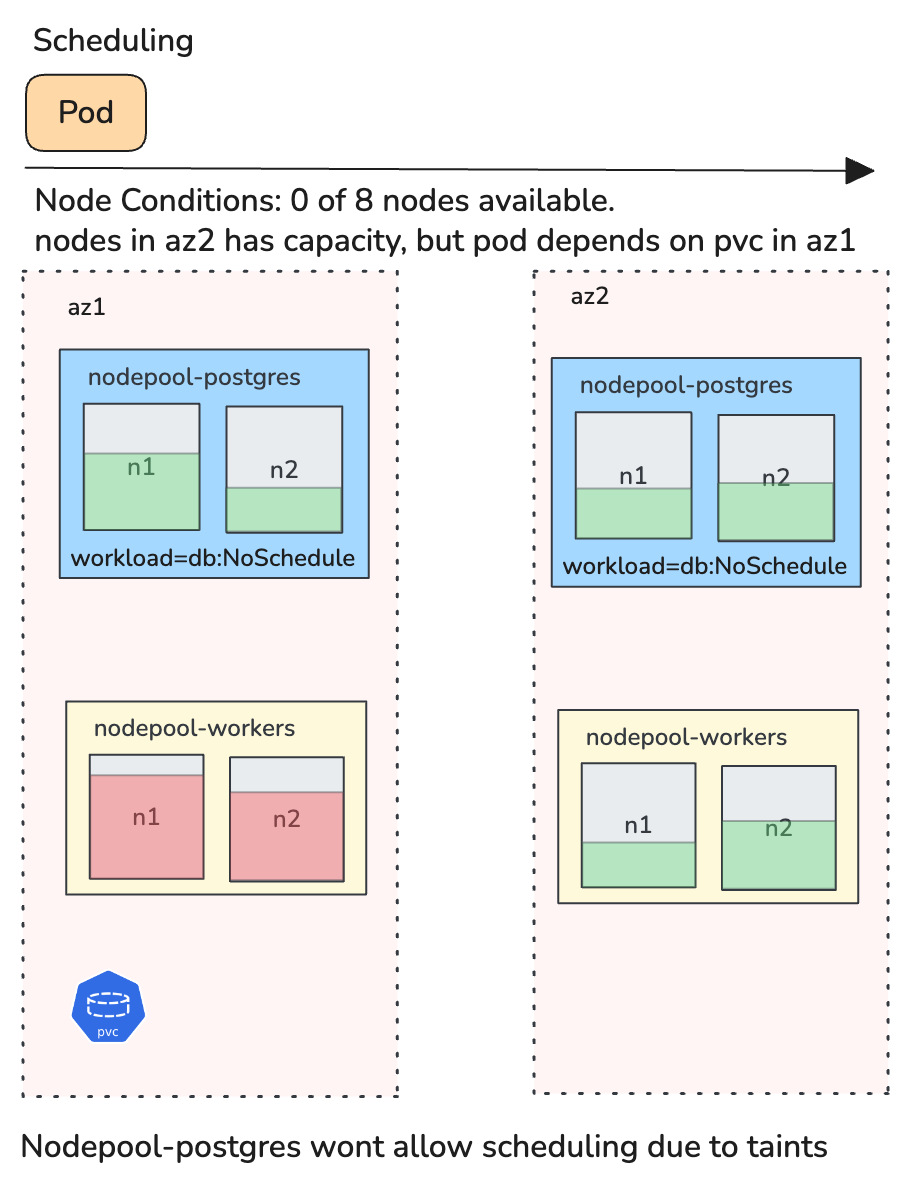
2. Placement Constraints Become Too Restrictive
Node selectors, affinity rules, taints, and topology constraints are useful controls. Over time, however, they accumulate across teams and workloads.
A workload may require a specific zone, a particular node label, separation from similar Pods, and toleration of certain taints. Individually, these are reasonable. In combination, they may eliminate all valid nodes. This is a common cause of stalled rollouts that only surfaces under specific scheduling conditions.
3. Persistent Volume Binding Delays
If a Pod references a PersistentVolumeClaim that is not in Bound state, scheduling cannot proceed. Typical reasons include no matching PersistentVolume, StorageClass provisioning failure, zonal mismatch between workload and volume, and constraints introduced by WaitForFirstConsumer.
Stateful workloads, including databases, queues, and anything with durable storage, are particularly sensitive to these issues. A single unbound PVC can block an entire StatefulSet rollout.
4. Autoscaler Limits
Cluster Autoscaler does not guarantee resolution. Pods remain Pending if the node group maximum size has been reached, cloud quota is exhausted, instance capacity is unavailable in the requested zone, or autoscaler configuration is incomplete.
In capacity-constrained environments, scaling assumptions must be validated, not assumed. The autoscaler is a best-effort mechanism, not an SLA.
5. Namespace Quotas
ResourceQuota may block additional CPU, memory, Pod count, or PVC allocation. In shared clusters, this often surfaces during recovery events when rapid scaling is attempted, precisely the scenario where you need headroom the most.
A Structured Debugging Workflow
Step 1: Describe the Pod
kubectl describe pod <pod-name>
The FailedScheduling event typically provides a direct explanation. Common messages include Insufficient memory, nodes didn't match pod affinity/anti-affinity rules, and pod has unbound immediate PersistentVolumeClaims. This is the primary diagnostic signal.
Step 2: Check PVC Status
kubectl get pvc -n <namespace>
If the claim is not Bound, investigate storage provisioning and topology. Cross-reference the PVC's requested StorageClass and access mode against what the cluster can actually provision.
Step 3: Inspect Node Capacity
kubectl describe nodes | grep -A 5 "Allocated resources"
Review allocatable resources against current requests. Many Pending events are simply capacity exhaustion that describe pod alone won't make obvious.
Step 4: Validate Autoscaler State
kubectl -n kube-system logs -l app=cluster-autoscaler --tail=50
Confirm node group limits, cloud quotas, and autoscaler logs. Do not assume new nodes will appear. Verify that the autoscaler can actually act.
Proactive Detection with OpenTelemetry
Debugging Pending Pods reactively works for individual incidents, but production reliability requires proactive detection. OpenTelemetry provides the instrumentation layer to make scheduling failures observable before they escalate.
The OpenTelemetry Collector as the Foundation
The OTel Collector is the central piece. Two receivers are essential for Pending Pod detection:
- k8s_cluster receiver connects to the Kubernetes API server and emits metrics about cluster-level object state, including pod phases, node conditions, and resource quotas.
- kubeletstats receiver pulls resource utilization metrics from each node's kubelet, giving you the capacity picture that complements the scheduling picture.
A minimal Collector configuration for scheduling observability:
receivers:
  k8s_cluster:
    collection_interval: 30s
    node_conditions_to_report:
      - Ready
      - MemoryPressure
      - DiskPressure
    allocatable_types_to_report:
      - cpu
      - memory

  kubeletstats:
    collection_interval: 30s
    auth_type: serviceAccount
    endpoint: "https://${env:K8S_NODE_NAME}:10250"
    insecure_skip_verify: true
    metric_groups:
      - node
      - pod

processors:
  batch:
    timeout: 15s

  resource/cluster:
    attributes:
      - key: cluster.name
        value: "${env:CLUSTER_NAME}"
        action: upsert

exporters:
  # Replace with your backend
  otlphttp:
    endpoint: "https://your-otlp-endpoint:4318"

service:
  pipelines:
    metrics:
      receivers: [k8s_cluster, kubeletstats]
      processors: [resource/cluster, batch]
      exporters: [otlphttp]
Key Metrics to Monitor
The k8s_cluster receiver emits metrics that directly map to the failure modes discussed above:
- k8s.pod.phase reports the current phase of each pod with
phase as an attribute. Filter for
phase: Pendingand track both count and duration. A pod that has been Pending for more than a few minutes in a production namespace is almost always actionable. - k8s.container.ready and k8s.pod.status_reason help distinguish between Pending due to scheduling and Pending due to container initialization. The scheduling case is the one that indicates cluster-level issues.
- k8s.node.condition reports conditions like Ready, MemoryPressure, and DiskPressure. Correlating node pressure conditions with Pending pod counts reveals capacity problems before they cause widespread scheduling failures.
- k8s.node.allocatable_cpu / k8s.node.allocatable_memory the ceiling for schedulable resources on each node. When the gap between allocatable and requested narrows, Pending pods follow.
- k8s.resource_quota.hard_limit / k8s.resource_quota.used directly addresses the namespace quota failure mode. Alert when usage approaches the hard limit.
From the kubeletstats receiver:
- k8s.node.cpu.utilization / k8s.node.memory.usage actual utilization on each node. High utilization combined with pods stuck in Pending confirms capacity exhaustion rather than a misconfiguration.
Capturing Scheduling Events
The k8sobjects receiver can watch Kubernetes Event objects, which is how you capture FailedScheduling events as structured telemetry rather than ephemeral kubectl output:
receivers:
  k8sobjects:
    objects:
      - name: events
        mode: watch
        namespaces: [production, staging]
This emits Kubernetes events as OTel log records. Filter for
reason: FailedScheduling in your backend to build alerts and
dashboards around scheduling failures. The event message contains the
same detail you would see in kubectl describe pod, but now it's
indexed, searchable, and correlatable.
Recommended Alert Conditions
With these metrics flowing into your observability backend, set up alerts for the signals that matter:
- Pending pod duration exceeds threshold: any pod in Pending
for more than 2–3 minutes in a production namespace. Use
k8s.pod.phasewith a phase filter and track time since the pod's creation timestamp. - Pending pod count rising: a sudden increase in Pending pods across the cluster, which typically indicates a capacity cliff or a node failure.
- Node allocatable headroom below buffer: when the ratio of requested to allocatable resources crosses 85–90%, scheduling becomes fragile. This is a leading indicator.
- ResourceQuota nearing hard limit: alert at 80% utilization of quota to give teams time to adjust before scaling is blocked.
- FailedScheduling event rate: a spike in FailedScheduling log records from the k8sobjects receiver is the most direct signal.
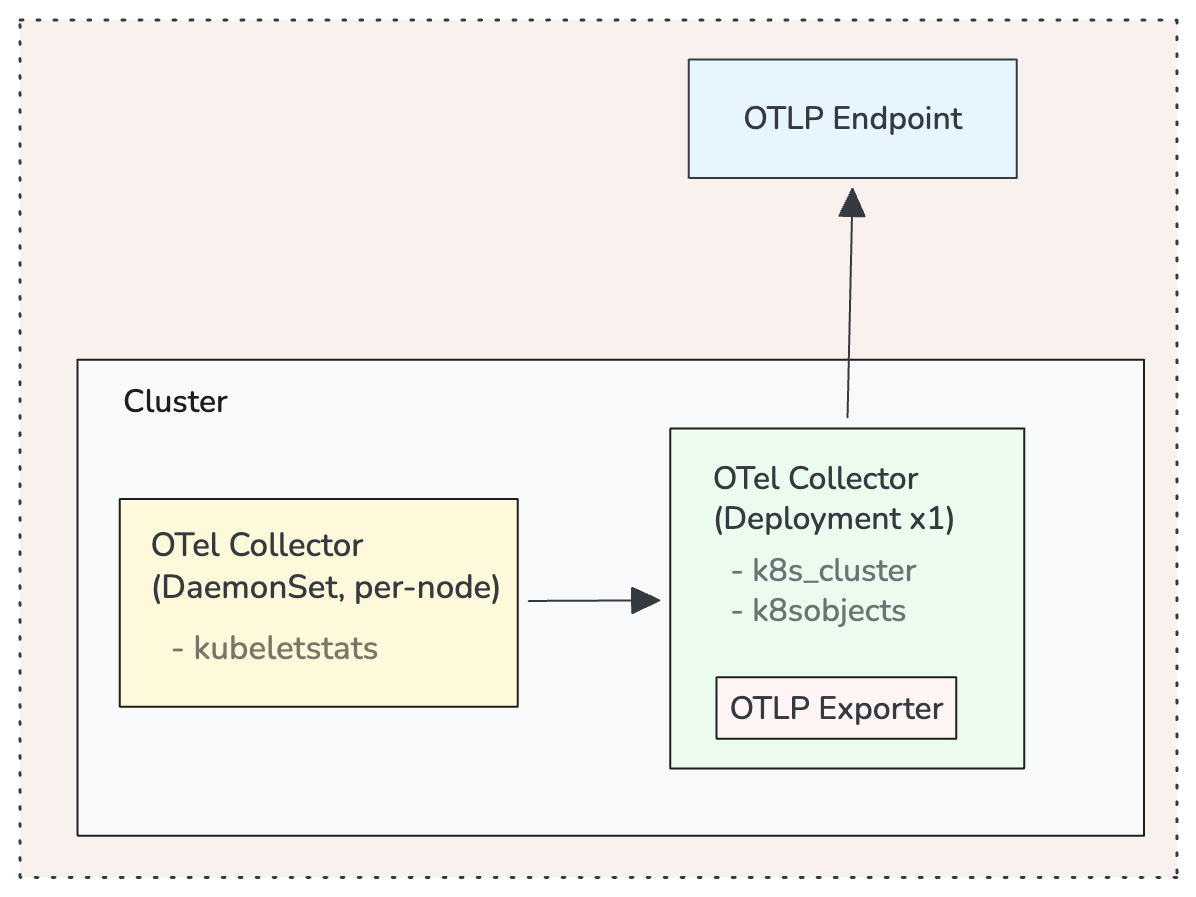
Deployment Topology
For production clusters, deploy the OTel Collector in two modes:
A DaemonSet deployment runs a Collector on every node with the kubeletstats receiver. This gives you per-node resource metrics with minimal network overhead since the Collector talks to the local kubelet.
A single-replica Deployment (or a small StatefulSet for HA) runs the k8s_cluster and k8sobjects receivers. These connect to the API server and only need one instance watching cluster state. Running multiple replicas of k8s_cluster without leader election will produce duplicate metrics.
Operational Implications
A Pending Pod reflects a constraint that the cluster cannot satisfy. It is an operational signal about capacity modeling, placement rigidity, storage alignment, and scaling boundaries.
In reliability-focused systems, scheduling failures should be observable and correlated with cluster utilization, deployment activity, and scaling events. With the OTel instrumentation described above, Pending pods shift from something you discover during incidents to something your system surfaces automatically.
Preventative Practices
- Right-size resource requests based on observed usage distributions, not guesswork. Use the kubeletstats metrics to profile actual consumption.
- Maintain buffer capacity in production clusters. Monitor allocatable headroom as a first-class SLI.
- Audit affinity and taint rules periodically. Constraint drift is subtle and compounds over time.
- Treat FailedScheduling events as first-class signals. Route them through your OTel pipeline and alert on them.
- Test scaling and quota boundaries in controlled environments before relying on them in production.
- Dashboard the gap between desired and ready replicas across your critical workloads. This is where Pending pods first become visible at the workload level.
Conclusion
Kubernetes scheduling behavior is deterministic. When a Pod remains Pending, it indicates that declared intent cannot be reconciled with the current cluster state.
In production environments, that signal should be treated as an early reliability indicator, not a transient anomaly. OpenTelemetry gives you the instrumentation to detect these mismatches continuously, correlate them with capacity and configuration state, and act on them before they affect your users. Want to see this in action? Book a 15-minute demo, no setup required.