Reducing Bus Factor in Observability Using AI

We’ve gotten pretty good at collecting observability data, but we’re terrible at making sense of it. Most teams—especially those running complex microservices—still rely on a handful of senior engineers who just know how everything fits together. They’re the rockstars who can look at alerts, mentally trace the dependency graph, and figure out what's actually broken.
When they leave, that knowledge walks out the door with them. That is the observability Bus Factor.
The problem isn't a lack of data; we have petabytes of it. The problem is a lack of context. We need systems that can actually explain what's happening, not just tell us that something is wrong.
This post explores the concept of a "Living Knowledge Base", Where the context is built based on the telemetry data application is emitting, not based on the documentations or confluence docs. Maintaining docs is a nightmare and we cannot always keep up Why not just build a system that will do this
The Current Situation: Telemetry Overload and Alert Fatigue
We live in an age of "complete observability." We send logs, metrics, and traces to powerful platforms, giving us beautiful dashboards, rich history, and deep APM insights. Yet, when an incident hits, we often still feel blind.
The Microservices Dilemma In a microservices world, one problem can trigger ten seemingly unrelated alerts.
Service A throws a 500 error alert.
The downstream Kafka topic latency spikes (metric alert).
The Kubernetes Node running Service A reports high memory usage (infra alert).
A junior engineer sees the 500 alert and stares at Service A's code. A senior engineer glances at the high memory usage on the node, remembers Service B was deployed an hour ago, and knows that Service A holds data in memory for retries when Service B is slow. The entire diagnosis takes 15 minutes mostly because it takes 14 minutes to track down the engineer with the tribal knowledge, and just 1 minute for them to pinpoint the actual issue.
This is because of The Human-in-the-Loop Dependency
Making it Better: The Living Knowledge Base (LKB)
The solution is to codify system knowledge using the system's own data. A real knowledge base isn’t just a dependency diagram—it’s the combination of relationships and the metadata around them. Instead of relying on static configs or runbooks that go stale, we let telemetry update those relationships continuously.
We call this a Living Knowledge Base (LKB).
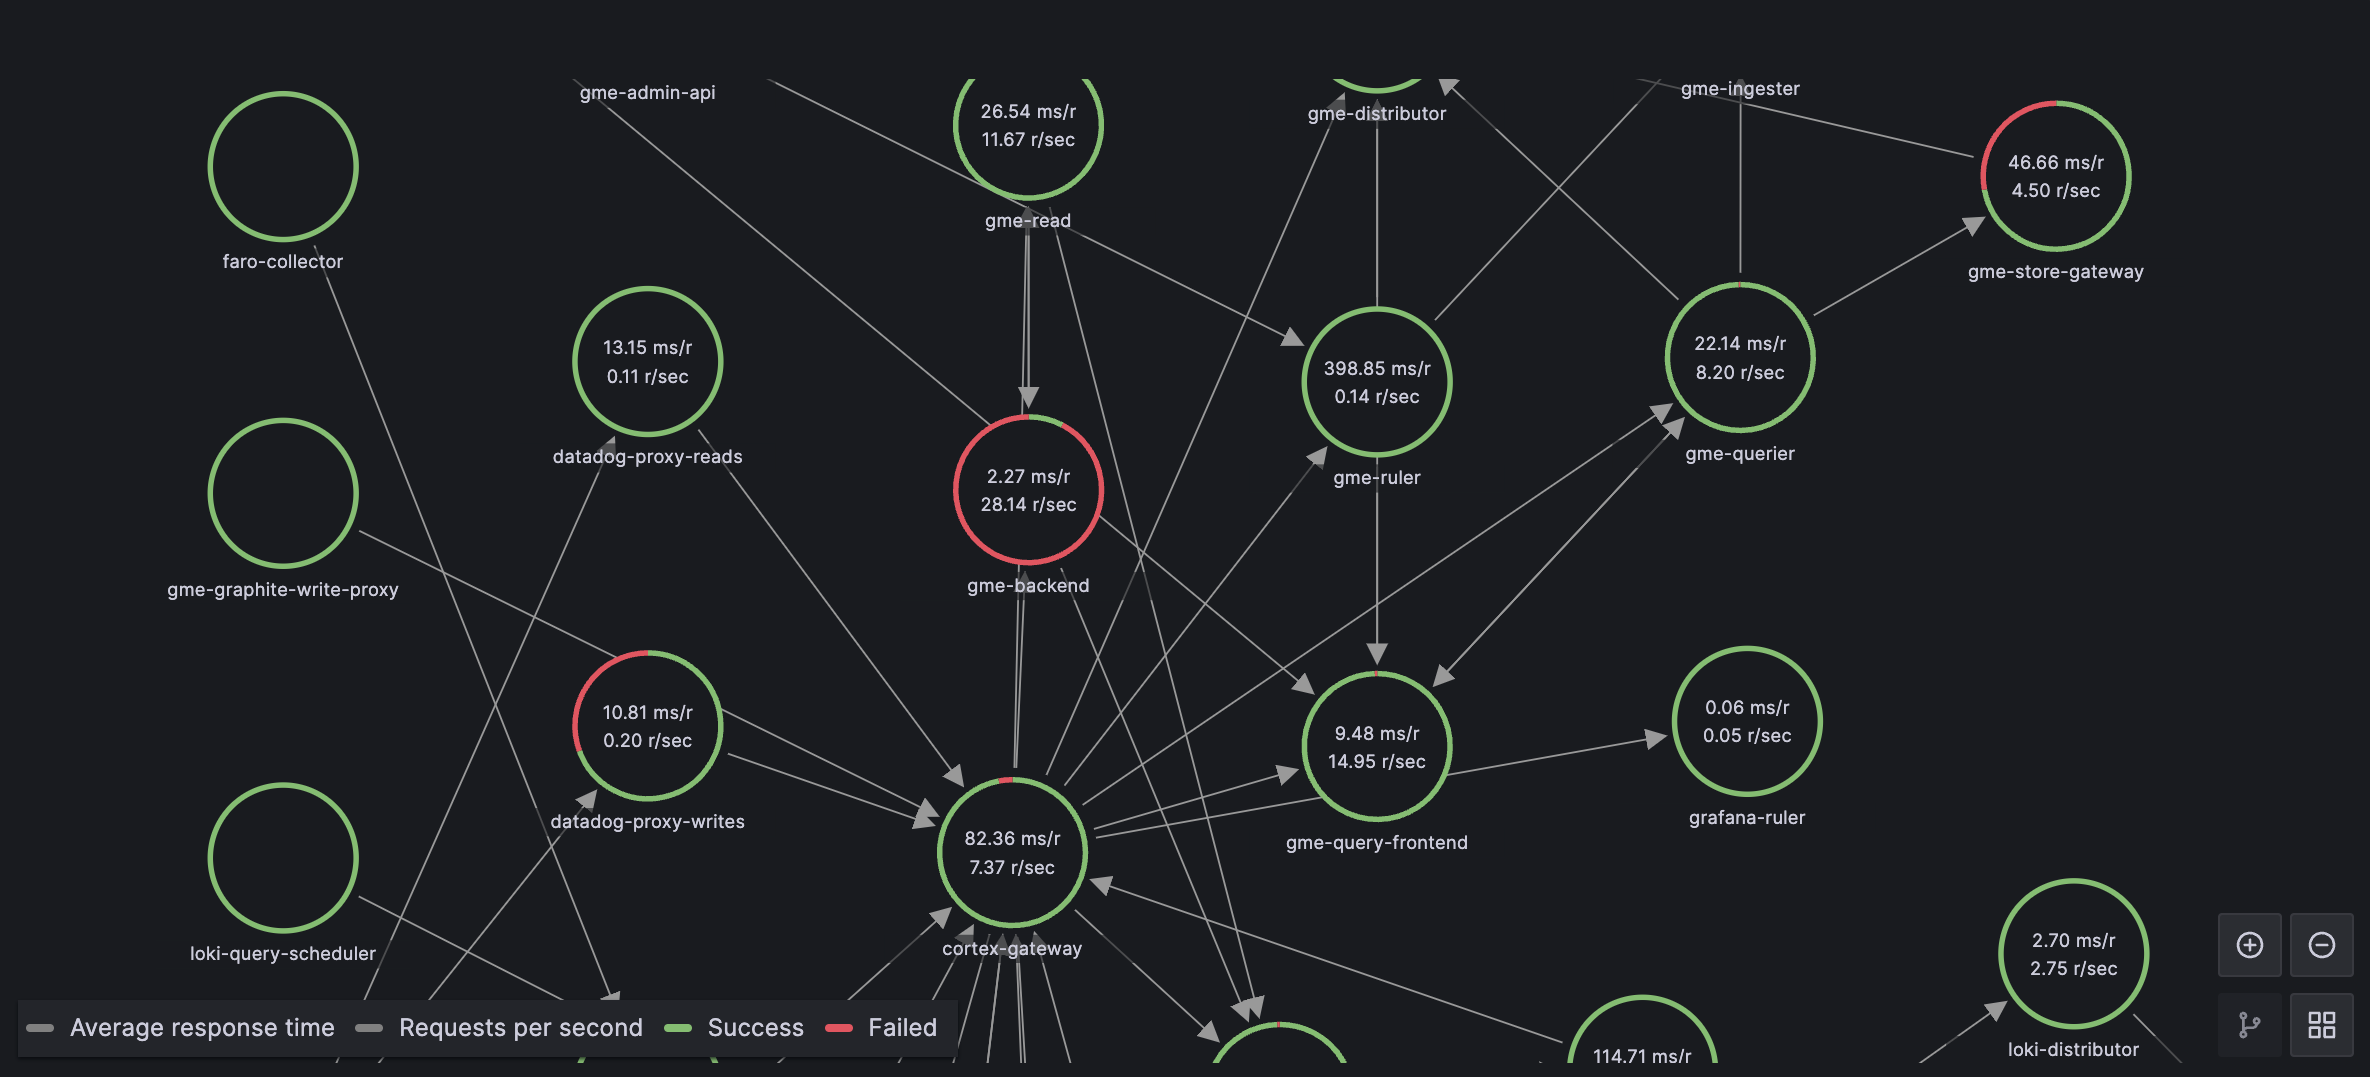
Building the LKB with a Graph Database The foundation of the LKB is a Graph Database (like Neo4j, Memgraph, or others). A graph database excels at storing relationships between data points, which is exactly what a distributed system is.
Instead of just sending telemetry to the standard observability backend, we also route a stream of high-volume telemetry (spans, metrics, pod metadata) to a processing agent.
This agent builds the graph in real-time:
| Node (Entity) | Edge (Relationship) |
|---|---|
| Service A | CALLS |
| Service A Pod 1 | RUNS_ON |
| K8s Node X | REPORTS |
| Service B | DEPENDS_ON |
As the application scales, deploys, and changes its dependencies, the graph adapts automatically
Adding an Intelligent layer over Knowledge base
The Knowledge base gives us the dynamic map; the LLM gives us the intelligence to interpret it.
We put an LLM in front of the LKB, making the graph accessible via a controlled interface (sometimes called a Model Context Protocol). This creates an Observability Agent.
From "Alert Fatique" to "Ask the Expert" When the triple alert hits (500, Kafka spike, Node memory), we don't have to manually click through dashboards. We simply prompt the Observability Agent:
Prompt: "Why did payment service latency spike?"
The agent does not guess; it walks the graph:
- Find Node: Find the Service A 500 Error node.
- Walk Upstream: Follow the CAUSED_BY edge (derived from trace data) to find the dependency on Service B.
- Correlate: Find the Service B node. Walk the RUNS_ON edge to the K8s Node Y node.
- Contextualize: Query the time-series data related to K8s Node Y and discover a memory leak or a recent deployment event.
Synthesize: The LLM translates the complex graph traversal into a simple, natural language root cause: “Payment service latency spiked because Service B, which runs on Node Y, suffered a memory leak after a recent deployment, causing high memory pressure. Service A's resulting connection timeouts triggered its internal retry loop, leading to high CPU and the 500 errors.”
The result is a nearly instant, accurate root cause analysis that democratizes the knowledge of your most senior engineers. It cuts a 30-minute debugging session down to 30 seconds.
Beyond Observability: Real-Time Insights
This Living Knowledge Base has applications far beyond just incident response.
-
Preventative Insight: The LKB can be continuously queried by an algorithm or Agent to find odd patterns—not just broken things. For instance, it might discover a service that has always called four other services, but for the last three days, it has only been calling three. This is a drift in behavior that can be flagged as a high-risk anomaly, allowing you to fix a bug before it impacts users.
-
Automated Runbook Generation: Since the LKB understands the system's current state, the LLM can generate live, current runbooks for a specific incident—not generic, outdated documents. It knows the exact steps to restart the specific dependency that's currently failing.
Conclusion
By using the structure of a Graph Database to give our telemetry data context and an LLM to give it intelligence, we finally move beyond simply collecting data. We create a system that understands itself, drastically reducing the Bus Factor and making every engineer capable of instant, deep root cause analysis.