
Introducing pgX: Bridging the Gap Between Database and Application Monitoring for PostgreSQL

· 8 min read
Engineering Team at base14

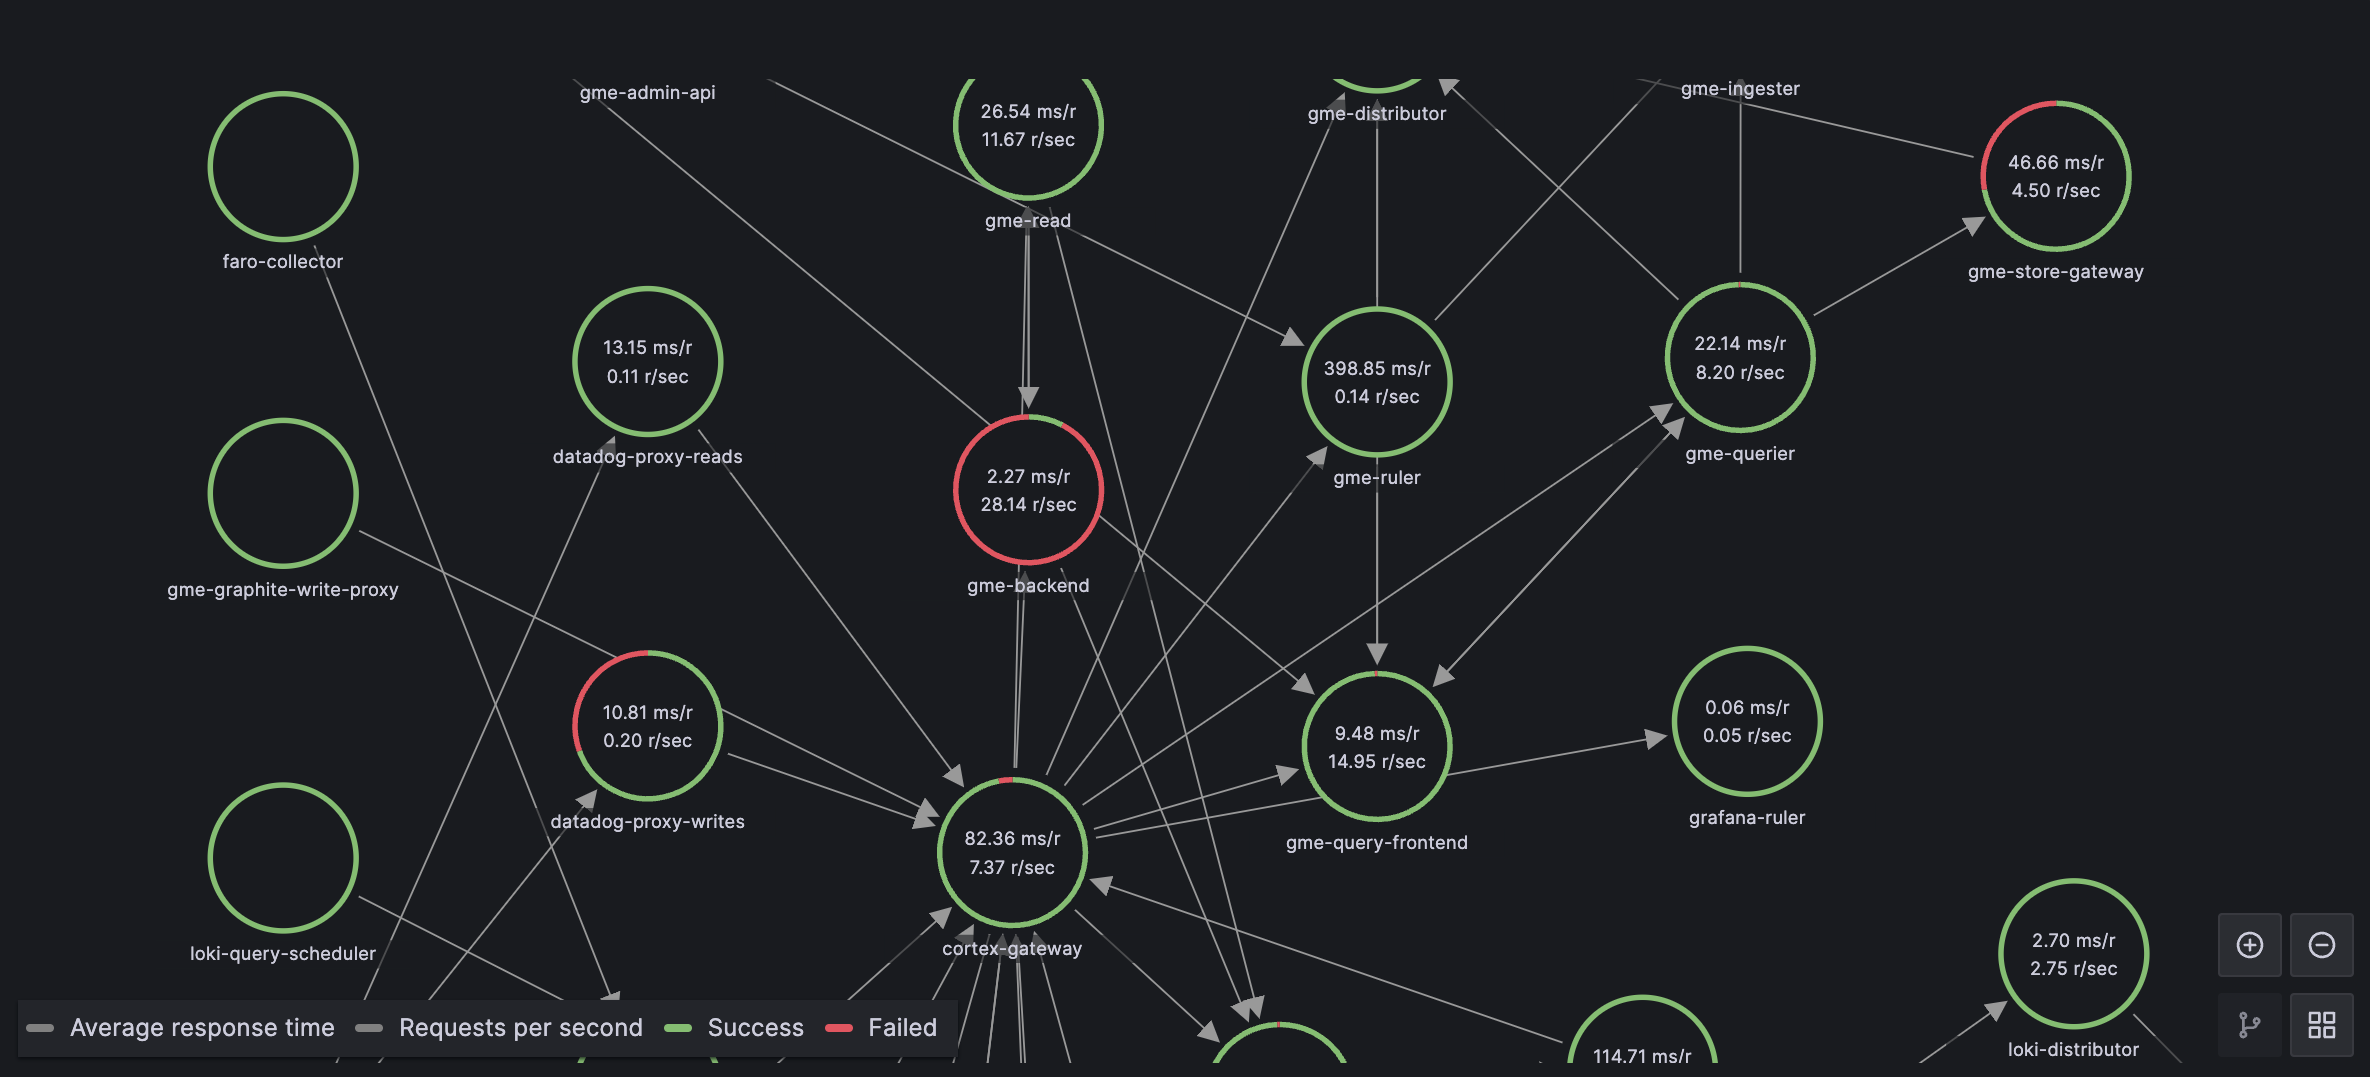
Watch: Tracing a slow query from application latency to PostgreSQL stats with pgX.

Modern software systems do not fail along clean architectural boundaries. Application latency, database contention, infrastructure saturation, and user behavior are tightly coupled, yet most observability setups continue to treat them as separate concerns, creating silos between database monitoring and APM tools. PostgreSQL, despite being a core component in most production systems, is often monitored in isolation—through a separate tool, separate dashboards, and separate mental models.

This separation works when systems are small and traffic patterns are simple. As systems scale, however, PostgreSQL behavior becomes a direct function of application usage: query patterns change with features, load fluctuates with users, and database pressure reflects upstream design decisions. At this stage, isolating database monitoring from application and infrastructure observability actively slows down diagnosis and leads teams to optimize the wrong layer.

In-depth PostgreSQL monitoring is necessary—but depth alone is not sufficient. Metrics without context force engineers to manually correlate symptoms across tools, timelines, and data models. What is required instead is component-level observability—a unified database observability platform where PostgreSQL metrics live alongside application traces, infrastructure signals, and deployment events, sharing the same time axis and the same analytical surface.

This is why PostgreSQL observability belongs in the same place as application and infrastructure observability. When database behavior is observed as part of the system rather than as a standalone dependency, engineers can reason about causality instead of coincidence, and leaders gain confidence that performance issues are being addressed at their source-not just mitigated downstream.

Reducing Bus Factor in Observability Using AI

· 5 min read
Nimisha G J
Engineer at base14
Service map graph

We’ve gotten pretty good at collecting observability data, but we’re terrible at making sense of it. Most teams—especially those running complex microservices—still rely on a handful of senior engineers who just know how everything fits together. They’re the rockstars who can look at alerts, mentally trace the dependency graph, and figure out what's actually broken.

When they leave, that knowledge walks out the door with them. That is the observability Bus Factor.

The problem isn't a lack of data; we have petabytes of it. The problem is a lack of context. We need systems that can actually explain what's happening, not just tell us that something is wrong.

This post explores the concept of a "Living Knowledge Base", Where the context is built based on the telemetry data application is emitting, not based on the documentations or confluence docs. Maintaining docs is a nightmare and we cannot always keep up Why not just build a system that will do this

The Cloud-Native Foundation Layer: A Portable, Vendor-Neutral Base for Modern Systems

· 4 min read
Irfan Shah
Founder & CTO at base14
Cloud-Native Foundation Layer

Cloud-native began with containers and Kubernetes. Since then, it has become a set of open standards and protocols that let systems run anywhere with minimal friction.

Today's engineering landscape spans public clouds, private clouds, on-prem clusters, and edge environments - far beyond the old single-cloud model. Teams work this way because it's the only practical response to cost, regulation, latency, hardware availability, and outages.

If you expect change, you need an architecture that can handle it.

Making Certificate Expiry Boring

· 21 min read
Ranjan Sakalley
Founder & CPO at base14
Certificate expiry issues are entirely preventable

On 18 November 2025, GitHub had an hour-long outage that affected the heart of their product: Git operations. The post-incident summary was brief and honest - the outage was triggered by an internal TLS certificate that had quietly expired, blocking service-to-service communication inside their platform. It's the kind of issue every engineering team knows can happen, yet it still slips through because certificates live in odd corners of a system, often far from where we normally look.

What struck me about this incident wasn't that GitHub "missed something." If anything, it reminded me how easy it is, even for well-run, highly mature engineering orgs, to overlook certificate expiry in their observability and alerting posture. We monitor CPU, memory, latency, error rates, queue depth, request volume - but a certificate that's about to expire rarely shows up as a first-class signal. It doesn't scream. It doesn't gradually degrade. It just keeps working… until it doesn't.

And that's why these failures feel unfair. They're fully preventable, but only if you treat certificates as operational assets, not just security artefacts. This article is about building that mindset: how to surface certificate expiry as a real reliability concern, how to detect issues early, and how to ensure a single date on a single file never brings down an entire system.

Understanding What Increases and Reduces MTTR

· 5 min read
Engineering Team at base14

What makes recovery slower — and what disciplined, observable teams do differently.


In reliability engineering, MTTR (Mean Time to Recovery) is one of the clearest indicators of how mature a system — and a team — really is. It measures not just how quickly you fix things, but how well your organization detects, communicates, and learns from failure.

Every production incident is a test of the system's design, the team's reflexes, and the clarity of their shared context. MTTR rises when friction builds up in those connections — between tools, roles, or data. It falls when context flows freely and decisions move faster than confusion.

Why Unified Observability Matters for Growing Engineering Teams

· 11 min read
Ranjan Sakalley
Founder & CPO at base14
Why Unified Observability Matters for Growing Engineering Teams

Last month, I watched a senior engineer spend three hours debugging what should have been a fifteen-minute problem. The issue wasn't complexity—it was context switching between four different monitoring tools, correlating timestamps manually, and losing their train of thought every time they had to log into yet another dashboard. If this sounds familiar, you're not alone. This is the hidden tax most engineering teams pay without realizing there's a better way.

Observability Theatre

· 11 min read
Ranjan Sakalley
Founder & CPO at base14
Observability Theatre

the·a·tre (also the·a·ter) /ˈθiːətər/ noun

: the performance of actions or behaviors for appearance rather than substance; an elaborate pretense that simulates real activity while lacking its essential purpose or outcomes

Example: "The company's security theatre gave the illusion of protection without addressing actual vulnerabilities."


Your organization has invested millions in observability tools. You have dashboards for everything. Your teams dutifully instrument their services. Yet when incidents strike, engineers still spend hours hunting through disparate systems, correlating timestamps manually, and guessing at root causes. When the CEO forwards a customer complaint asking "are we down?", that's when the dev team gets to know about incidents.