Viewing Traces
Scope surfaces LLM execution traces from Scout, giving you visibility into how prompts are performing in production. This guide covers navigating the trace view, filtering traces, and understanding trace details.
What Are Traces?
Every time a prompt is executed — whether through the Scope test panel, the API, or the SDK — an OpenTelemetry span is recorded. These spans flow through Scout's telemetry pipeline and appear in Scope as traces.
Each trace captures:
- The prompt name and version used
- The rendered prompt content (after variable substitution)
- The LLM provider and model
- Token counts (prompt, completion, total)
- Latency and estimated cost
- The LLM response
Browsing Traces
- Navigate to the Traces view in Scope
- Browse the list of recent executions
The trace list shows key information at a glance:
| Column | Description |
|---|---|
| Prompt | The prompt name |
| Version | The version that was executed |
| Provider / Model | Which LLM processed the request |
| Tokens | Total token count |
| Latency | Response time |
| Cost | Estimated cost |
| Time | When the execution occurred |
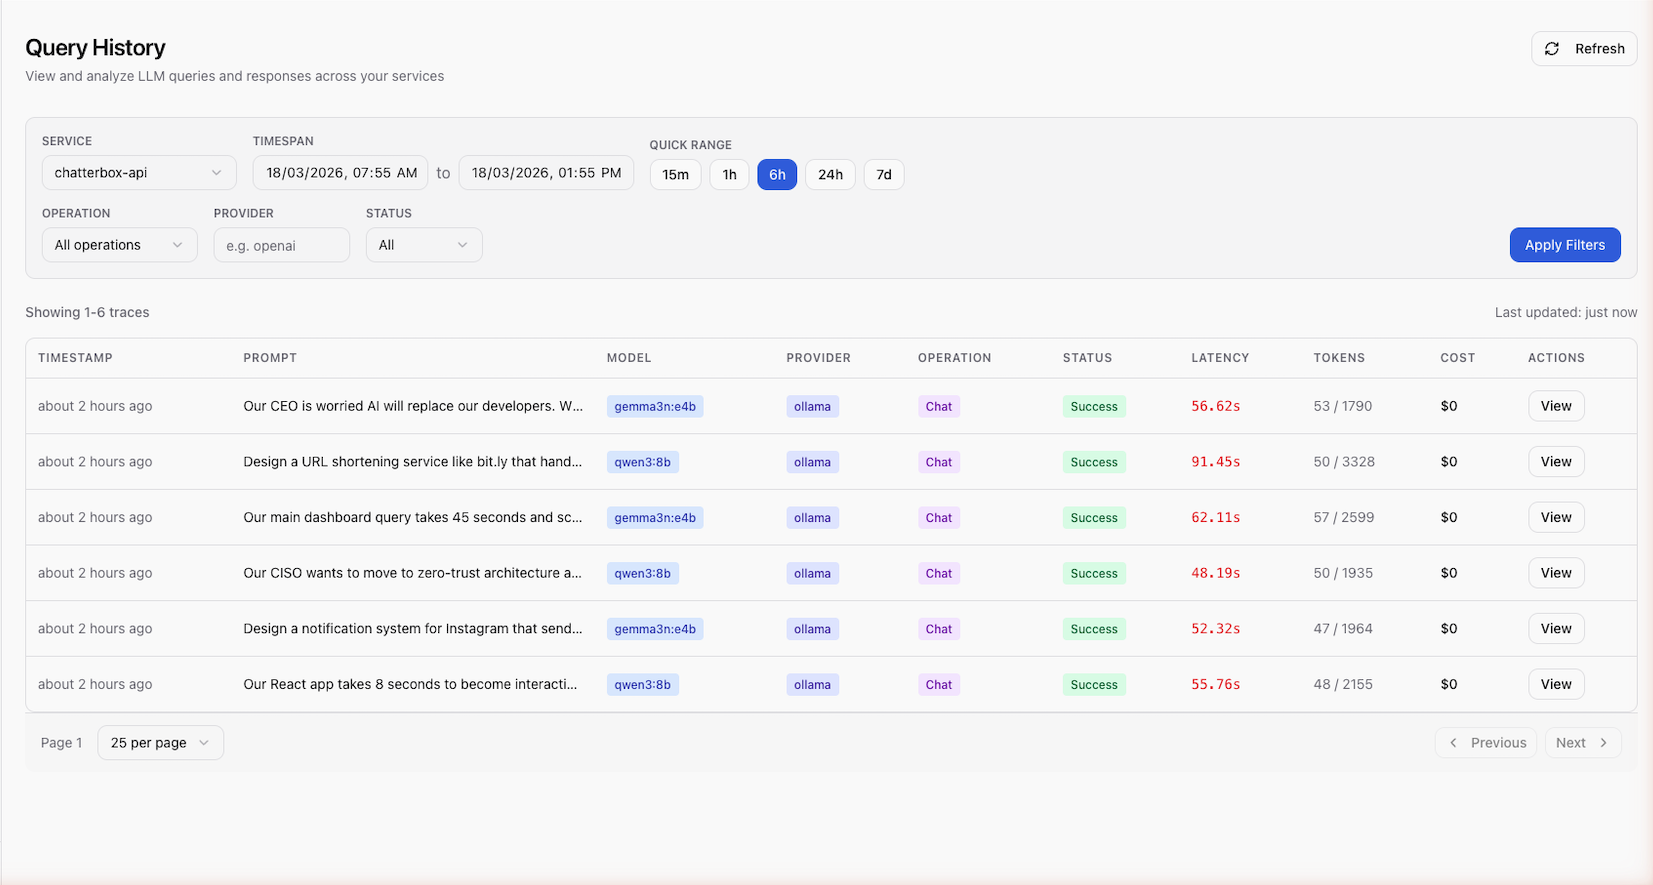
Filtering Traces
Use the filter controls to narrow the trace list:
- Prompt name — show traces for a specific prompt
- Provider / Model — filter by LLM provider or model
- Date range — specify a time window
- Status — filter by success or error
Combining filters helps you quickly find specific executions or investigate patterns.
Trace Detail View
Click on a trace to view its full details:
Request
- Prompt content — the raw template with
{{variable}}placeholders - Resolved content — the prompt after variable substitution
- Variables — the values provided for each variable
- Model configuration — parameters like
temperature,max_tokens
Response
- LLM output — the generated text
- Token breakdown — prompt tokens, completion tokens, total
- Latency — end-to-end response time in milliseconds
- Cost — estimated cost based on model pricing
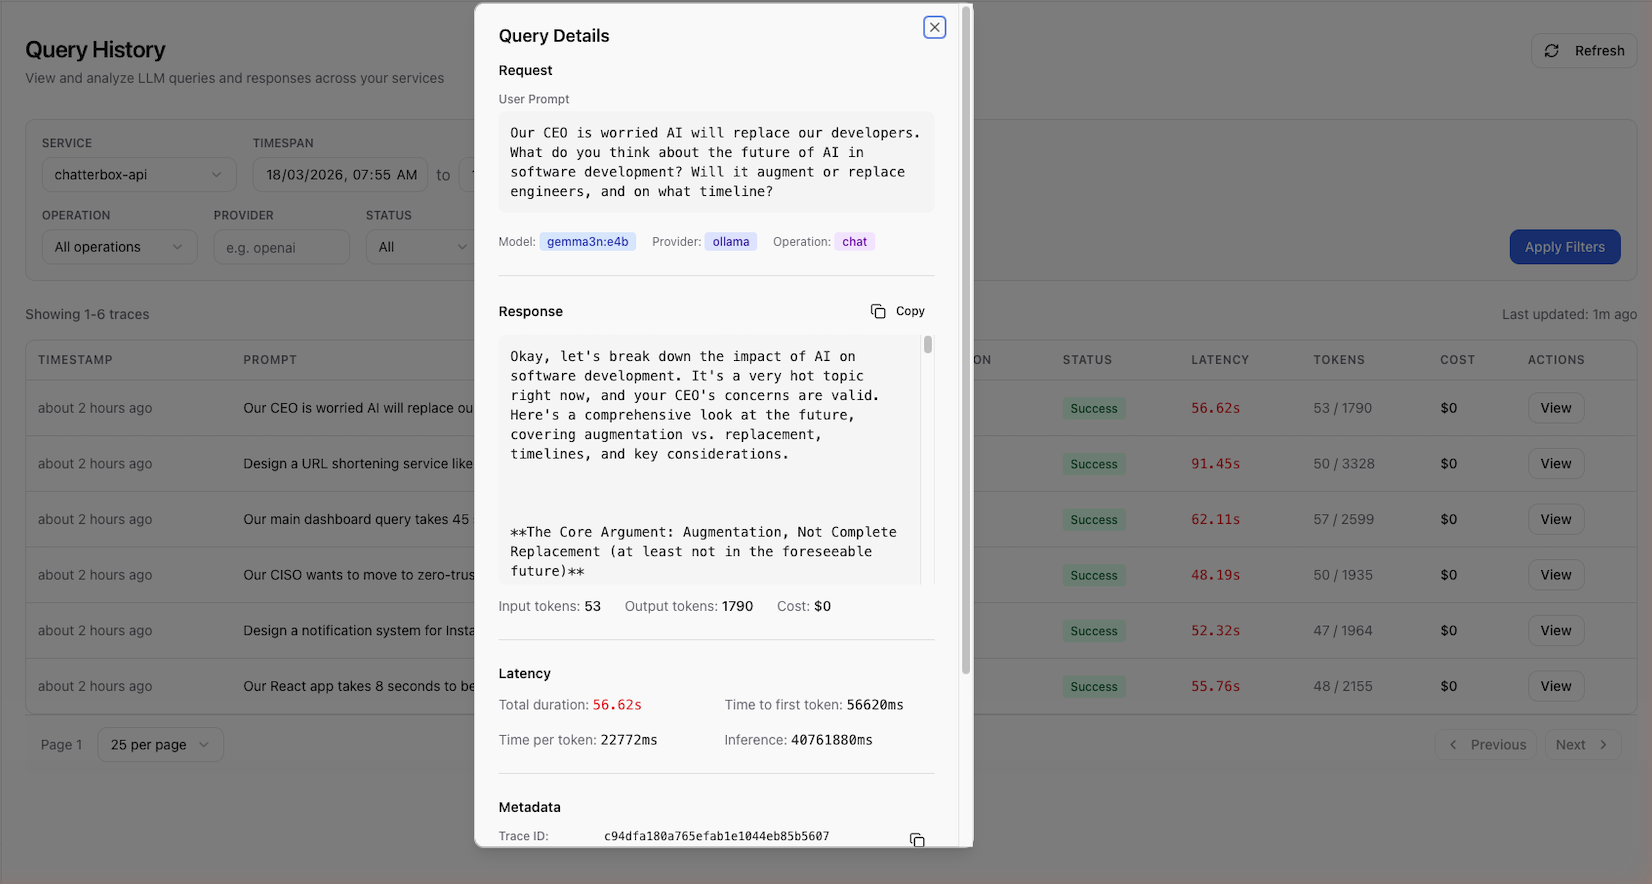
Metadata
- Trace ID — the OpenTelemetry trace identifier
- Provider ID and Model ID — internal identifiers
- External model ID — the provider's model name (e.g.,
gpt-4o) - Timestamp — when the execution occurred
Using Traces for Improvement
Traces are useful for:
- Performance monitoring — track latency and cost trends over time
- Quality review — read LLM responses to identify issues
- Prompt optimization — find prompts with high token usage and optimize them
- Creating prompts — turn a good trace into a managed prompt (see Create Prompt from Trace)
- Building test cases — add trace inputs/outputs to golden sets for regression testing
Scout Integration
Traces in Scope are sourced from Scout's OpenTelemetry data lake. This integration provides:
- Correlation — link prompt executions to application requests, database queries, and other spans
- Dashboards — visualize prompt performance metrics in Scout
- Alerting — set up alerts for prompt latency or error rate thresholds
See Scout Integration for setup and configuration details.
Next Steps
- Create Prompt from Trace — turn a trace into a managed prompt
- Testing Prompts — test prompts with the built-in test panel
- Scout Integration — configure the Scout data flow