traceX
traceX is a trace explorer Grafana app built into Base14 Scout. It provides deep visibility into your OpenTelemetry traces with waterfall visualizations, service flow diagrams, and advanced filtering.
traceX queries traces stored in the Scout Telemetry Data Lake and integrates with other Base14 Scout apps like logX for complete observability.
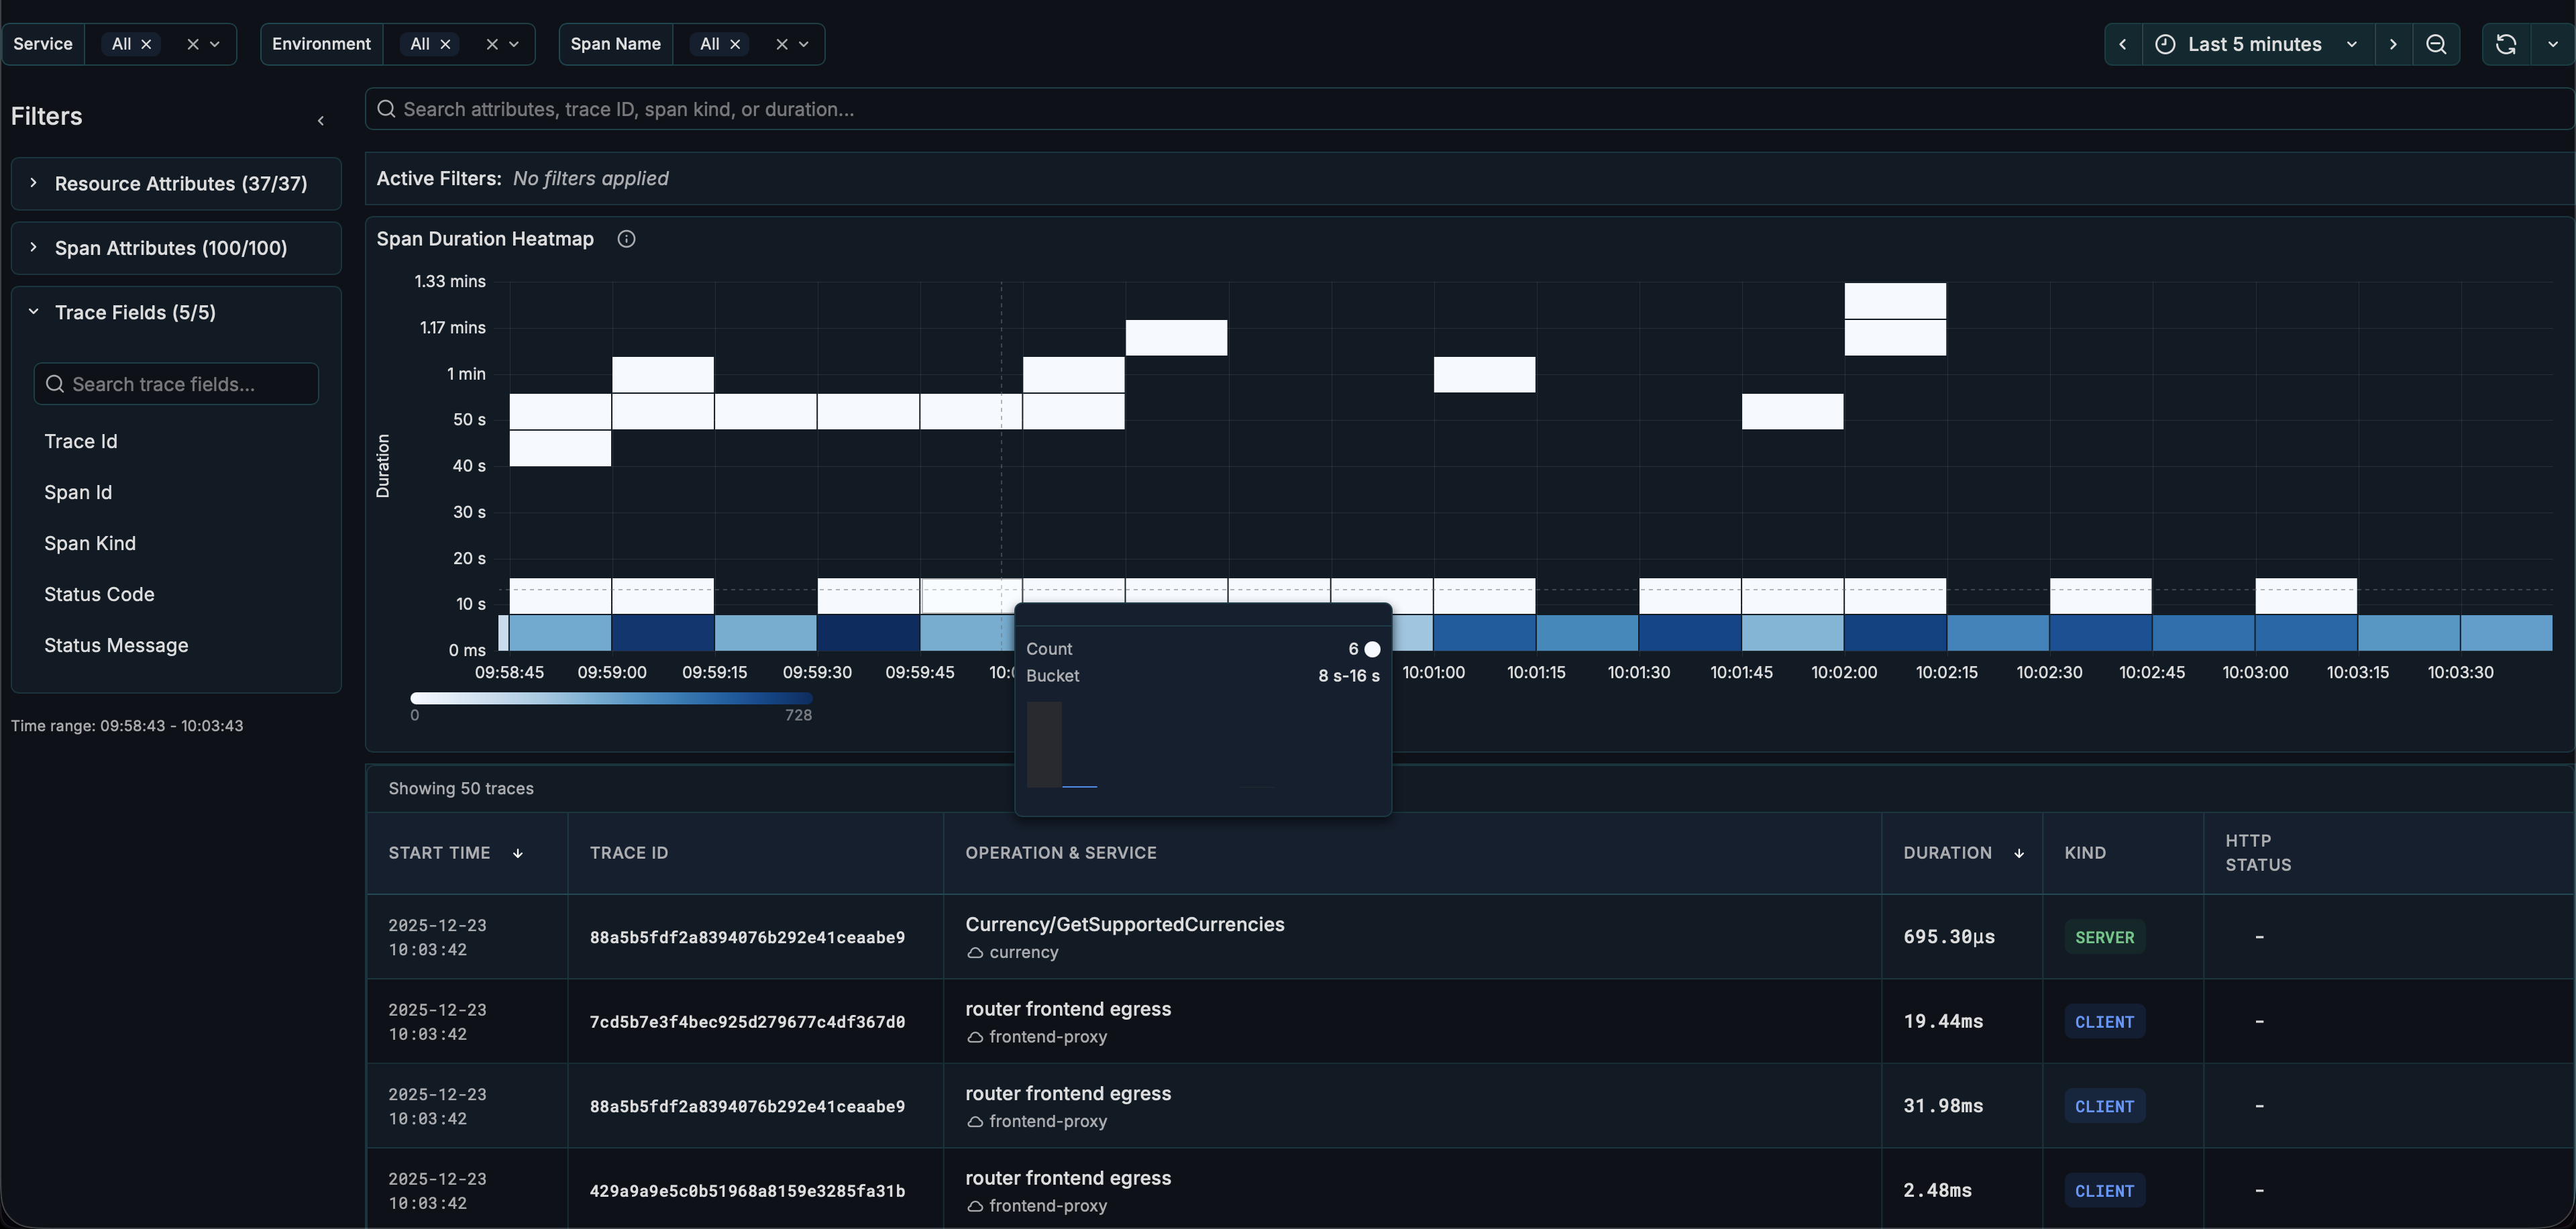
Interface Overview
The traceX interface consists of:
| Section | Description |
|---|---|
| Filters | Service name, environment, span name dropdowns, time picker |
| Filter Sidebar | Collapsible panel for attribute-based filtering |
| Active Filters | Badges showing currently applied filters |
| Heatmap | Duration distribution visualization over time |
| Table | List of spans with expandable details |
Getting Started
Select Service and Environment
- Use the Service Name dropdown to select one or more services
- Use the Environment dropdown to filter by environment
- Optionally select a Span Name to focus on specific operations
- Set the Time Range using the time picker
Time Range Settings
| Setting | Default | Description |
|---|---|---|
| Max Time Range | 1h | Maximum time range for queries |
| Max Unfiltered Range | 15m | Maximum time range when no service/environment is selected |
- For time ranges up to 15 minutes: Select any time range and browse traces directly
- For time ranges longer than 15 minutes: Select a Service Name and Environment first
Browse Traces
Traces appear in the Traces Panel showing:
- Timestamp
- Trace ID
- Service name
- Span count
- Duration
- Status
Click any trace to open the detailed view.
Trace Details View
When you click a trace, you'll see comprehensive trace analysis:
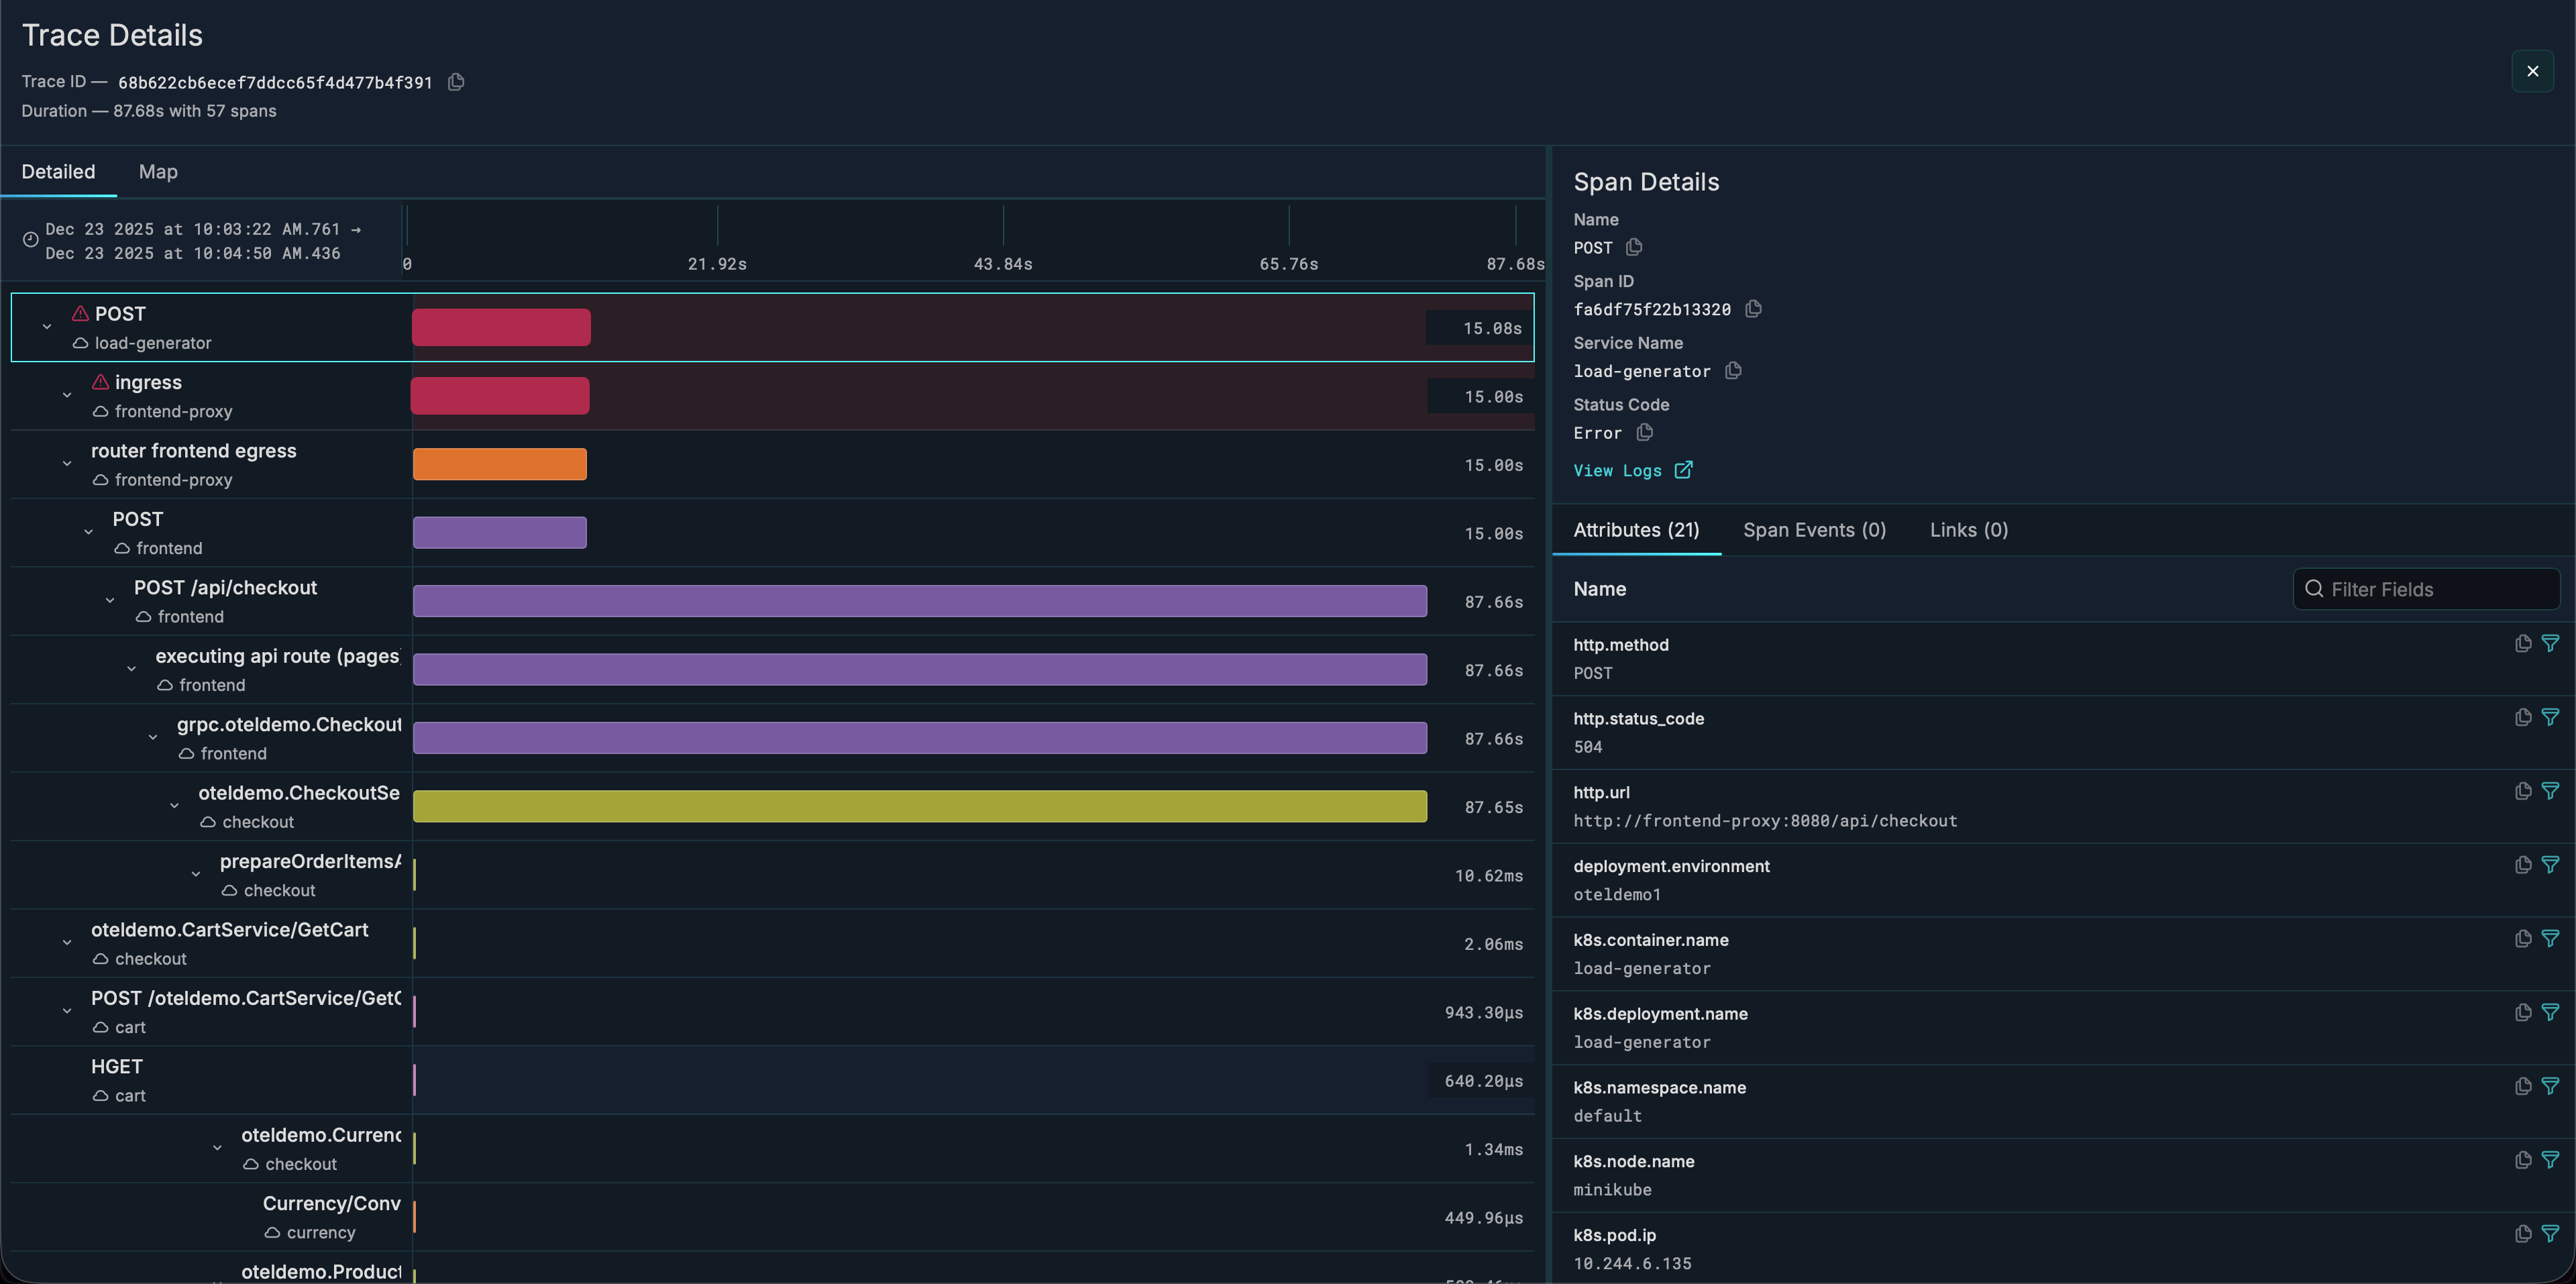
Waterfall Visualization
- Hierarchical view of all spans in the trace
- Horizontal timeline showing duration and timing
- Color-coded by service
- Click any span to see its details on the right sidebar
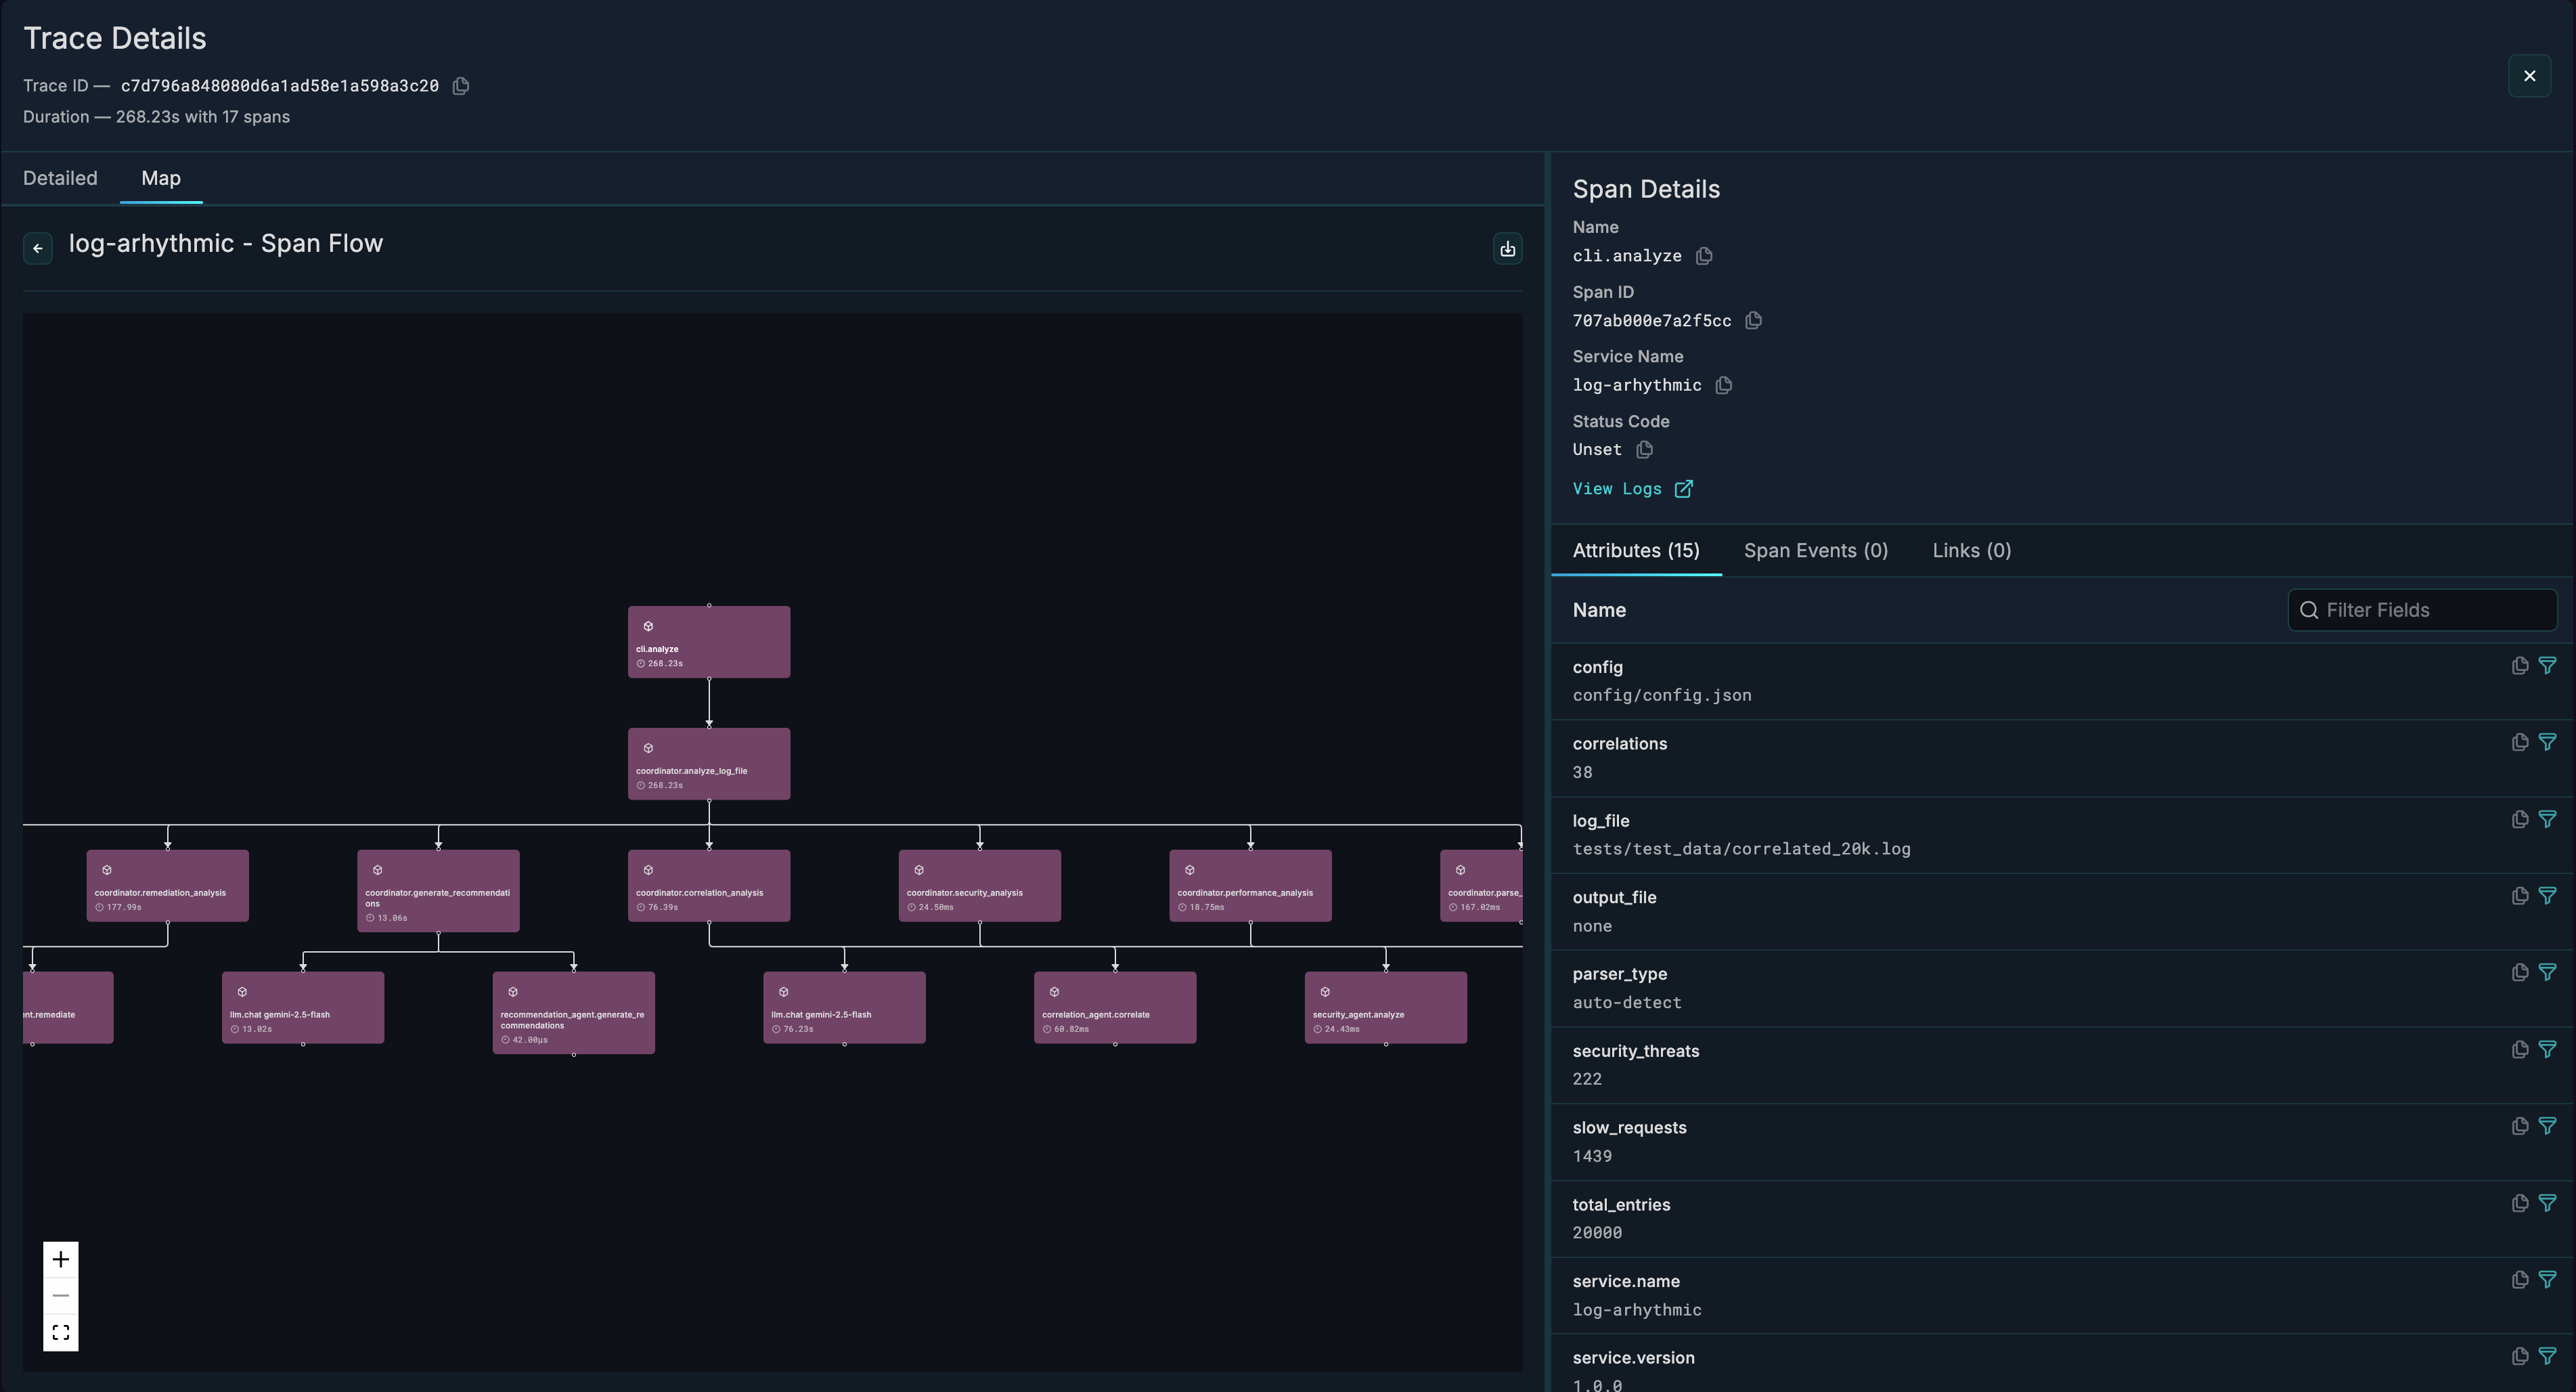
Service Flowchart
- Interactive diagram showing service-to-service calls
- Nodes represent services involved in the trace
- Edges show call relationships
- Error badges on services with failures
- Click a service to see its spans
Span Details
When you select a span, you'll see:
- Attributes tab - Span attributes and Resource attributes
- Events tab - Span events with timestamps
- Links tab - Links to related traces
Heatmap
The heatmap shows span duration distribution over time:
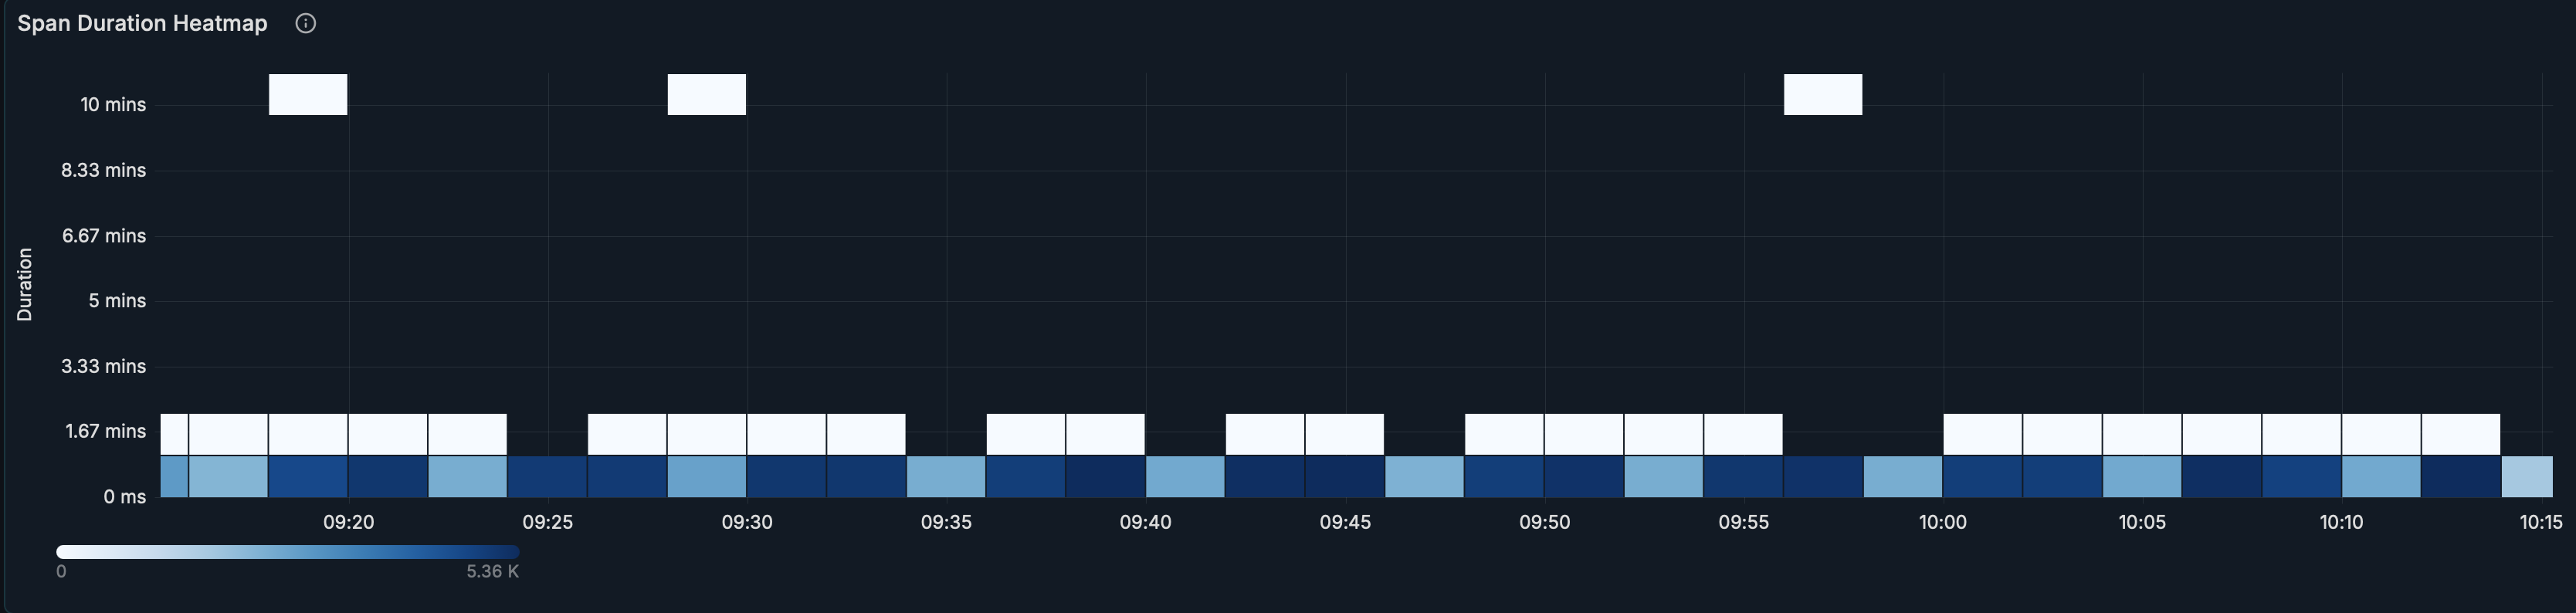
- X-axis: Time
- Y-axis: Duration buckets
- Color intensity: Frequency of spans in that bucket
Use the heatmap to:
- Identify latency patterns
- Spot performance degradation
- Find outlier requests
Filtering Traces
Using the Filter Sidebar
- Click the expand(
>) icon to open the sidebar - Choose a category: Resource Attributes, Span Attributes, or Trace Fields
- Click an attribute to see available values
- Select values to add filters (use
+to include,-to exclude)
Using Active Filters
- Active filters appear as badges above the heatmap
- Click - on a badge to remove that filter
- Click Clear all to remove all filters
Duration Filtering
Filter traces by duration to find slow requests or quick operations.
logX Integration
traceX integrates with logX for log-trace correlation:
- View a trace in traceX
- See correlated logs in logX using the View Logs button in Span Details on the right sidebar.
- Navigate between logs and traces seamlessly
Configuration
Access configuration at Administration → Plugins → traceX → Configuration.
| Setting | Description | Default |
|---|---|---|
| Database Name | ClickHouse database | default |
| Environments | Comma-separated list | staging,production |
| Environment Attribute Key | Resource attribute for env | environment |
| Max Time Range | Maximum query range | 1h |
| Max Unfiltered Range | Max range without filters | 15m |
| Max Variable Options | Dropdown option limit | 100 |
| Show Search Bar | Toggle search panel | false |
| Enable RBAC Filtering | Team-based service filtering | false |
RBAC (Role-Based Access Control)
When enabled, service visibility is restricted based on Grafana team membership:
- Teams must follow naming pattern:
{ServiceName}-viewer(e.g.,api-gateway-viewer) - Users only see services from teams they belong to
- All queries are automatically filtered to permitted services
URL Parameters
traceX state is persisted in the URL for bookmarking and sharing:
| Parameter | Description |
|---|---|
from / to | Time range |
var-service_name | Selected services |
var-environment | Selected environment |
var-span_name | Selected span name |
traceId | Open specific trace details |
Share the URL to give others the exact same view.
Related Guides
- logX - Log explorer with trace correlation