logX
logX is a log explorer Grafana app built into Scout. It provides deep visibility into your OpenTelemetry logs with advanced filtering, searching, and trace correlation.
logX queries logs stored in the Scout Telemetry Data Lake and integrates with other Scout apps like TraceX for complete observability.
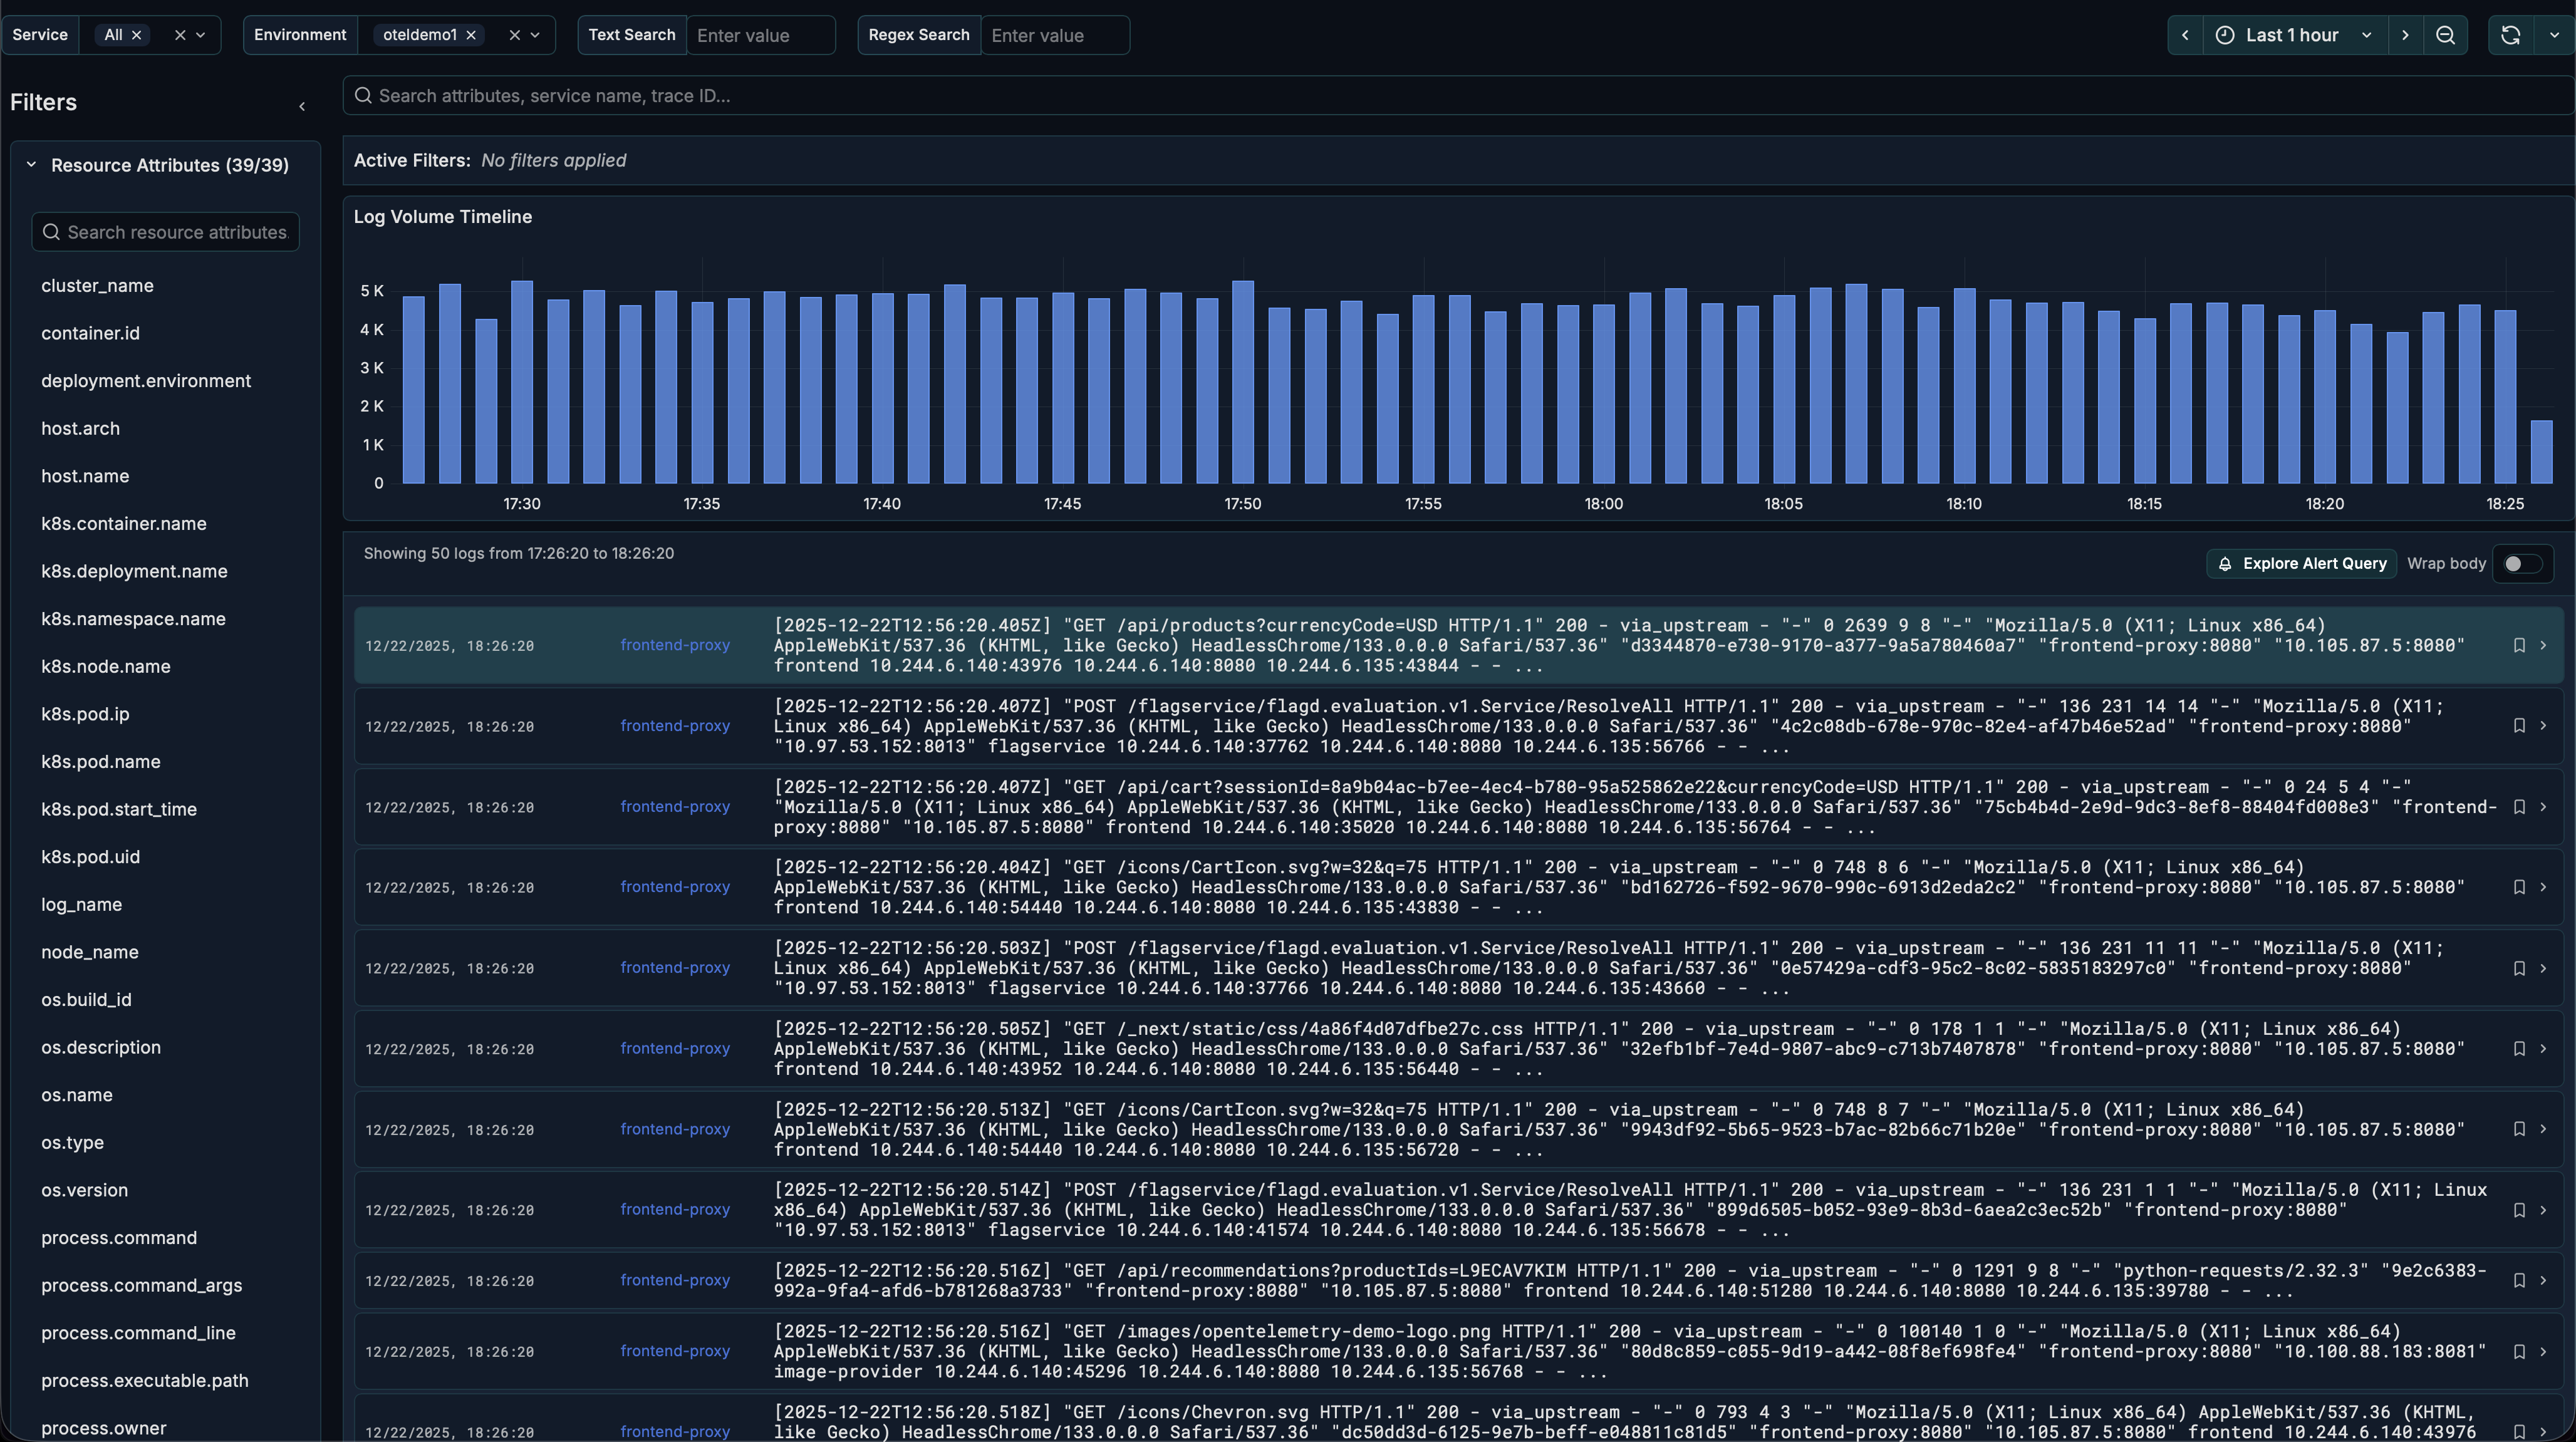
Interface Overview
The logX interface consists of:
| Section | Description |
|---|---|
| Filters | Service/environment dropdowns, time picker, refresh |
| Filter Sidebar | Collapsible panel for attribute-based filtering |
| Search Panel | Text and regex search in log body |
| Active Filters | Badges showing currently applied filters |
| Timeseries Chart | Log volume visualization over time |
| Logs Panel | Log entries with expandable details |
Getting Started
Select Service and Environment
- Use the Service Name dropdown to select one or more services
- Use the Environment dropdown to filter by environment
- Set the Time Range using the time picker
Time Range Settings
| Setting | Default | Description |
|---|---|---|
| Max Time Range | 1h | Maximum time range for queries |
| Max Unfiltered Range | 15m | Maximum time range when no service/environment is selected |
- For time ranges up to 15 minutes: Select any time range and browse logs directly
- For time ranges longer than 15 minutes: Select a Service Name and Environment first
Browse Logs
Logs appear in the Logs Panel in reverse chronological order:
- Each entry shows timestamp, severity, service, and log body
- Severity is color-coded (INFO=green, WARN=yellow, ERROR=red)
- Click any entry to expand and view full details
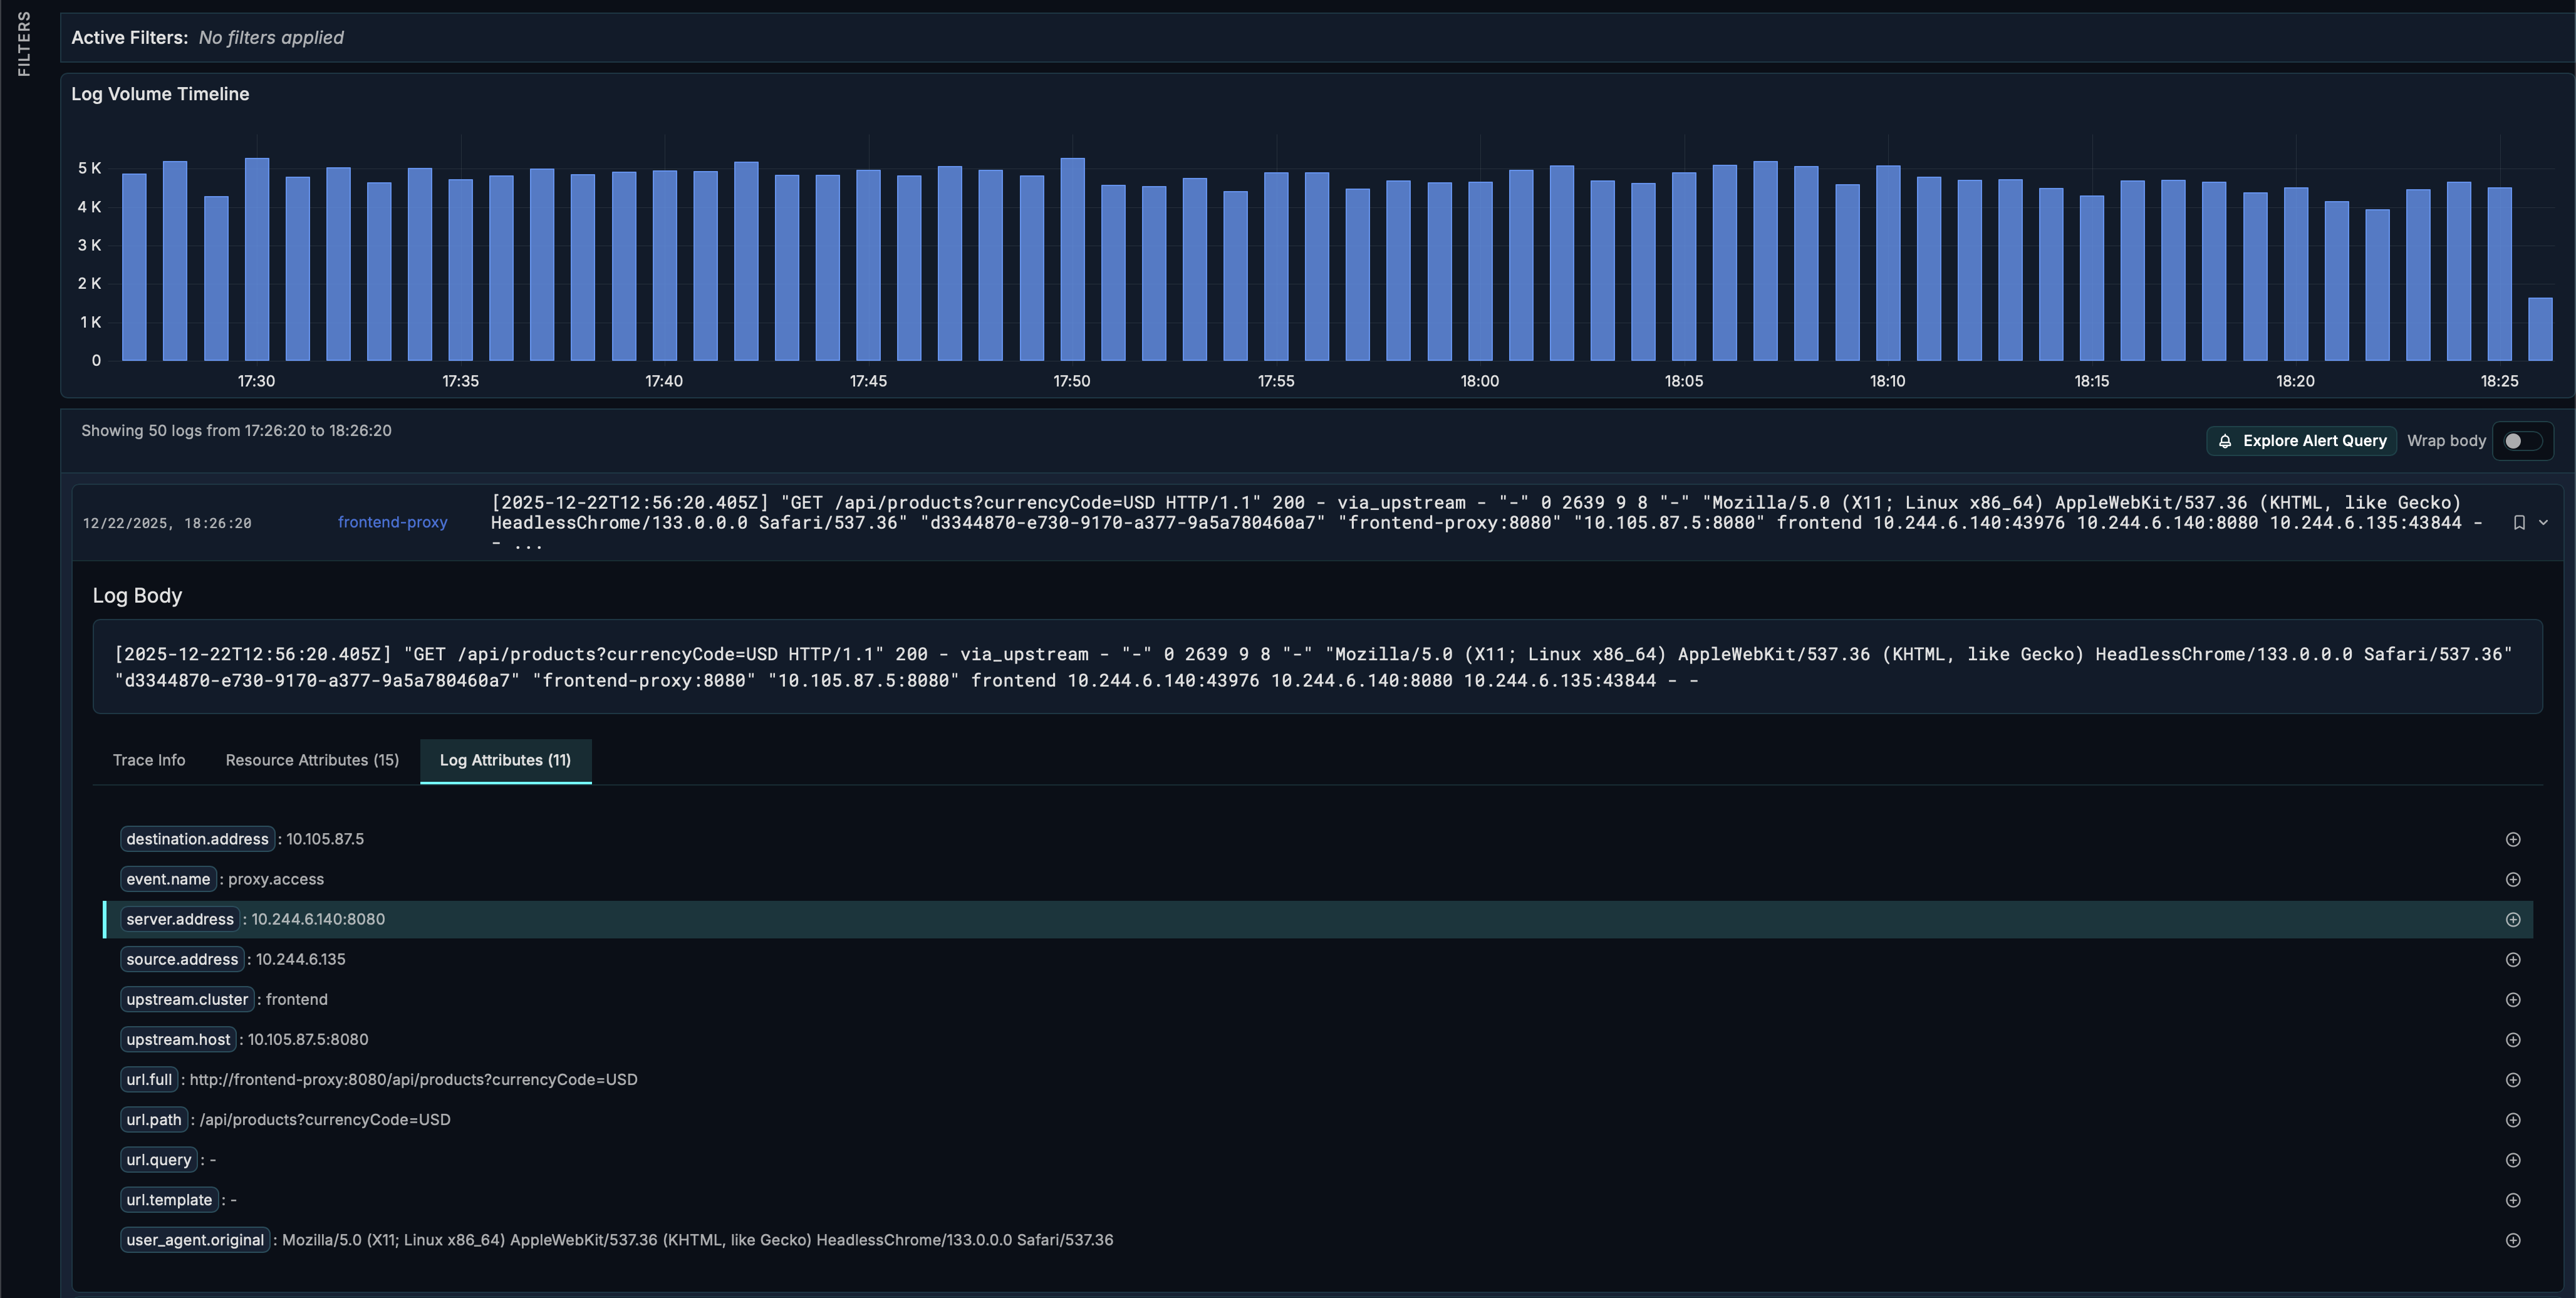
View Log Details
When you expand a log entry, you'll see:
- Full log body - Complete message without truncation
- Trace Info tab - Trace ID, Span ID, and View Trace button
- Resource Attributes tab - Service, host, and deployment info
- Log Attributes tab - Exception details, HTTP info, custom attributes
Filtering Logs
Using the Filter Sidebar
- Click the expand icon to open the sidebar
- Choose a category: Resource Attributes, Log Attributes, or Standard Columns
- Click an attribute to see available values
- Select values to add filters (use
=to include,!=to exclude)
Using Active Filters
- Active filters appear as badges above the timeseries chart
- Click × on a badge to remove that filter
- Click Clear all to remove all filters
Adding Filters from Logs
- Expand a log entry
- Go to Resource Attributes or Log Attributes tab
- Hover over any value and click
=or!=to filter
Searching Logs
Text Search
Enter text in the search field to find logs containing that text:
- Case insensitive matching
- Use
|(pipe) to search for multiple terms:error|timeout - Matching text is highlighted in results
Regex Search
Use the regex search field for pattern matching:
- Supports RE2 regex syntax
- Example:
user_id=[0-9]+matches "user_id=12345" - Example:
(error|warn).*databasematches error/warn logs about database
Timeseries Chart
The bar chart shows log volume over time:
- Spikes may indicate error storms or traffic increases
- Drops may indicate service outages or collector issues
- Click and drag to zoom into a specific time range
Pinning Logs
Pin important logs to keep them visible:
- Expand a log entry
- Click the Pin button
- Pinned logs appear in a dedicated section at the top
- Pin state is saved in the URL for sharing
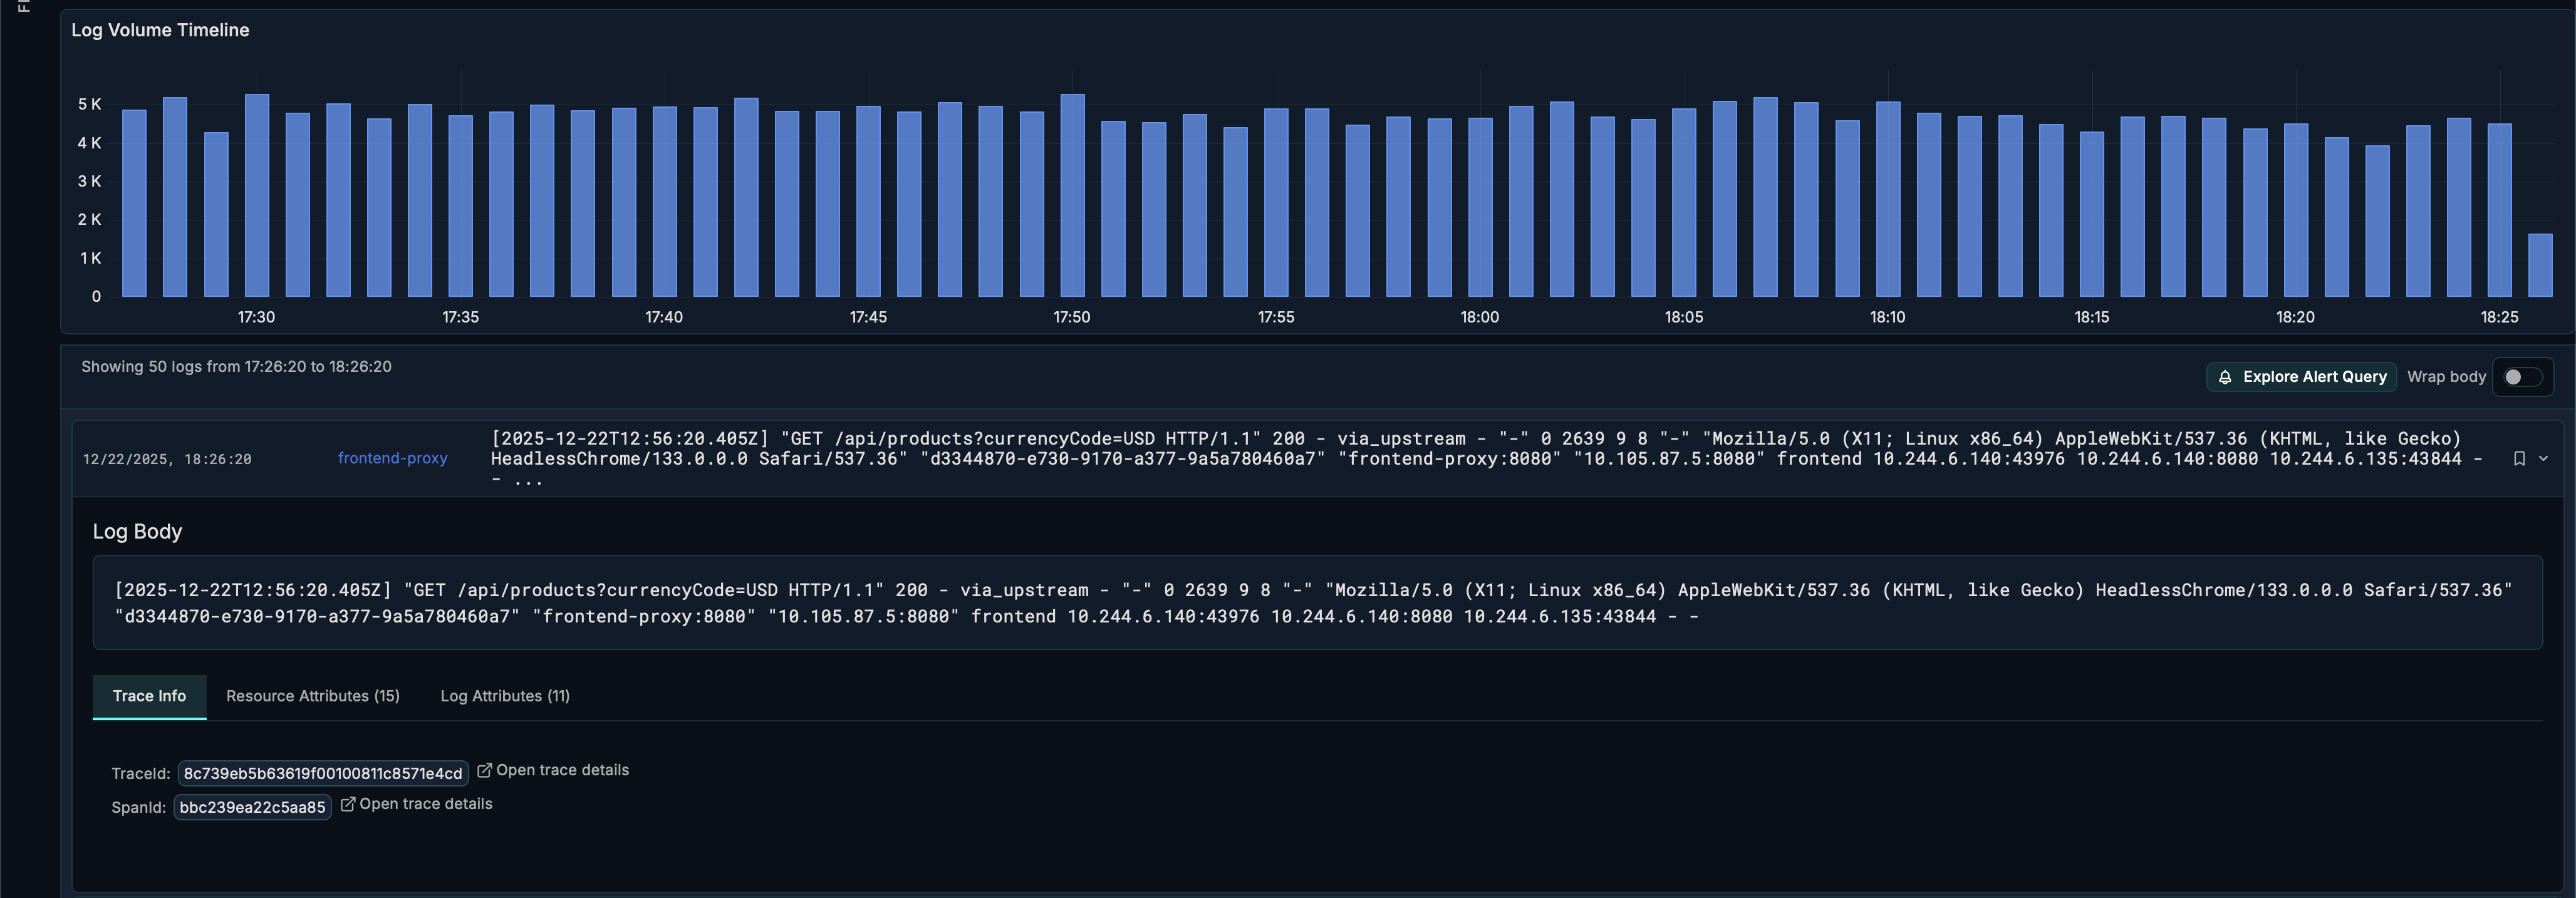
Trace Integration
When logs have trace context, you can navigate to the full trace:
- Expand a log with a Trace ID
- Go to the Trace Info tab
- Click on Open trace details to open TraceX
- See the complete distributed trace
Generating Alerts
Create alerts based on log patterns:
- Find a log that represents the pattern you want to alert on
- Expand the log and click Explore Alert Query
- Copy the ClickHouse query
- Create a new Grafana alert rule with this query
Configuration
Access configuration at Administration → Plugins → logX → Configuration.
| Setting | Description | Default |
|---|---|---|
| Database Name | ClickHouse database | default |
| Environments | Comma-separated list | staging,production |
| Environment Attribute Key | Resource attribute for env | environment |
| Max Time Range | Maximum query range | 1h |
| Max Unfiltered Range | Max range without filters | 15m |
| Max Variable Options | Dropdown option limit | 100 |
| Show Search Bar | Toggle search panel | true |
| Enable RBAC Filtering | Team-based service filtering | false |
RBAC (Role-Based Access Control)
When enabled, service visibility is restricted based on Grafana team membership:
- Teams must follow naming pattern:
{ServiceName}-viewer(e.g.,api-gateway-viewer) - Users only see services from teams they belong to
- All queries are automatically filtered to permitted services
URL Parameters
logX state is persisted in the URL for bookmarking and sharing:
| Parameter | Description |
|---|---|
from / to | Time range |
var-service_name | Selected services |
var-environment | Selected environment |
var-searchLogBody | Text search query |
pinned | Comma-separated pinned log IDs |
Share the URL to give others the exact same view.
Related Guides
- Creating Alerts with logX — Set up alerts based on log patterns