Flutter Mobile Observability
Mobile apps face observability challenges that backend services do not: devices run on battery, connectivity is unreliable, and the OS can kill your app at any time. OpenTelemetry gives you traces, metrics, and error data from your Flutter app exported to any OTLP-compatible collector.
This guide walks you through adding the scout_flutter SDK, initializing it
in your app, and verifying that spans reach your collector.
Storing and querying these sessions at production volume is what base14 Scout does. Check out Scout RUM.
Time to Complete
15-20 minutes
What You'll Accomplish
- Add the
scout_flutterSDK to your Flutter project - Initialize zero-config RUM in your app entry point
- Verify spans are flowing to your collector
Prerequisites
- Flutter SDK 3.7.0+ and Dart SDK 3.7.0+ installed
- A running OpenTelemetry Collector with an OTLP endpoint (see Docker Compose Setup for local development)
- An existing Flutter app to instrument
Telemetry Architecture
Before instrumenting your app, decide how telemetry gets from the device to Scout. There are two deployment models.
Recommended: OTel Collector with API Gateway
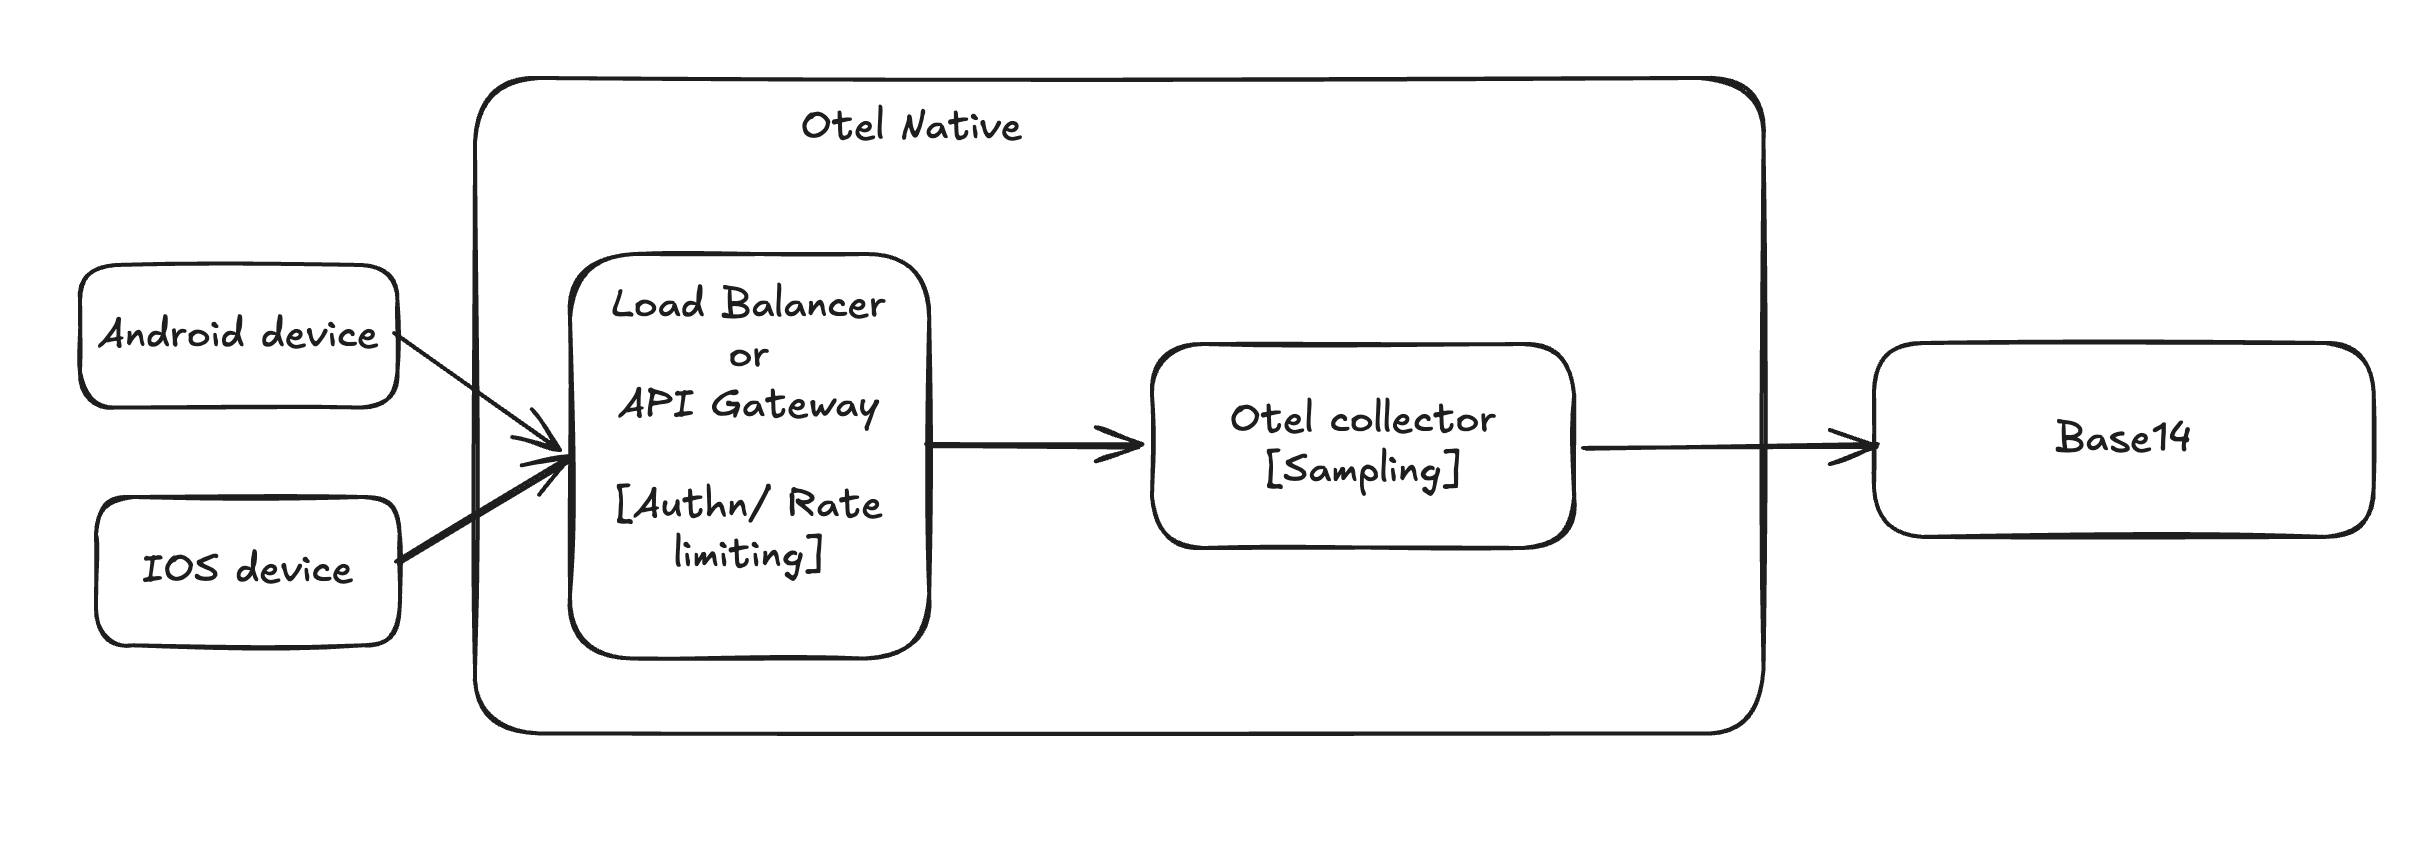
Devices send OTLP data to a load balancer or API gateway, which handles authentication and rate limiting. The gateway forwards traffic to an OTel collector that applies server-side sampling before exporting to Scout.
Alternative: Direct to Scout
Devices send OTLP data directly to the Scout ingestion endpoint, authenticating with OAuth tokens that the app manages.
Comparison
| Collector + API Gateway | Direct to Scout | |
|---|---|---|
| Authentication | API gateway handles auth centrally - app only needs an API key or static token | App must manage OAuth token lifecycle (acquire, refresh, retry on 401) |
| Credential security | Credentials stay on your infra - app ships a lightweight key that the gateway validates | OAuth client secret must be embedded or fetched at runtime - risk of extraction from APK/IPA |
| Rate limiting | API gateway enforces per-device or per-app rate limits - protects backend from traffic spikes | No rate limiting - a buggy release can flood Scout with telemetry |
| Server-side sampling | OTel collector applies tail sampling (e.g. keep all errors, sample 10% of healthy spans) - reduces cost without losing signal | All sampling must happen on-device - you lose the ability to make sampling decisions with full context |
| Buffering and retry | Collector buffers and retries on export failure - device fire-and-forget | App must handle retry logic and local buffering if Scout is unreachable |
| Schema evolution | Collector processors can rename attributes, drop PII, or add resource attributes without app updates | Any schema change requires an app release and user update |
| Network efficiency | Gateway can terminate TLS at the edge, compress, and batch - lower overhead per device | Each device opens its own TLS connection to Scout - more overhead at scale |
| Operational cost | Requires running a collector and gateway (but these are standard infra components) | No additional infra to manage |
| Deployment complexity | Moderate - collector + gateway config | Low - just configure the Scout endpoint in the app |
| Best for | Production apps with multiple devices, teams that want control over sampling and PII | Prototypes, internal tools, or apps with a small user base |
Use the Collector + API Gateway approach for production apps. The ability to rate limit, sample server-side, strip PII, and rotate credentials without app updates far outweighs the small infra cost. Reserve Direct to Scout for prototypes or internal tools where simplicity matters more than control.
Step 1: Add the SDK
The scout_flutter SDK is a single package with one initialize() call —
it auto-captures the full RUM set (taps, navigation, errors, native crashes,
ANR, HTTP, frame metrics, logs) and exports OTLP, with no pipeline to
hand-build. It is published on
pub.dev. Add it to your
pubspec.yaml:
dependencies:
  scout_flutter: ^0.2.0
Then install:
flutter pub get
Step 2: Initialize Telemetry
Initialize the SDK before runApp() in lib/main.dart:
import 'dart:async';
import 'package:flutter/material.dart';
import 'package:scout_flutter/scout_flutter.dart';

Future<void> main() async {
  WidgetsFlutterBinding.ensureInitialized();
  // Fire-and-forget — never block app startup on SDK init.
  unawaited(ScoutFlutter.initialize(
    config: ScoutFlutterConfig(
      serviceName: 'my-app',
      endpoint: 'https://otel.example.com',
      headers: const {'Authorization': 'Bearer <token>'},
    ),
  ));
  runApp(ScoutFlutter.observeScroll(child: const MyApp()));
}
Attach ScoutFlutter.navigatorObserver to every Navigator for screen
tracking. See the SDK reference for the
full configuration surface.
Then run:
flutter run
Step 3: Verify Telemetry
Once the app is running, confirm spans are reaching your collector.
-
Check collector logs - look for incoming OTLP requests:
docker logs otel-collector 2>&1 | grep -i "traces" -
Look for expected span names:
screen_view,user_interaction,http.request,app_startup,error,native_crash,anr
-
Open Scout - navigate to the Traces view and filter by
service.name = your-app-name. You should see spans arriving within 30 seconds of app activity.
Troubleshooting: If no spans appear, check that the
OTEL_TRACE_ENDPOINTenvironment variable or hardcoded endpoint matches your collector's OTLP receiver address. See Troubleshooting Missing Telemetry Data for common issues.
Next Steps
- Scout Flutter SDK reference - full configuration and capability reference
- Create Your First Dashboard - build dashboards from your mobile telemetry data
- Creating Alerts with LogX - set up alerts on crash rates, ANR counts, or slow screen loads
- Troubleshooting Missing Telemetry Data
- diagnose issues when spans are not arriving