Evaluating Database Monitoring Solutions: A Framework for Engineering Leaders

It was 5:30 AM when Riya (name changed), VP of Engineering at a Series C e-commerce company, got the page. Morning traffic was climbing into triple digits and catalog latency had spiked to twelve seconds. Within minutes, Slack was flooded with alerts from three different monitoring tools, each painting a partial picture. The APM showed slow API calls. The infrastructure dashboard showed normal CPU and memory. The dedicated PostgreSQL monitoring tool showed elevated query times, but offered no correlation to what changed upstream. Riya watched as her on-call engineers spent the first forty minutes of the incident jumping between dashboards, arguing over whether this was a database problem or an application problem. By the time they traced the issue to a query introduced in the previous night's deployment, the checkout flow had been degraded for nearly ninety minutes. The postmortem would later reveal that all the data needed to diagnose the issue existed within five minutes of the alert firing. It was scattered across three tools, owned by two teams, and required manual timeline alignment to interpret. Riya realized the problem was not instrumentation. It was fragmentation.
The Hidden Cost Model of Fragmented Observability
Engineering leaders evaluating PostgreSQL monitoring solutions typically focus on feature checklists: which metrics are collected, how dashboards look, what alerting options exist. These are reasonable starting points, but they obscure a more significant cost driver that compounds over time.
Fragmented observability, the practice of monitoring databases separately from applications and infrastructure, introduces costs that do not appear on any vendor invoice. These costs manifest as slower incident resolution, reduced velocity in shipping software, erosion of operational culture, and the gradual accumulation of knowledge silos.
Impact on Incident Resolution
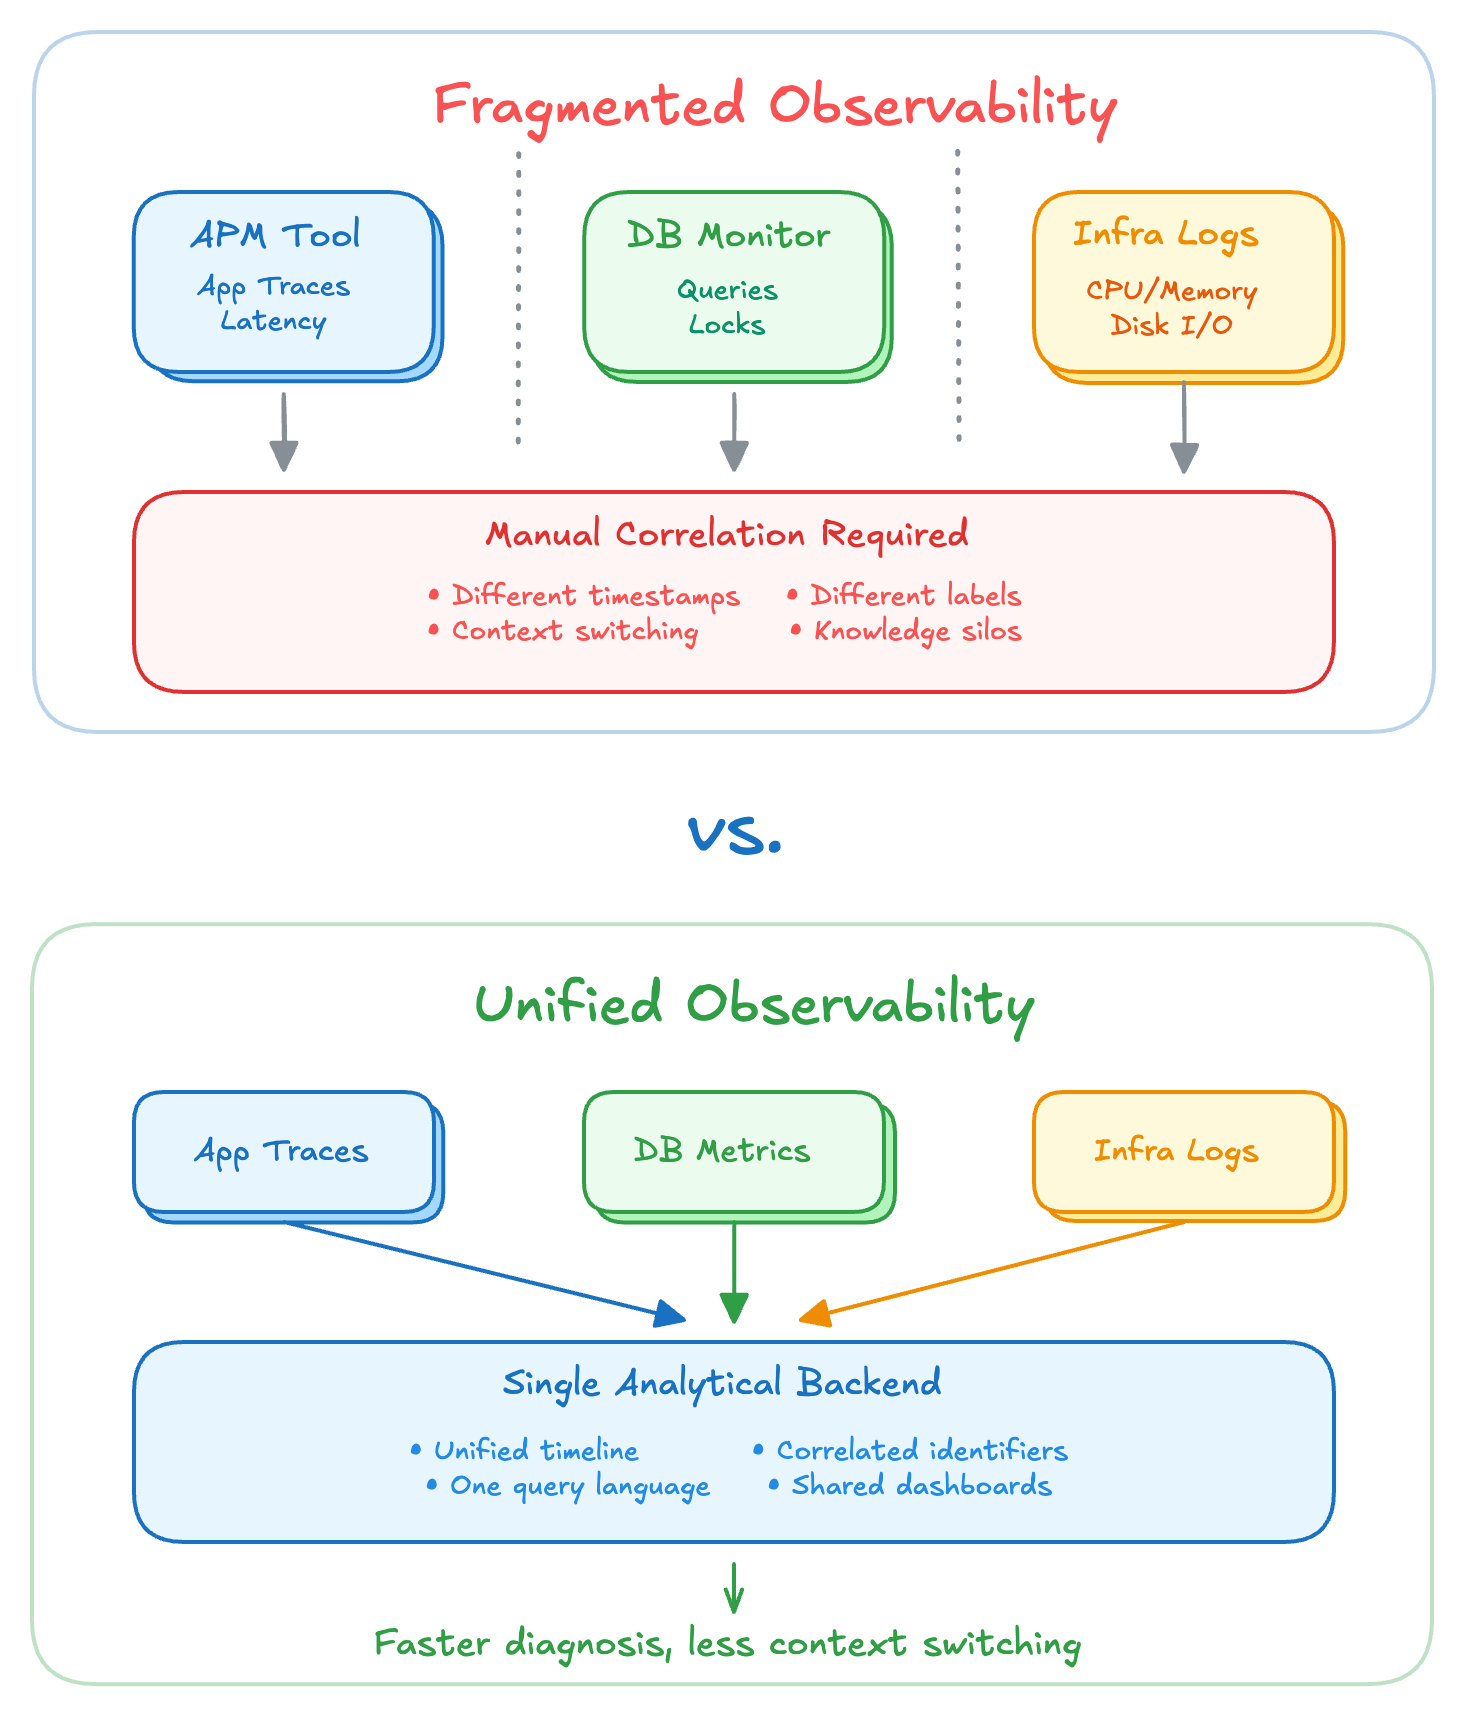
The most immediately measurable cost of fragmented observability is extended mean time to resolution. When database metrics live in one tool, application traces in another, and infrastructure signals in a third, engineers must perform manual correlation before diagnosis can begin.
This correlation tax applies to every incident where the root cause is not immediately obvious. Engineers must align timelines across tools by eyeballing timestamps. They must mentally map application identifiers to database identifiers, since different tools use different labeling conventions. They must context-switch between interfaces, each with its own query language and navigation model.
For straightforward issues, this overhead might add ten or fifteen minutes. For complex incidents involving interaction between application behavior and database state, the overhead can dominate the entire investigation. Riya's team spent forty minutes establishing that the database was the victim rather than the cause, before they could begin examining what the previous night's deployment had changed.
Impact on Software Delivery Velocity
The effects extend beyond incident response into day-to-day development. Teams that cannot quickly understand how their changes affect database behavior tend to ship more conservatively, or worse, ship without understanding the database implications at all.
Consider a team deploying a new feature that introduces a new query pattern. With unified observability, they can watch application latency and database behavior on the same timeline, verify that the new queries perform as expected, and catch regressions before users notice them. With fragmented observability, this verification requires opening multiple tools, manually correlating deployment timestamps, and hoping that the metrics granularity aligns closely enough to draw conclusions. Many times they don't even have access to the database monitoring tool, which is owned by a separate team.
Most teams, facing this friction, skip the verification. They deploy and rely on alerts to catch problems. This shifts the feedback loop from proactive to reactive, from minutes to hours. Over time, teams develop less intuition about how their code interacts with the database. Performance regressions creep in gradually rather than being caught immediately.
Impact on Operational Culture
Fragmented observability shapes organizational behavior in ways that extend beyond tooling. When database monitoring is separated from application monitoring, ownership boundaries tend to follow the same split.
This creates a predictable dynamic during incidents. Application teams point to normal application metrics and suggest the database is at fault. Database teams point to normal database metrics and suggest the application is at fault. The first phase of incident response becomes political rather than technical.
Even outside of incidents, the cultural effects are significant. Application developers, lacking integrated visibility into database behavior, treat the database as a black box. Database expertise becomes concentrated in a small number of individuals who become bottlenecks for any work that touches performance.
The Knowledge Silo Problem
Perhaps the most insidious cost of fragmented observability is the creation of knowledge silos. When PostgreSQL monitoring lives in a separate tool, understanding that tool becomes a specialized skill. A small number of engineers develop expertise in the interface, learn which metrics matter, build mental models of how to interpret the data.
This expertise does not transfer. When those engineers leave or are unavailable during an incident, the organization's ability to diagnose database issues degrades significantly. The tools are still there, the metrics are still being collected, but the interpretive knowledge required to use them effectively has walked out the door.
Unified observability does not eliminate the need for database expertise, but it makes that expertise more accessible. When database metrics appear alongside application traces in the same interface, using the same query patterns and visualization conventions, engineers can learn by exposure rather than requiring dedicated study of a separate tooling ecosystem.
A Framework for Evaluation
Given these costs, how should engineering leaders approach PostgreSQL monitoring evaluation? Feature comparisons remain necessary, but they should be secondary to a more fundamental question: does this solution reduce or increase fragmentation?
| Criterion | What to Evaluate |
|---|---|
| Data Unification | Do database metrics, application traces, and infrastructure signals end up in the same analytical backend? Can they be queried together, correlated programmatically, and visualized on shared timelines? |
| Identifier Consistency | When a slow application request touches the database, can you trace from the request to the specific queries it executed? Are there shared identifiers for services, hosts, databases, and requests? |
| Workflow Integration | During an incident, can engineers move from symptom to diagnosis to root cause within a single interface? Or must they export data, switch tools, and maintain mental state across context switches? |
| Knowledge Distribution | Does the solution concentrate expertise or distribute it? Do interfaces follow familiar patterns? Do they surface relevant context without requiring specialized query construction? |
The Strategic Choice
Engineering leaders face a choice that will shape their organization's operational capability for years. They can continue adding specialized tools, each excellent in its domain, and accept the ongoing cost of manual correlation, knowledge silos, and fragmented ownership. Or they can prioritize integration, accepting that the best PostgreSQL metrics are worthless if they cannot be understood in context.
The organizations that resolve incidents quickly, ship with confidence, and maintain distributed operational expertise are those where the data needed to understand system behavior is accessible to the engineers who need it, when they need it, without requiring tool-switching or tribal knowledge to interpret.
Conclusion
The change that brought down Riya's checkout flow was a single line modification to a product listing query. A developer had added a filter to support a new search feature. The change worked correctly in staging, where the product catalog had a few hundred items. In production, with tens of thousands of products and no index on the new filter column, the query went from milliseconds to seconds. The deployment had gone out at 11 PM with no load testing, no database review, and no way for the on-call engineer to quickly connect the new code path to the degraded query.
The fix took five minutes once identified. The diagnosis took eighty-five. With unified observability, the deployment marker would have appeared on the same timeline as the latency spike, the slow query would have been traceable to the specific application endpoint, and the missing index would have been visible in the same interface. Riya's team would have been back in bed by 6 AM. Instead, they spent the morning writing a postmortem about tooling fragmentation.
This is exactly what we built pgX for. pgX unifies PostgreSQL monitoring with application traces and infrastructure metrics in a single platform. When a deployment causes query degradation, you see the deployment marker, the latency spike, and the slow query on the same timeline—no tool-switching required. See how pgX works →
Related Reading
- Why Unified Observability Matters for Growing Engineering Teams — The case for consolidating your monitoring stack
- Introducing pgX: Unified Database and Application Monitoring — How pgX bridges the gap between database and application observability
- Understanding What Increases and Reduces MTTR — Actionable strategies to cut incident resolution time